Chinese Optics Letters, 2020, 18 (12): 121701, Published Online: Sep. 27, 2020   

Optical-resolution photoacoustic microscopy continually monitors macrophages activities of acute inflammation in vivo Download: 962次

Author Affiliations
1 State Key Laboratory of Molecular Vaccinology and Molecular Diagnostics & Center for Molecular Imaging and Translational Medicine, School of Public Health, Xiamen University, Xiamen 361102, China
2 State Key Laboratory of Precision Electronic Manufacturing Technology and Equipment, School of Electromechanical Engineering, Guangdong University of Technology, Guangzhou 510006, China
3 Jiangxi Key Laboratory of Optic-Electronic and Communication, Jiangxi Science and Technology Normal University, Nanchang 330038, China
Abstract
Photoacoustic imaging has been developed to image the immune study at the macro scale. Macrophages play diverse roles in the acute response to infection and tissue repair. However, macrophages activities in acute inflammation at the microscopic level still remain challenging. In this work, we proposed optical-resolution photoacoustic microscopy to promptly monitor the labeled macrophages activities in normal and inflammatory groups. The result showed that many labeled macrophages emerged around the vessels firstly, then exuded into tissues, and finally disappeared in the inflammatory group injected with labeled macrophages. In summary, our method allows us to exactly image and track the immune cells of inflammatory diseases.

Macrophages are a heterogeneous population of resident and recruited cells that are found in all organs[1], which are an important part of the mononuclear phagocyte system to maintain the stability of the immune system[2]. Macrophages also play a critical role in tissue repair and remodeling, as well as in the orchestration of the host’s response to infectious diseases through secretion of cytokines, enzymes, and reactive oxygen species[1]. They can display significant plasticity and change their physiology according to environmental cues to produce different cell populations with different functions[3]. In the process of inflammation, macrophages are activated and involved in the autoregulatory loop of inflammation. Their main role is to produce a variety of cytokines and growth factors for antigen presentation, phagocytosis, and immune regulation[4].

Now, in vivo clinical imaging tools for noninvasive macrophage quantification are expected to predict patients’ clinical outcome, define treatment options, and monitor therapy responses[5]. But, imaging the immune cells still focuses on the preclinical study that is limited by the technique development. Optical imaging offers exceptional opportunities to visualize and quantify multiple dynamic events in living cells with high resolution[6]. Fluorescence imaging as a conventional optical imaging technique has opened the possibility of generating bespoke reagents to image cellular activity in real time[79" target="_self" style="display: inline;">–9]. However, the limited penetration depth of confocal and two-photon microscopy usually requires skin surgery during imaging[10]. Moreover, long-term observation of most fluorescent dyes is not realistic because of photo-bleaching[11].

As a new non-destructive imaging method, photoacoustic (PA) imaging has been widely used in biomedical research, such as brain disease[12,13]. The scale of PA imaging extends from organelles, cells, tissues, and organs to the whole body[14]. Optical-resolution PA microscopy (OR-PAM) has high spatial resolution and large penetration depth. Now, it has many different forms, for example, the portable OR-PAM was used in stomatology[15]. The blind-deconvolution OR-PAM can provide a lateral resolution ∼2-fold finer than that of conventional OR-PAM[16]. OR-PAM has been applied to different biomedical applications, such as monitoring vascular normalization during anti-angiogenic therapy[17], imaging early-stage nanocarrier-enhanced chemotherapy response in living subjects[18], and assessing the burn healing[19]. It was used to monitor the vessels in inflammation induced by lipopolysaccharide[20]. Micro-electro mechanical system (MEMS)-OR-PAM as a rapid imaging technique was also used to monitor the vessel changes[21]. PA imaging was used to image the immune cells labeled with silica-coated nanorods[22] and the immune cell activities at the macro scale[23]. But, these studies did not involve any immune cell activities at the microscopic level to the best of our knowledge.

In this study, we set up an OR-PAM system and further employed the MEMS technique for fast imaging. Its lateral resolution was characterized to be 6.7 μm, allowing us to image both microvessels and cells noninvasively at a rapid speed. OR-PAM was used to image the macrophages labeled with ink in a petri dish. At first, we injected the labeled macrophages through the tail vein. The modeled mouse ear was established right away by smearing xylene evenly. Then, we observed the changes of blood vessels in 92.5 min by OR-PAM. It can be seen that macrophages gathered together near the vessels at the beginning of inflammation and then infiltrated into tissue fluid to swallow the inflammatory substances. With the ear recovered from inflammation, they left away from this region. From quantitative data, we also found the vessel changes in a modeled ear injected with macrophages returned to before in the end. OR-PAM promises to be an important way to provide accurate position information of immune cells for immunotherapy in vivo.

As shown in Fig. 1(a), the wavelength of the pulsed laser source is 532 nm (AONano 532-1-40-V, Advanced Optowave Corporation) with 5 kHz repetition rate, and the pulse width is 7 ns. The laser passed an optical filter (NDC-50C-4M-A, Thorlabs) to weaken the energy and split the laser beam. Most lasers focused on a single model fiber (460HP, Coherent/Nufern) by an objective lens (RMS4X, 0.1 NA, Thorlabs). A partial laser was delivered to a photodiode (DET10A, Thorlabs). Passing through a collimation lens to keep traveling in a straight line, the laser was then enlarged by beam expanders for better focus. Reflected off the mirror, the laser crossed another objective lens (RMS4X, 0.1 NA, Thorlabs) to the surface of the imaging object. Finally, the sample produced a PA signal by absorbing the laser energy. This signal was detected by an ultrasonic transducer (V212-BB-RM, Olympus) with 20 MHz central frequency attached to the beam combiner, which contained a fused silica right angle prism (32-332, Edmund Optics) and a rhomboid prism (49-419, Edmund Optics) with silicon oil in the middle. During the imaging, a circular groove with a plastic wrap bottom filled with water was used to transmit the ultrasound wave. The imaging object surface daubed with an ultrasonic coupling agent was placed under the wrap. The acquisition module marked by an undertint cuboid in Fig. 1(a) was driven by two stepper motors (GCD-0301M, Daheng Optics) to realize plane scanning. The PA signal was amplified 48 dB by an amplifier (5072PR, Olympus) and collected by a data acquisition card (CSE1422, GaGe Applied Science) with a 200 MHz/s sampling frequency. An MEMS-OR-PAM[21] with ∼8 μm lateral resolution had an imaging speed about 16 s per 2mm×2mm area. The laser with a repetition rate of 10 kHz was focused and reflected by a mirror controlled by MEMS to the sample. PA signals were detected by an ultrasonic transducer with 20 MHz central frequency. The laser energy in the tissue surface was ∼380 nJ/pulse. By adjusting the optical focus at ∼0.1 mm below the skin surface, the surface laser fluence was about 20.6mJ/cm2, which was close to the American National Standards Institute safety limit (20mJ/cm2 for visible wavelengths). MATLAB (R2018a, Math Works) was used for image reconstruction and processing.

Fig. 1. OR-PAM system. (a) OR-PAM and MEMS-OR-PAM system scheme. (b) The ESF and LSF of a sharp edge.

下载图片 查看所有图片

As can be seen in Fig. 1(b), a knife with a sharp edge was imaged with a step size of 1 μm by OR-PAM to measure the resolution. The edge spread function (ESF) was obtained by fitting the original signal, which is calculated by the distribution of the maximum PA signal. Its first derivative was taken as the line spread function (LSF). The lateral resolution was determined by the full width at half-maximum (FWHM) of the LSF, which was about 6.7 μm.

The RAW 264.7 cell line was chosen as the experiment cells to observe immune activities in inflammation, because it was well-characterized with regard to macrophage-mediated immune, metabolic, and phagocytic functions[24]. First of all, the commercial ink (Hu-Kaiwen ink) was filtered with a 0.22 μm filter and then added to the petri dish and incubated with the cells for 24 h (10% ink, 90% medium). The growth of the cells was not inhibited. The petri dish was washed with phosphate buffered saline (PBS) three times in order to wash off the free ink on the cells’ surface and the dish. Finally, the labeled cells were obtained by digestion centrifugation and made into suspension for in vivo imaging.

Balb/c nude mice were purchased from the experimental animal center of Xiamen University (5–8 weeks, 18 g). In the course of the experiment, the operating standards of experimental animals were strictly followed. OR-PAM was used to image the normal mouse ear. Then, the inflammation model was established by applying 20 μL xylene to the mouse ears evenly. Four groups were examined, including a normal ear control group, normal ear group injected with labeled macrophages, modeled ear group, and modeled ear group injected with labeled macrophages.

We chose the region of interest in the signal and background areas and then calculated the average intensity of them as the signal-to-background ratio. We quantified vessel parameters by calculating vessel density, average diameter, ratio, and average PA intensity[20]. From the original PAM images, two-dimensional (2D) blood vessels with linear structure were enhanced by Hessian filtering[25] and binarized by using threshold method to separate the signal from the background. The skeleton was obtained by eroding the vessel edge, and then the skeleton length was calculated to quantify the density. We used eight adjacent pixels’ field of each point on the vascular skeleton as the target to calculate the length. The length divided by two was considered as the actual vessel length. For the diameter, we obtained the skeleton normal of each point in the skeleton curve and calculated the length between the first two intersections of the normal with the binary vessel as the diameter of each vessel. The vessel diameter is defined by the average extracted diameter. The sum of the blood vessel intensity over the number of pixels in the image was defined as the average signal intensity. The vessel ratio was calculated by the signal pixels divided by the total pixels in the binarization image.

As shown in Fig. 2, some black stuff was found in the macrophages incubated with the ink [Fig. 2(a)], which means that macrophages swallowed ink so that they had the capability of PA imaging. It was proved by PA images [Fig. 2(b)] that the labeled macrophages incubated in the medium for 24 h can be detected by OR-PAM, but the non-labeled macrophages cultured for 24 h under the same conditions had no PA signal. There were 10 million cells incubated in a petri dish with a diameter of 15 cm. The number of cells per square centimeter was about 56,000, which showed a signal-to-background ratio[18] of four [Fig. 2(c)], but the intensities of vessel and agminated macrophages in the petri dish had no difference. For in vivo imaging, OR-PAM was used to image the normal mouse ear first [Fig. 2(d)]. In order to obtain quantitative parameters of blood vessels, the original image needed to be processed. A Hessian filter was applied to the original image to improve the vessel signal [Fig. 2(e)]. The skeleton extracted by morphology was considered as the centerline of the blood vessels, which was well along the vessels [Fig. 2(f)]. In addition, we gained the depth distribution of blood vessels, as is shown in Fig. 2(g), because ultrasonic transmission at different depths had a time difference. To identify macrophages activities, fluorescence imaging was used to image normal and modeled mouse ears injected with macrophages after 5 min, which were labeled with calcein-acetomethoxy. In Fig. 2(h), many macrophages were found around the vessel in the modeled mouse ear.

Fig. 2. Processing method of macrophage and vessel. (a) The optical microscopy images of labeled macrophages and macrophages. (b) The PA images of labeled macrophages, macrophages, and vessel by OR-PAM. (c) The PA intensities of labeled macrophages, macrophages background, and vessel. (d) The PA image of a normal mouse ear. (e) The PA image after the Hessian filter. (f) The centerline of the blood vessels. (g) The depth distribution of the PAM image. The scale bar is 500 μm. (h) The fluorescence images of normal and modeled mouse ears injected with macrophages.

下载图片 查看所有图片

We obtained PA images of the normal mouse ear group injected with labeled macrophages, modeled ear group, and modeled ear group injected with labeled macrophages by OR-PAM. Because the model is with acute inflammation, it can recover automatically in a short time. In order to observe macrophages activities after inflammation, we injected macrophages through the tail vein before modeling. We chose 10 min as the time interval to observe the macrophages movement throughout inflammation and an imaging range of 3mm×2mm. Each group consisted of at least three mice for statistical analysis. Edema may occur during the experiment, but it does not affect the PA imaging results since water absorbs very little light.

In the control group without modeling and macrophages [Fig. 3(a)] and the normal mouse ear group injected with labeled macrophages [Fig. 3(b)], no significant changes were observed in blood vessels. However, the PA intensity of the main vessels in 92.5 min was weaker than before, and some vessels vanished in the end. Because there was no aggregation of macrophages, their PA signal was not enough to be detected by our OR-PAM system. But, the mouse was anesthetized during the imaging process, so the circulation of blood was slower than before.
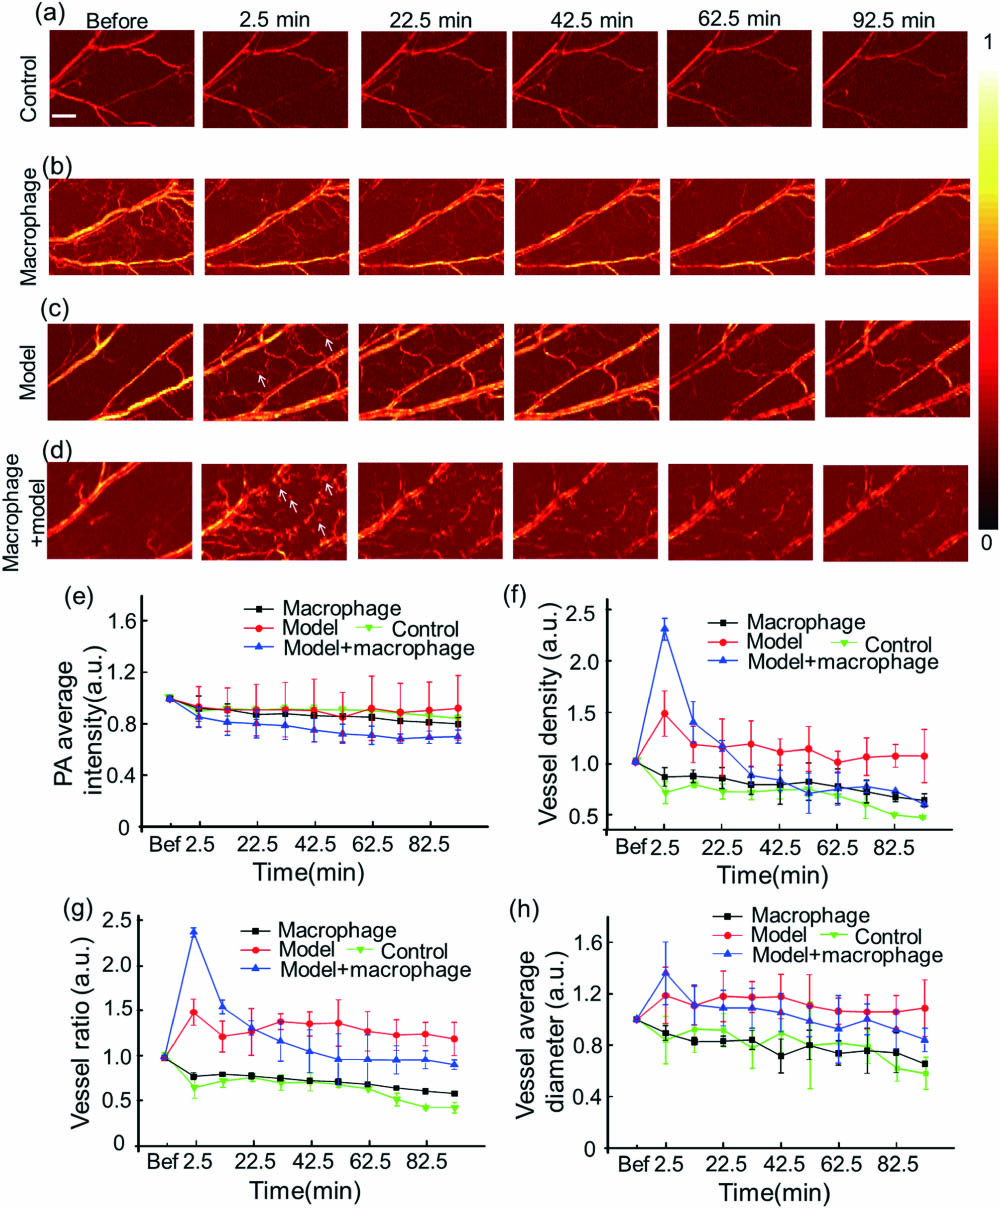
Fig. 3. Monitoring the vessel using OR-PAM. PA images of the (a) control group without modeling and macrophages, (b) normal mouse ear group injected with labeled macrophages, (c) modeled mouse ear group, and (d) modeled mouse ear group injected with labeled macrophages. (e) PA average intensity, (f) vessel density, (g) vessel ratio (the area of vessels signal/the area of the whole imaging), and (h) vessel average diameter of four groups. The white arrows point to the new vessels caused by inflammation, while the blue arrows represent labeled macrophages. The scale bar is 500 μm.

下载图片 查看所有图片

In the modeled mouse ear group [Fig. 3(c)], some microvessels can be detected at first because they were in the congestion caused by inflammation. After 22.5 min, their numbers started to decrease due to the autoimmune reaction. But the ear had not yet recovered completely in 92.5 min, so there were some vessels remaining at this moment. The arrows point to the new vessels caused by inflammation. The main vessel signal in Fig. 3(b) decreased during the 92.5 min, and some small vessels disappeared. However, more vessels emerged in 2.5 min, as indicated by the white arrows, caused by inflammatory vascular congestion and then decreased in Fig. 3(c).

In the modeled mouse ear group injected with macrophages [Fig. 3(d)], we observed that some diffuse spot-like signals appeared around the blood vessels first, which were not found in the modeled mouse group. These signals faded away with the passage of time and gradually disappeared in 62.5 min. Because macrophages gathered together in the vessels of the inflammatory area in the beginning and then permeated into interstitial fluid through the blood vessels to participate in phagocytosis of inflammatory cells and substance, it weakened the effect of inflammation. This allowed quite a number of macrophages in this area to immigrate. Eventually, the diffused macrophages signal disappeared in this group. In addition, the signal of the macrophages was weaker than that of the vessels, due to the different optical absorption and the cell aggregation efficiency in vivo. The arrows represent the labeled macrophages in the vessels and interstitial fluid.

Quantitative parameters of blood vessels also help to assess the macrophage activities. These data of each group were normalized to the average values before, because it can mitigate the issue of sample differences among different groups. The 2D structure reconstructed by a maximum amplitude projection algorithm was used for quantitative analysis[19]. There was no remarkable difference in the average PA intensity of blood vessels among the four groups [Fig. 3(e)], because the PA intensities of new vessels and macrophages were lower than that of the main vessels. The main vessel was congestive during the inflammation that had higher intensity, but the new vessels and macrophages had lower intensity, and thus the intensity changed slightly. But, the density [Fig. 3(f)] and ratio [Fig. 3(g)] of blood vessels were notably discrepant. In the normal mouse ear group injected with macrophages and the control group, they consistently decreased in 92.5 min. However, in the modeled mouse ear injected with macrophages and modeled ear groups, they increased at first because of the arisen microvessels induced by inflammation. Then, they decreased because these vessels disappeared with inflammation weakening. Moreover, in the modeled mouse ear injected with macrophages, the macrophages were calculated as the signal of vessels in the processing, so they were larger than others in the beginning. Then, they reduced more because these macrophages participated in immune activities, and the inflammation subsided faster, which made the macrophages fade and vascular changes recover more quickly. Finally, they returned to the primary level on account of elimination of inflammation.

For the average diameter of blood vessels [Fig. 3(h)], there were few changes among four groups. Inflammation altered the vascular permeability, resulting in vessel vasodilation. The diameter of the main vessel increased with the arisen small vessels because of the inflammation. These made the diameter change a little at the beginning of it. But, the vessel diameter of the modeled mouse ear group was wider than that of the other groups in the end, because the inflammation had not completely subsided in this group. While in the modeled mouse ear group injected with macrophages, the congestion of blood vessels was terminated by these cells participating in the inflammatory response and eventually restored the blood vessels to their original state.

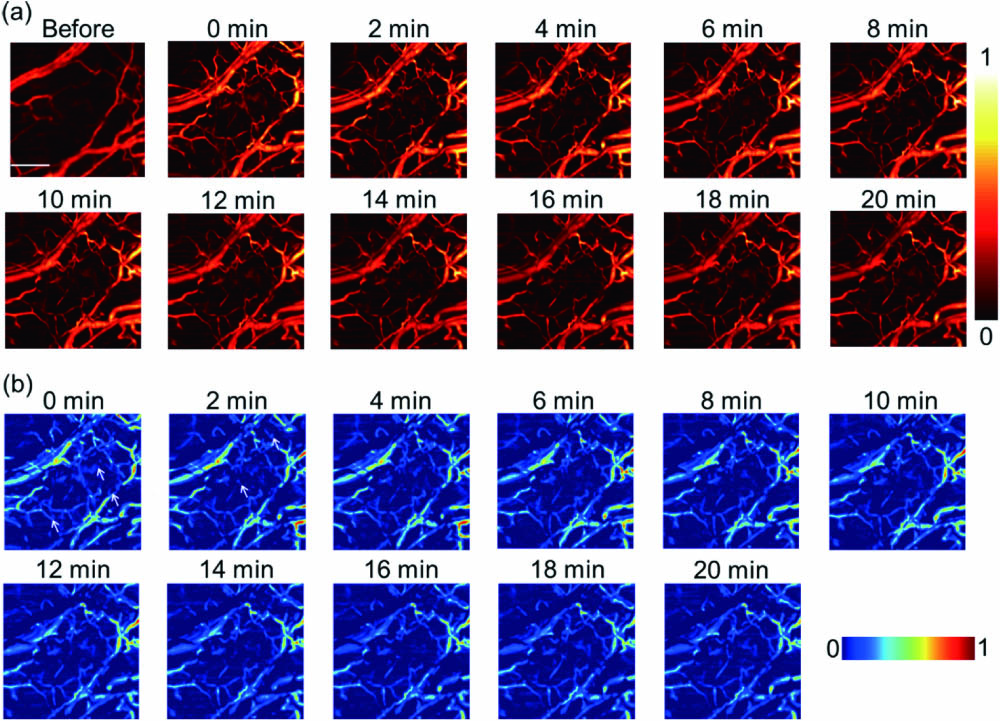
In order to monitor the movement of macrophages more precisely after inflammation, the acquisition interval was set to 2 min in the modeled mouse ear injected with macrophages group by MEMS-OR-PAM with a small range, because MEMS had an imaging speed of 16 s per 2mm×2mm area [Fig. 4(a)]. It can be observed that the discrete dot signals around the blood vessels appeared after modeling, which reached the maximum value within 10 min and then slowly disappeared. The PA intensity of the main vessels increased at the beginning of inflammation. Afterwards, macrophages participated in the inflammatory reaction to recede, so that the discrete signals around the blood vessels gradually decrease, and the vessels begin to recover. In Fig. 4(b), the macrophage distribution was clearly reflected by subtracting the images of the mouse ear before modeling from the modeled ear injected with cells at different time points. The macrophages signal displayed discrete points, while the vessel showed continuous straps. In the beginning of inflammation, the macrophages had a trend to gather around the vessels. Then, they reached the inflammation area to devour the inflammatory substance to make the vessel recover gradually and they withdrew as the inflammation weakened.

Fig. 4. Monitoring the vessel changes by MEMS-OR-PAM through 20 min. (a) PA images of the modeled mouse ear group injected with macrophages in 20 min. (b) The images were obtained by subtracting the ear before modeling from the modeled ear injected with macrophages. The arrows represent the dispersion labeled macrophages. The scale bar is 500 μm.

下载图片 查看所有图片

An OR-PAM system was built in our lab, which had a 6.7 μm lateral resolution. By the technique, the macrophage activities in inflammation were clearly visualized. In the modeled mouse ear injected with the macrophages group, some diffuse signals were detected around the vessels, and the main vessels’ diameter increased. After 62.5 min, the dotted signals disappeared, and the changes of vessels returned to the original state; however, no similar phenomenon was observed in other groups. From the quantitative data, the changes of vascular parameters returned to the initial state at last, while those in the modeled mouse ear group did not recover. In the acute inflammation, the macrophages tended to accumulate in the vessels first and then exuded into tissues to participate in phagocytosis of inflammatory cells. With the organism recovered from this situation, the cells gradually withdrew because they had less prone aggregation. Finally, they disappeared in this area until the immune behaviors ended. In summary, we can precisely trace the immune cells activities of inflammation with OR-PAM. This study will provide a new imaging method to study in vivo immune cells activities. In this work, we focused on blood vessels and cells activity in a large inflammation area in vivo. Our OR-PAM system, which achieved high-resolution imaging at a rapid imaging speed, can well meet both demands. This study will provide a new imaging method to study in vivo immune cells activities. In brief, the high-resolution system permits accurate information of macrophages activities in a rapid way.

References

[1] GordonS., Nat. Rev. Immunol.3, 23 (2003).NRIABX1474-1733

[2] OkabeY.MedzhitovR., Nat. Immunol.17, 9 (2016).NRIABX1474-1733

[3] MosserD. M.EdwardsJ. P., Nat. Rev. Immunol.8, 958 (2008).NRIABX1474-1733

[4] FujiwaraN.KobayashiK., Current Drug Targets-Inflammation Allergy4, 281 (2005).

[5] WeisslederR.NahrendorfM.PittetM. J., Nat. Mater.13, 125 (2014).NMAACR1476-1122

[6] NawaY.InamiW.LinS.KawataY.TerakawaS., Opt. Express23, 14561 (2015).OPEXFF1094-4087

[7] PolandS. P.KrstajićN.MonypennyJ.CoelhoS.TyndallD.WalkerR. J.DevaugesV.RichardsonJ.DuttonN.BarberP.LiD. D.-U.SuhlingK.NgT.HendersonR. K.Ameer-BegS. M., Biomed. Opt. Express6, 277 (2015).BOEICL2156-7085

[8] DubeyV.AhmadA.SinghR.WolfsonD. L.BasnetP.AcharyaG.MehtaD. S.AhluwaliaB. S., Opt. Express26, 19864 (2018).OPEXFF1094-4087

[9] CummingsR. J.MitraS.LordE. M.FosterT. H., J. Biomed. Opt.13, 044041 (2008).JBOPFO1083-3668

[10] LuC.ZhangP.ChenS.ZhuJ.XuX.HuangH., Opt. Express26, 28902 (2018).OPEXFF1094-4087

[11] Resch-GengerU.GrabolleM.Cavaliere-JaricotS.NitschkeR.NannT., Nat. Methods5, 763 (2008).1548-7091

[12] NieL.CaiX.MaslovK.GarciauribeA.AnastasioM. A.WangL. V., J. Biomed. Opt.17, 110506 (2012).JBOPFO1083-3668

[13] LvJ.LiS.ZhangJ.DuanF.WuZ.ChenM.HuangS.MaH.NieL., Theranostics10, 816 (2020).

[14] WangL. V.HuS., Science335, 1458 (2012).SCIEAS0036-8075

[15] JinT.GuoH.JiangH.KeB.XiL., Opt. Lett.42, 4434 (2017).OPLEDP0146-9592

[16] ChenJ.LinR.WangH.MengJ.ZhengH.SongL., Opt. Express21, 7316 (2013).OPEXFF1094-4087

[17] ZhouH.ChenN.ZhaoH.YinT.ZhangJ.ZhengW.SongL.LiuC.ZhengR., Photoacoustics15, 100143 (2019).

[18] NieL.HuangP.LiW.YanX.JinA.WangZ.TangY.WangS.ZhangX.NiuG.ChenX., ACS Nano8, 12141 (2014).ANCAC31936-0851

[19] WuZ.DuanF.ZhangJ.LiS.MaH.NieL., Biomed. Opt. Express10, 3425 (2019).BOEICL2156-7085

[20] GuoZ.LiZ.DengY.ChenS. L., J. Biophoton.12, e201800251 (2019).

[21] KimJ. Y.LeeC.ParkK.LimG.KimC., Sci. Rep.5, 7932 (2015).SRCEC32045-2322

[22] JoshiP. P.YoonS. J.ChenY.-S.EmelianovS.SokolovK. V., Biomed. Opt. Express4, 2609 (2013).BOEICL2156-7085

[23] ZhengS.LiH.LaiK.ChenM.FuG.LiuW. H.FuG.NieL., J. Biophotonics11, e201800073 (2018).

[24] KongL.SmithW.HaoD., J. Cell. Mol. Med.23, 3077 (2019).

[25] AnnunziataR.GarzelliA.BalleriniL.MecocciA.TruccoE., IEEE J. Biomed. Health Inform.20, 1129 (2016).

Fei Duan, Haosong Ma, Jinde Zhang, Shi Li, Honghui Li, Zhiyou Wu, Fengqiu Hong, Lüming Zeng, Liming Nie. Optical-resolution photoacoustic microscopy continually monitors macrophages activities of acute inflammation in vivo[J]. Chinese Optics Letters, 2020, 18(12): 121701.

本文已被 1 篇论文引用
被引统计数据来源于中国光学期刊网
引用该论文: TXT   |   EndNote

相关论文

加载中...

关于本站 Cookie 的使用提示

中国光学期刊网使用基于 cookie 的技术来更好地为您提供各项服务,点击此处了解我们的隐私策略。 如您需继续使用本网站,请您授权我们使用本地 cookie 来保存部分信息。
全站搜索
您最值得信赖的光电行业旗舰网络服务平台!