Chinese Optics Letters, 2020, 18 (6): 060604, Published Online: May. 19, 2020   

Polarization scrambling characteristic analysis based on density of polarization states statistics Download: 589次

Author Affiliations
Key Laboratory on Luminescence and Optical Information Technology, Ministry of Education, Beijing Jiaotong University, Beijing 100044, China
Abstract
We report a new method to deeply analyze the scrambling characteristic of polarization scramblers based on density of polarization states (DPS) statistics that makes it possible to describe the DPS distribution in detail on the whole Poincaré sphere, thus easy to locate accurately the nonuniform areas of defective polarization scramblers, which cannot be realized by existing methods. We have built a polarization scrambling system to demonstrate the advantages of our method compared with others by experiments and suggested effective evaluation indexes whose validity is well confirmed by applying to a commercial scrambler. Our conclusions are valuable for accurately analyzing and diagnosing the performance of any polarization scrambler, and quality evaluation of polarization controllers or other polarization devices.

Polarization-induced penalties such as polarization mode dispersion (PMD) and polarization-dependent loss/gain (PDL/PDG), are crucial obstacles to fully realizing ultra-highspeed long-haul fiber-optic backbone transmission systems[15" target="_self" style="display: inline;">5]. A polarization scrambler, which produces randomly scrambled states of polarization (SOPs), can mitigate greatly the PMD or PDL/PDG and evaluate accurately their penalties, thus attracting much more attention[69" target="_self" style="display: inline;">9]. Polarization scrambling is usually carried out directly by a polarization controller with a special algorithm[10] that can be realized in varied ways; for example, fiber bending or squeezing[1113" target="_self" style="display: inline;">–13], nonlinear effect in fiber[14,15], liquid core fiber[16], magnetic field modulated D-shaped fiber[17], and Si photonic integrated circuits[18]. Recently, some researchers performed polarization scrambling based on a polarization controller made of a LiNbO3 waveguide, and obtained a good uniformity and high scrambling speed (up to 10 Mrad/s)[1921" target="_self" style="display: inline;">–21]. However, due to high insertion loss (IL), large PDL, and high cost, it is difficult to employ in high-power optical trunk line systems.

Alternatively, a polarization scrambler made of a fiber squeezer can overcome all of the above shortcomings, since it has less IL, PDL, and a lower cost, showing great potential for practical applications. Taking advantages of such a scrambler, Yao et al. achieved quasi-uniform rate polarization scrambling at 752 krad/s[12]. To indicate the scrambling uniformity, they use the concept of degree-of-polarization (DOP). It is convenient to operate, but only gives global information, which omits all the local distribution nonuniformity. In addition, the geometric approach to characterize polarization effects has several applications, such as entropy and DOP for nonlinear optical waves[22], a correlation-based method to quantify the homogeneity of random fields[23,24], quantum polarization distributions[25], and self-polarization effects[26]. To deeply analyze the scrambling characteristics, we propose in this Letter a novel method based on density of polarization states (DPS) statistics[26], which can provide the uniformity of any part on the Poincaré sphere. Then we develop the experimental polarization scrambler made of three fiber squeezers, and demonstrate the effectivity of our method. Moreover, we further discuss its unique advantage by comparing with the Stokes components statistics[27]. Finally, by the employment of a commercial polarization scrambler, we show the perfect scrambling uniformity according to the appraisal strategy. The results are available for accurate analysis of any kind of polarization scrambler, and the quality evaluation of polarization controllers or other polarization devices.

In Stokes space, the SOPs at the input and output of a voltage (u)-controlled fiber-squeezing scrambler are related by a Muller matrix M(u)[13]: where Sin, Sout are the input and output Stokes vectors.

An arbitrary small spherical crown, as shown in Fig. 1(a), can be defined uniquely by its central point P, and the parameter k(0<k<1) as the distance between two center points of the small part and its cross section.

Fig. 1. Schematic representation of the DPS statistics: (a) sampling a certain part of the Poincaré sphere for DPS statistics, k, the distance between two center points of the sampling part and its cross section; (b) scrambling simulation results of 10,000 polarization states; (c) complete DPS distribution of the results in (b).

下载图片 查看所有图片

In polar coordinates, P can be described by a unit vector Sp,

Choosing suitable θ, φ, and k values, we can get any part of the sphere surface whose scrambling uniformity is required to be evaluated.

Obviously, any output SOP (Sout) of the scrambler can be expressed by Eq. (2). Since the input SOP is usually fixed when a scrambler works, Sout is only related to the driving voltage (u).

According to the model we previously proposed in Ref. [13], we simulate the polarization scrambling based on random voltage driving by using MATLAB, whose results are plotted in Fig. 1(b), where the amount of the output SOPs is 10,000 and the fixed input SOP Sin is (0.5134, 0.6123, 0.6013).

To describe completely the scrambling uniformity of any parts on the Poincaré sphere, we make use of the DPS statistics. Given a certain spherical crown with an area of Σ and the DPS as ρs, its normalized average DPS can be expressed by where N is the total amount of polarization states on the whole sphere’s surface. When Σ completely covers the surface of the unitary sphere, one can find that ρ=ρ0.

By comparing the values between ρ and ρ0, we can obtain the following conclusions for qualitatively describing the scrambling uniformity.

System.Xml.XmlElementSystem.Xml.XmlElementSystem.Xml.XmlElementSystem.Xml.XmlElementSystem.Xml.XmlElement

Now we analyze the DPS of the data in Fig. 1(b) according to Eq. (3). For instance, when setting k=0.6 and taking 200 samples (choosing σ and θ as a random uniform distribution), we obtain the results in Fig. 1(c) in which the red and blue caps represent the DPS distribution on the upper and lower hemispheres, respectively, while the middle green one is the equator plane. To further quantify the scrambling uniformity, we calculate the average DPS and its standard deviation σ and find that they are σ1=0.0095 and σ2=0.0074 for the upper and lower hemispheres, which show the DPS has perfect uniformity.

In general, when k0.1, if the average DPS deviates from ρ0 less than 0.01 and σ0.02 for 200 samples, the polarization scrambler will possess outstanding scrambling uniformity and satisfy most of the engineering applications.

To demonstrate above results, we build the experimental polarization scrambling system shown in Fig. 2, where the main unit is a polarization controller (PolaRITETM II, General Photonics), which is made up of three fiber squeezers based on piezoelectric ceramics (PZT). The 1550 nm CW laser beam passes through a manual polarization controller, which generates the required input SOP for polarization scrambling. Three fiber squeezers, which squeeze the fiber at 0°, 45°, and 0°, respectively, are driven by a voltage amplifier controlled by the computer. Assisted by the LabVIEW program, we can generate random voltages following different distributions, such as uniform, normal, and Rayleigh distributions, which drive the PolaRITETM II to scramble the output SOPs. At the output end, the SOPs are measured by a polarization analyzer (POD-101D, General Photonics).

Fig. 2. Experimental setup for polarization scrambling. PC: manual polarization controller, PZT: piezoelectric ceramics, PA: polarization analyzer.

下载图片 查看所有图片

To obtain enough data for uniformity analysis, we continuously record 10,000 output SOPs by the polarization analyzer. Figure 3(a) shows the total experiment results. Then we choose k equal to 0.1, and take two hundred groups of SOPs as samples. After calculation, we obtain that the average DPS is 0.0823, which deviates +0.0027 from ρ0, while the standard deviation σ=0.0194. The statistical distribution is presented in Fig. 3(b), where the red line denotes the DPS with absolute uniformity ρ0. Obviously, the DPS above the red line indicates the SOPs are in a dense area, while below it they are in a sparse area. Comparing the experimental results with the evaluation standard suggested as above, one can find that our polarization scrambling system has a good uniformity.
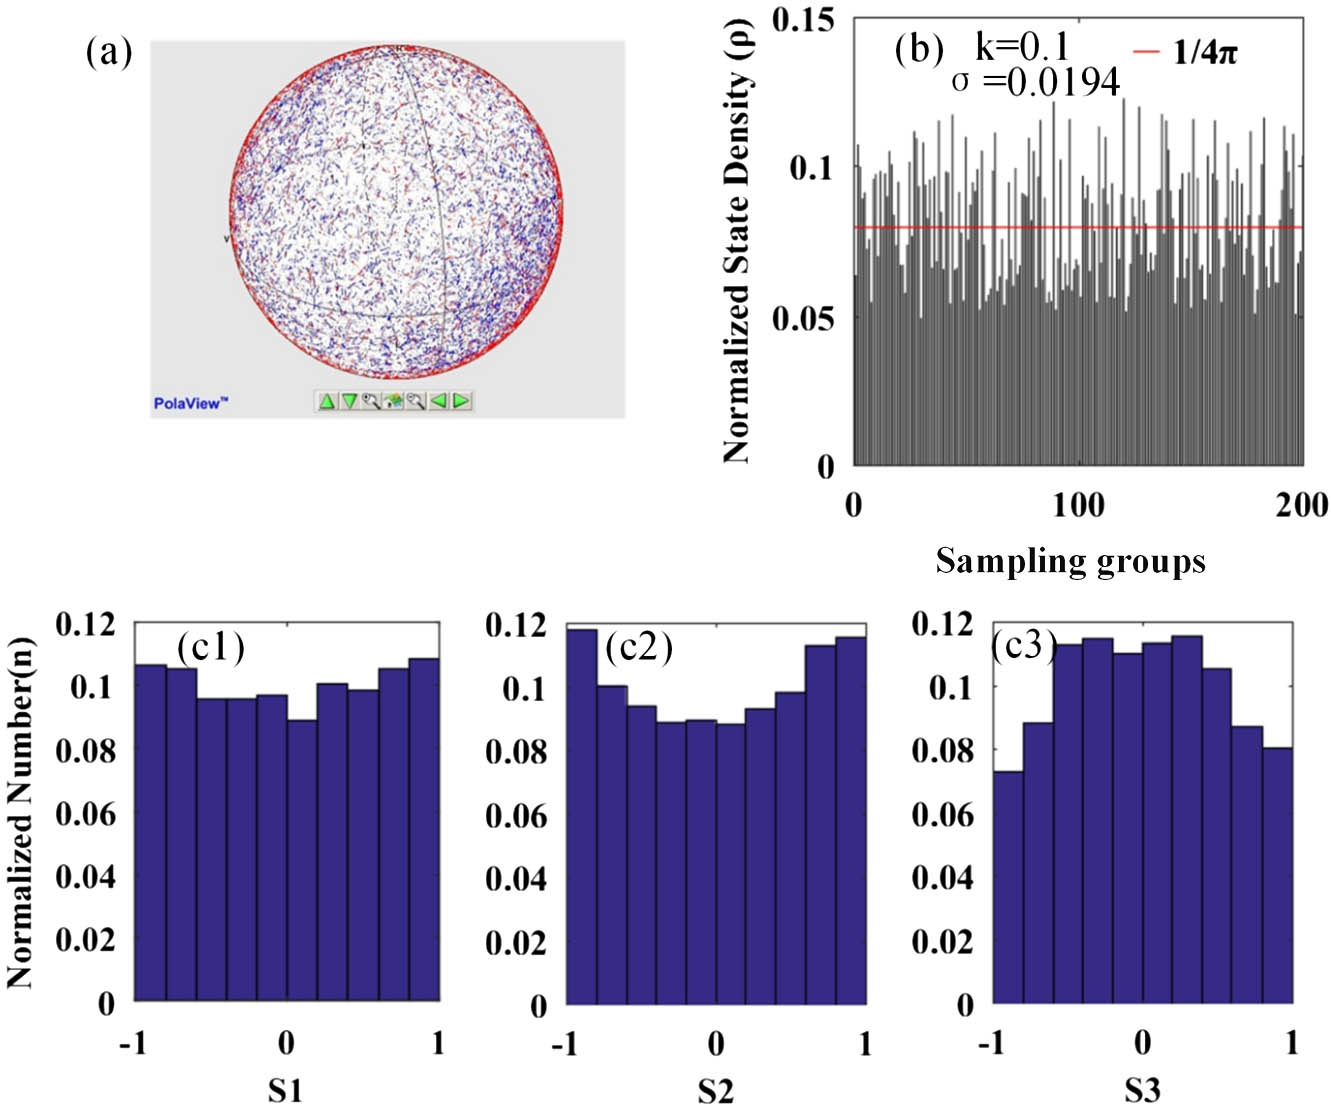
Fig. 3. (a) Experiment scrambling results of 10,000 polarization states; (b) normalized DPS statistics for k=0.1; (c1)–(c3) histograms obtained by the Stokes components analysis method.

下载图片 查看所有图片

To further confirm it, we use the Stokes components analysis method as adopted in Ref. [27], and plot the results in Figs. 3(c1)3(c3). It is easy to observe that all of three Stokes components fluctuate slightly, which means the uniformity of our scrambler is good enough.

In practical cases, it is necessary to accurately figure out the area with bad uniformity to improve the performance of a scrambler, and then the DPS statistics method will be a very useful tool. That cannot be realized by Stokes components or DOP analysis methods because both of them omit the local address information of the SOP distribution.

Let us consider a special case: when some driving parts of the polarization scrambling system are wrong, the output SOPs will distribute as shown in Fig. 4(a) (S1<0, S2<0, S3<0; S1>0, S2>0, S3>0), where it shows undoubtedly that the DPS is absolutely nonuniform because there are many blind parts on the Poincaré sphere, although the SOPs distribute uniformly in the emerging area.
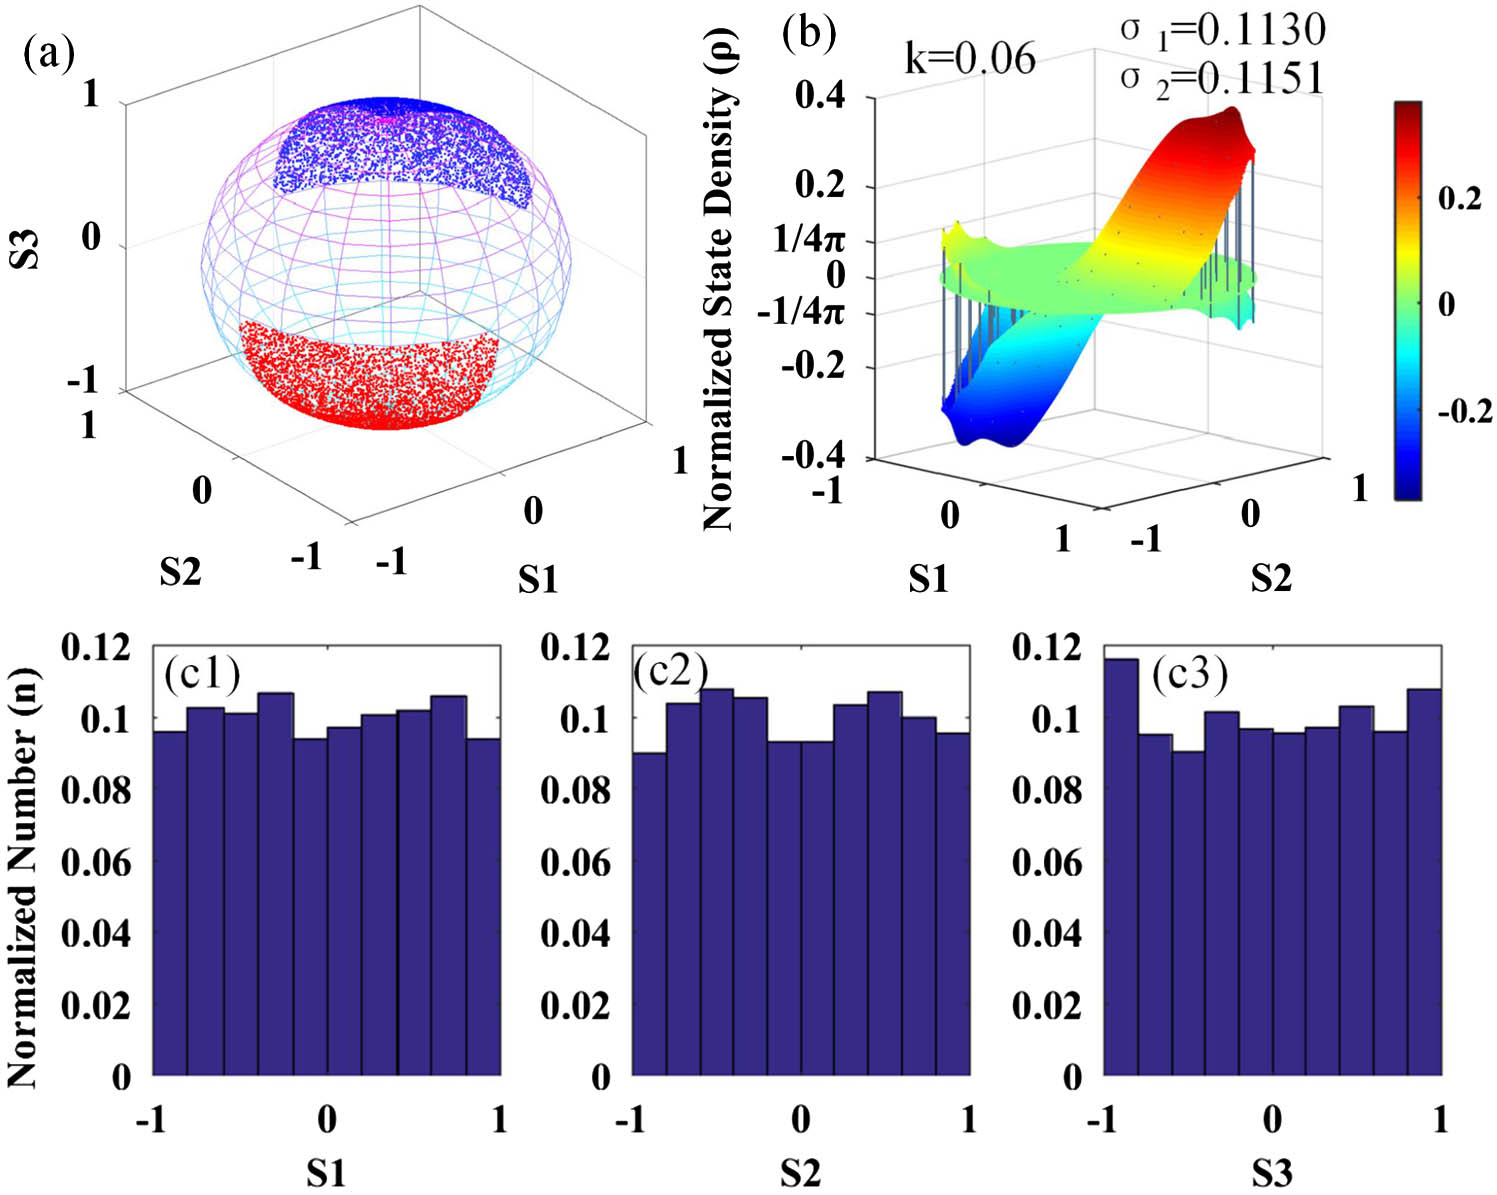
Fig. 4. (a) SOP distribution on the Poincaré sphere for a defective polarization scrambling system (S1<0, S2<0, S3<0; S1>0, S2>0, S3>0); (b) complete normalized DPS statistics for k=0.06; (c1)–(c3) accompanying histograms obtained by the Stokes components analysis method.

下载图片 查看所有图片

To make it clear, we use the DPS statistics method. As shown in Fig. 1(c), we set k=0.06 and obtain the results in Fig. 4(b), where we can locate the blind areas accurately; moreover, we can also give the DPS uniformity in the SOP-covering areas whose average DPS is 0.0838 with standard deviations σ1=0.1130 (upper) and σ2=0.1151 (lower), which is much worse according to the evaluation standard. It is also evidenced by comparing the normalized average DPS ρ0(1/4π).

However, if using the Stokes components analysis method, we can still get the uniform distribution as illustrated in Figs. 4(c1)4(c3) from which one will draw a wrong conclusion that the scrambler has good uniformity.

Finally, we apply the DPS statistics method to analyze a high-performance commercial scrambler (PCD-104, General Photonics). The experimental setup is similar to that in Fig. 2. We measure and record continuously 10,000 SOPs by the polarization analyzer that are plotted in Fig. 5(a). To evaluate the scrambling uniformity, we set k=0.1, and acquire 200 samples of SOPs. By carefully calculating, we find the average DPS is 0.0792, which deviates only 0.0004 from the absolute uniformity ρ0, while the standard deviations are σ1=0.0061 (upper) and σ2=0.0088 (lower). All of these results confirm the scrambler has perfect scrambling uniformity, which can also be observed intuitively in Fig. 5(b).
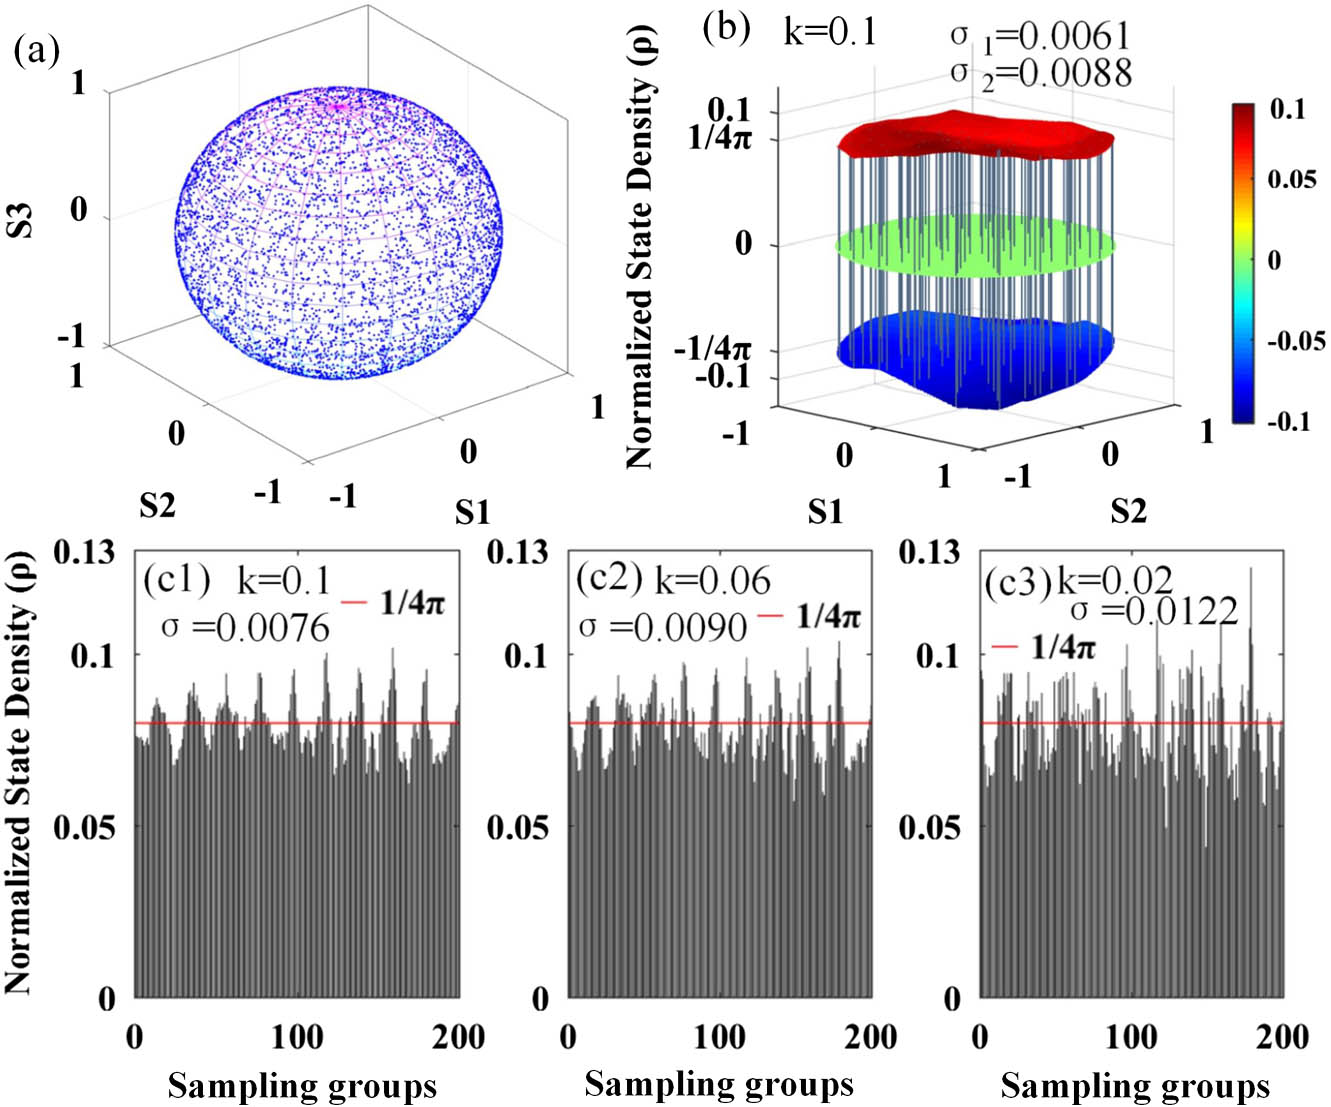
Fig. 5. (a) 10,000 SOPs distribution on the Poincaré sphere for a commercial scrambler; (b) complete normalized DPS statistics for k=0.1; (c1)–(c3) corresponding histograms of DPS statistics at different values of k.

下载图片 查看所有图片

Furthermore, we analyze the relationship between the evaluation results and the parameter k. Figures 5(c1)5(c3) present three histograms of the DPS for different values (0.1, 0.06, and 0.02) of k, where the average DPSs are 0.0792, 0.0791, and 0.0790, with standard deviations 0.0076, 0.0090, and 0.0122, respectively. It is clear that as the value of k increases, the average DPS decreases a little, while the standard deviation goes up, but the relative variation magnitude is much smaller than that of the parameter k. Thus, it is reasonable for us to choose k0.1 as the suitable condition for evaluation of polarization scrambling uniformity.

In summary, we propose and demonstrate the novel DPS statistics method to evaluate the scrambling performance of polarization scramblers that can provide complete DPS distribution on the whole Poincaré sphere, so it is easy to accurately locate the nonuniform areas for improvement of a defective polarization scrambler, while any other methods cannot realize it. We have proved the advantages of our method compared with others by experiments. By application to a commercial scrambler, we further confirm the validity of the evaluation standard. Our results are available to accurately analyze and diagnose the scrambling uniformity of any polarization scrambler, and are also valid for quality evaluation of polarization controllers or other polarization devices.

References

[1] RashleighS. C.MarroneM. J., Opt. Lett.8, 127 (1983).OPLEDP0146-9592

[2] SunnerudH.XieC.KarlssonM.AndreksonP. A., J. Lightwave Technol.20, 368 (2002).JLTEDG0733-8724

[3] XieC.LiuX.BulowH., IEEE Photonics Technol. Lett.20, 6 (2008).IPTLEL1041-1135

[4] HanZ.SunC.JinX.JiangH.YaoC.ZhangS.LiuW.GengT.PengF.SunW.YuanL., Chin. Opt. Lett.16, 100601 (2018).CJOEE31671-7694

[5] WangB. C.LiZ. Y., Chin. Opt. Lett.18, 050601 (2020).CJOEE31671-7694

[6] HanD.ChenH., Opt. Commun.44, 2327 (2012).OPCOB80030-4018

[7] LiuX.XieC.van WijngaardenA., in Optical Fiber Communication Conference (2004), paper WE2.

[8] HanD.XiL.LiM.ChenH.LiuF., Chin. Opt. Lett.9, 070604 (2011).CJOEE31671-7694

[9] SandelD.MirvodaV.BhandareS., J. Lightwave Technol.21, 1198 (2003).JLTEDG0733-8724

[10] LizeY. K.GommaR.KashyapR., Opt. Commun.279, 50 (2007).OPCOB80030-4018

[11] ShimizuH.YamazakiS.OnoT.EmuraK., J. Lightwave Technol.9, 1217 (1991).JLTEDG0733-8724

[12] YaoL.HuangH.ChengJ.TanE.WillnerA., Opt. Express20, 1691 (2012).OPEXFF1094-4087

[13] LiZ. Y.WuC. Q.YangS. S.TianC. Y., Chin. Phys. Lett.25, 1325 (2008).CPLEEU0256-307X

[14] GuasoniM.FatomeJ.WabnitzS., Opt. Lett.39, 5309 (2014).OPLEDP0146-9592

[15] GuasoniM.BonyP. Y.GillesM.PicozziA.FatomeJ., IEEE J. Sel. Top. Quantum Electron.22, 88 (2016).

[16] ArceM.TentoriD., in Latin America Optics and Photonics Conference (2014), p. 20.

[17] MaR.WanL.LiuX.LiX.JiangJ.XiaY., Chin. Opt. Lett.18, 010601 (2020).CJOEE31671-7694

[18] VelhaP.SorianelloV.PreiteM. V.Angelis,G. D.CasseseT., Opt. Lett.41, 5656 (2016).OPLEDP0146-9592

[19] HeismannF.TokudaK. L., Opt. Lett.20, 1008 (1995).OPLEDP0146-9592

[20] HeismannF.SmithR. W., Integr. Nanophoton. Resonators6, 464 (1996).

[21] HidayatA.KochB.ZhangH.MirvodaV.LichtingerM.SandelD.NoeR., Opt. Express16, 18984 (2008).OPEXFF1094-4087

[22] PicozziA., Opt. Lett.29, 1653 (2004).OPLEDP0146-9592

[23] EllisJ.DogariuA., Phys. Rev. Lett.95, 203905 (2005).PRLTAO0031-9007

[24] EllisJ.DogariuA., J. Opt. Soc. Am. A21, 988 (2004).

[25] LuisA., Phys. Rev. A71, 053801 (2005).

[26] FusaroA.BertiN.GuasoniM.JauslinH. R.PicozziA.FatomeJ.SugnyD., Phys. Rev. A99, 043826 (2019).

[27] YanL.YuQ.WillnerA. E., Opt. Commun.249, 43 (2005).OPCOB80030-4018

Shangchun Wang, Zhengyong Li. Polarization scrambling characteristic analysis based on density of polarization states statistics[J]. Chinese Optics Letters, 2020, 18(6): 060604.

本文已被 1 篇论文引用
被引统计数据来源于中国光学期刊网
引用该论文: TXT   |   EndNote

相关论文

加载中...

关于本站 Cookie 的使用提示

中国光学期刊网使用基于 cookie 的技术来更好地为您提供各项服务,点击此处了解我们的隐私策略。 如您需继续使用本网站,请您授权我们使用本地 cookie 来保存部分信息。
全站搜索
您最值得信赖的光电行业旗舰网络服务平台!