Simulation for embedded-defects foam terahertz images of active bifocal terahertz imaging system at 0.22 THz based on geometric optics  Download: 505次
1. Introduction
Active terahertz (THz) imaging systems have been shown to provide excellent capabilities for detecting and imaging hidden threats, contraband, and internal structures[1,2] in terms of nondestructive testing. A THz system that has the advantage of standoff observation is generally a multireflector continuous-wave system that collects signals of objects at different locations through rotating mirror scanning[3]. The research on this kind of system mainly focuses on imaging theory[4,5], the detection method[6], or an image-processing algorithm, while the imaging response of different targets is mostly based on actual measurement.
The propagation and scattering of THz waves should be considered to predict the detection results of the imaging system. Although the point spread function model has been used to convolve the objective function to obtain simulated THz images[7], this method generally does not consider the scattering caused by the object itself. In the THz band, the scattering characteristics of rough surfaces have been measured and calculated[8,9]. Based on ray tracing, the bidirectional reflectance distribution function has been used to simulate THz image of human body with rough surface[10]. A physical optics-based THz imaging simulator simulates the THz images of metal plates and mannequins[11]. It is not enough to only consider the rough surfaces scattering for detecting the internal structure of objects. The scattering characteristics of void structures inside the material are predicted by a point source synthesis model[12] or a ray-tracing model[13] in the case of vertical specular reflection. There is still a lack of THz imaging simulation that considers both the internal structure and the incidence angle.
In the visible band, the imaging system collects light from different reflection areas, causing the detected characteristics of the measured object to change, which is the same as the imaging results in the THz band[14]. The visible light scattering field from surface defects of optical components has been simulated by using an electromagnetic model[15–17]. The scattering field is then converted into a far-field distribution known as a visible image by using the angular spectrum theory. Although the electromagnetic simulation models have been applied to THz band scattering[18,19], the calculation time required for electrically large problems is very long.
In this paper, the THz images of foams with embedded stripe defects measured by an active bifocal THz imaging system[20] are rapidly simulated based on geometric optics (GO) and compared with the measurements. Due to the electrically large reflectors and imaging at long standoff distances, angular spectrum theory and ray tracing are used to obtain the incident field of the foam surface and the electric field distribution at the detector. The electric field distribution, which is modulated by ideal embedded stripe defects on the foam surface, is calculated by GO and the finite-element method (FEM), respectively. Section 2 establishes the numerical model of the imaging system. In Section 3, the images of defective foams at 0.22 THz are presented and compared with simulations. Section 4 provides some brief conclusions.
2. Modeling Imaging System
Figure 1(a) shows a photograph of the quasi-optical system, which includes the main mirror (MR), submirror (SR), tertiary feed reflector mirror (TFR), rotating mirror (RM), source (S), detector (D), and beam splitter (BS). The building process and principle of the system that only changes the imaging distance to achieve bifocal imaging are given in the previous work[20]. Figure 1(b) shows the parameters that describe the system. The standoff distance of 0.22 THz imaging is 8 m, and the field of view (FoV) is approximately [14]. The 0.22 THz sources are model AMC666. The homemade 0.22 THz detector has a noise equivalent power (NEP) of .

Fig. 1. (a) Photograph of the active bifocal THz imaging system; (b) 2D schematic of imaging.
The reflector surfaces of the system have an electrically large size, and pixel-by-pixel acquisition needs to be simulated, while the THz wave is a high-frequency electromagnetic wave. Considering the limited computational storage space and simulation efficiency, we simulate THz images of defective foams in two-dimensional space ( plane). Since the system has a larger scanning range in the direction, we selected strip defects with a symmetrical distribution in the axis for imaging in Section 3.
The term is the working wavenumber, and is the distance from the point on the front plane of the TFR to the radiation source. The incident wave on the front plane of the TFR can be expressed as
Considering the actual aperture size, the aperture function is introduced,
Equation (1) is rewritten as
According to the theory of angular spectrum diffraction, the monochromatic light-field distribution on a certain plane can be regarded as the superposition of monochromatic plane waves propagating in different directions. The amplitudes and phases of each plane wave depend on the argument and amplitude of the angular spectrum. The angular spectrum of the TRF incident wave is
Next, we establish the scattering model of the defective foams, as shown in Fig. 2. Defects are set as ideal rectangular defects, regardless of edge roughness, changes in refractive index, etc. Since an iron plate with strong reflective properties for THz waves was used in the experiment, the reflective surface is set as an ideal electrical conductor. GO calculations of the scattering field are similar to those of the incident field. In Fig. 2(a), the incident point () and total optical path () of the scattering field on the foam surface are obtained by geometric optical tracing of monochromatic light in different propagation directions. The scattering field is expressed as

Fig. 2. Defect scattering model. (a) Geometric optical model and (b) electromagnetic scattering model.
Finally, we calculate the electric field distribution at the detector [] analogously to the way that we calculated the incident field. The received light intensity is expressed as
3. THz Images and Simulations
The foam board is ethylene-vinyl acetate copolymer (EVA) with a size of and a thickness of 2 cm. We machined the embedded strip defects on one side of the EVA boards. Defects with both lengths and intervals of 10 cm are symmetrically distributed in the central axis of the EVA boards. Figures 3(a) and 3(b) show EVA boards with embedded horizontal strip defects. The widths of the strip defect are 0.6 cm in Fig. 3(a) and 3 cm in Fig. 3(b). We tested defects with depths of 0.5, 1, and 1.5 cm. The edge of the machined defects is relatively smooth, so we treat it as an ideal rectangular defect. Figure 3(c) shows the defect-free side of the EVA board. The defective side of the EVA board is adhered to the iron plate, which is fixed on the blackboard, as shown in Fig. 3(d). We have adjusted the system magnification to obtain THz images of different measured objects. To compare THz images, we use the maximum value per image for normalization and then display it on a logarithmic scale.
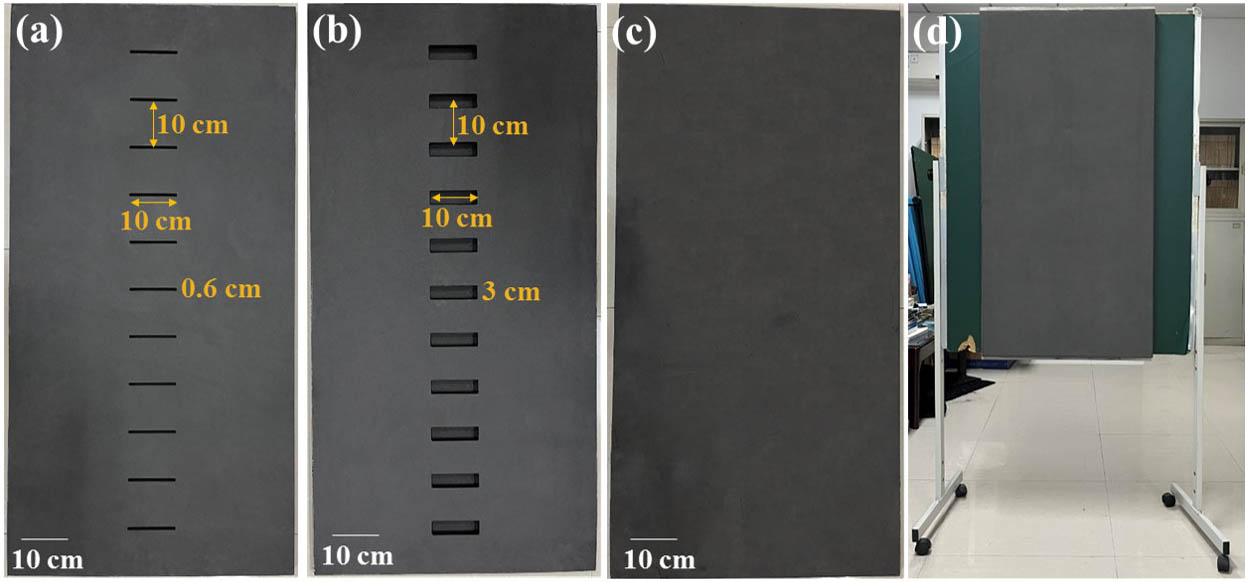
Fig. 3. Photograph of the foam board with embedded horizontal strip defects with widths of (a) 0.6 cm and (b) 3 cm; photograph of the (c) defect-free EVA board and (d) blackboard.
We measured the refractive index () of the EVA boards by the fiber-based THz TDS system[21,22]. At 0.22 THz, and . The images of defect-free foam boards at 0.22 THz are shown in Fig. 4(a). We compare the intensity at the center axis of the defect THz images with the simulations. Figure 4(b) shows the imaging results and simulations of the defect-free EVA at 0.22 THz. The simulations obtained by GO and FEM are almost the same. There are obvious wavy intensity changes in the imaging light spots, while the intensity of the simulated spot gradually decreases with increasing incident angle. There are two main reasons for the difference between imaging and simulation. One is the position of the imaging plane; the other is the adjustment accuracy of the imaging system. In the experiment, manually adjusting the system and the target position of the standoff distance is very complicated. Small errors in the real position of the target and the adjustment cause changes in the measurement intensity.
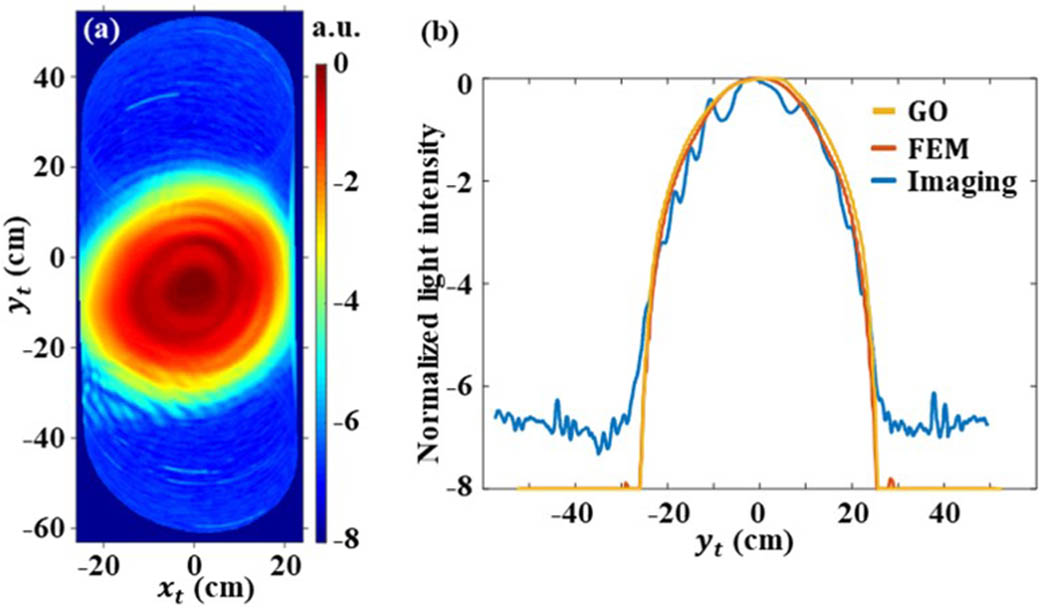
Fig. 4. (a) Images of defect-free EVA board at 0.22 THz; (b) comparison of the imaging results and simulations of defect-free EVA.
Figure 5 shows the THz images of the defective EVA board. The incident angle increases with the distance from the center of the FoV. As shown in Figs. 6(a1) and 6(a2), under the constant aperture, the receiving intensity gradually decreases, resulting in light spots [Fig. 4(b)]. The existence of defects changes the distribution of the light field. Figures 6(b1), 6(c1), 6(d1), and 6(e1) show a partial deviation from the original direction of specular reflection. Reflection deviation mainly occurs near the defect edge, as shown by the black dotted line in Figs. 6(b1) and 6(c1). Therefore, the specular reflection component decreases, and the diffuse reflection component increases. In Figs. 6(b2), 6(c2), 6(d2), and 6(e2), the black box shows the light-field distribution of the 60 cm aperture. The far-field distribution of the defect scattering field is basically not different, except for the coordinate migration. The greater the incidence angle, the greater the diffuse reflection proportion of the collected reflected light. Imaging features change from specular reflection to diffuse reflection.
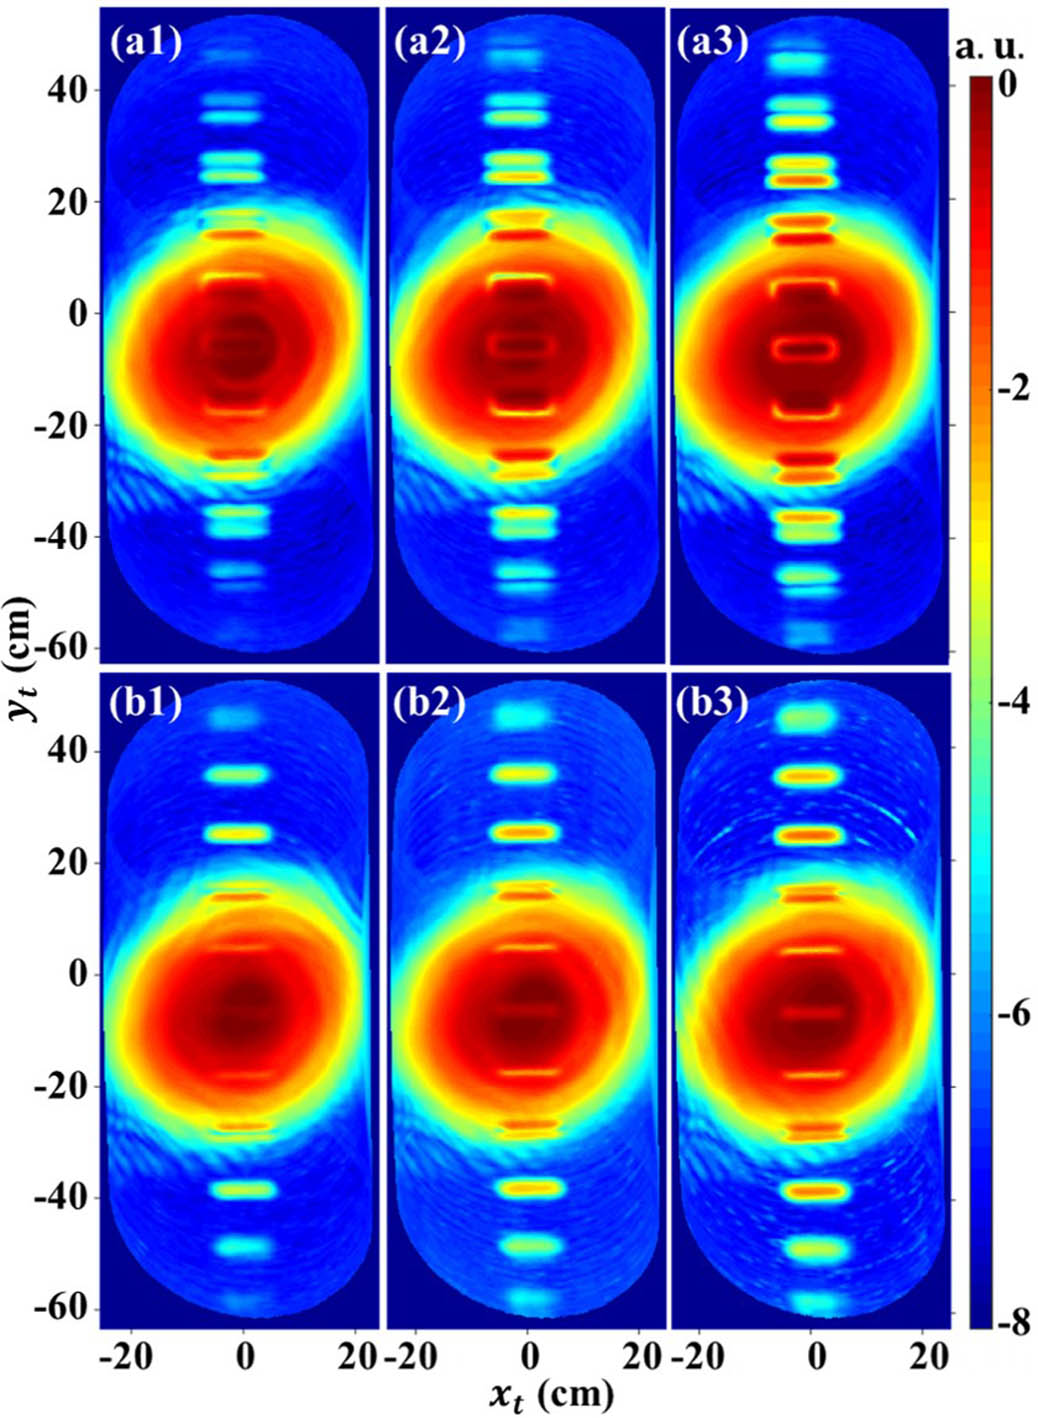
Fig. 5. 0.22 THz images. 3-cm-width embedded horizontal strip defects with depths of (a1) 0.5 cm, (a2) 1 cm, and (a3) 1.5 cm. 0.6-cm-width embedded horizontal strip defects with depths of (b1) 0.5 cm, (b2) 1 cm, and (b3) 1.5 cm.

Fig. 6. A 3-cm-width defect example. Scattering near-field distributions of partial scanning points of the (a1) defect-free foam board and 3-cm-width strip defect at (b1) yt = 0 cm, (c1) yt = −30 cm and 0.6-cm-width strip defect at (d1) yt = 0 cm, (e1) yt = −30 cm. (a2), (b2), (c2), (d2), and (e2) are the far-field distributions of (a1), (b1), (c1), (d1), and (e1) in front of the MR, respectively.
For the embedded defects, specular reflection imaging with reduced intensity at the defect is inside the light spot, and diffuse reflection imaging with increased intensity at the defect is outside the light spot shown in Fig. 5. When the defect width increases to 3 cm, regardless of the imaging features, the intensity changes at the defect appear as a saddle shape in the direction, which is consistent with the change trend of the intensity peak caused by edge scattering in dark-field imaging[16]. The intensity value variation, which is affected by the scattering effect at the edge of the defect, is not only related to the incident angle, but also related to the defect size.
Figure 7 compares the 0.22 THz imaging results and the simulations of the horizontal strip defects. The similarity between the simulation and imaging results is very high in the whole FoV. We simulated the resolvable distance of the two 0.5-cm-width defects. Figure 8 shows the GO results of the resolvable distance. In most areas, the discriminability of two defects decreases with the decrease of the distance between defects. Especially in the case of and , the measurement results are very similar to Ref. [14]. However, at , the discriminability of two defects is the lowest. Previous work on the discriminability measurements of defects ignored the angular variation in diffuse reflection imaging. This simulation method can help us analyze imaging differences and obtain more THz image information. Because is very close to 1, the multiple reflections and refractions of THz waves are not considered, and only one transmission is considered in the GO method. The difference between the two simulation methods is small, which shows the feasibility of GO approximate calculation. There are 745 simulated sampling points with an interval of about 0.15 cm. Using FEM requires grid generation, which takes about 6 s for each sampling point, while using GO method requires only one ray tracing, which takes less than 10 min for all sampling points.
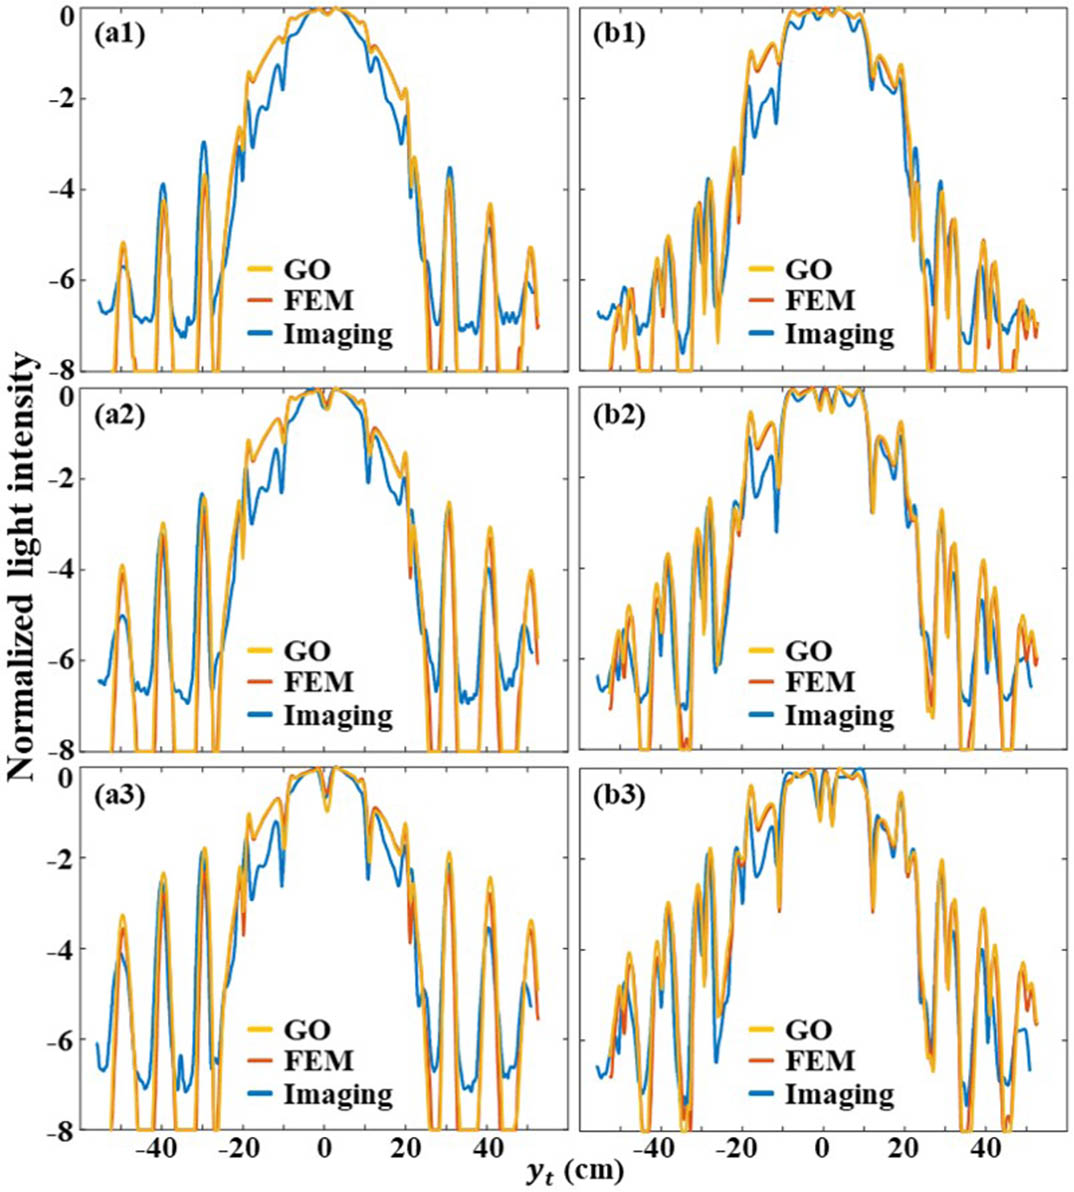
Fig. 7. Comparison of the 0.22 THz imaging results and the simulations of the defects with depths of (a1), (b1) 0.5 cm, (a2), (b2) 1 cm, and (a3), (b3) 1.5 cm. (a1)–(a3) and (b1)–(b3) are the defects with widths of 0.6 cm and 3 cm, respectively.
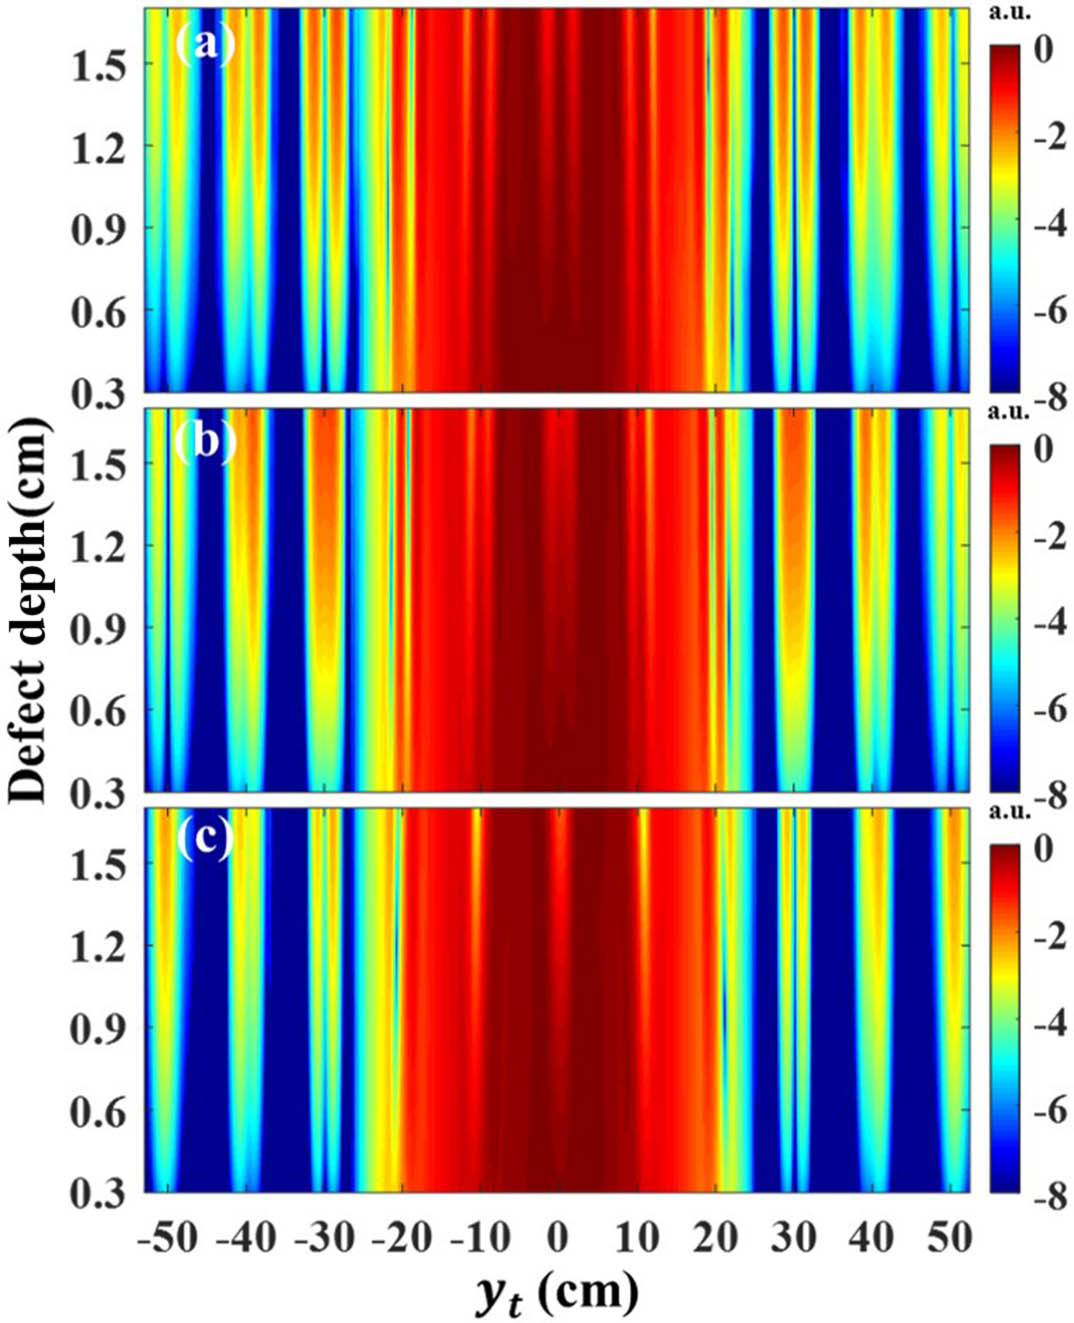
Fig. 8. GO simulation results of minimum resolvable distance for two 0.5-cm-width defects. The spacing between the two defects was (a) 3 cm, (b) 2 cm, and (c) 1 cm, respectively.
4. Conclusion
In this paper, the diffuse and specular reflection imaging behavior of defective foam is measured and simulated at 0.22 THz. Due to the electrically large size of the reflectors, the theory of angular spectrum diffraction and ray tracing is used to calculate the incident and receiving electric field distribution of the system with a large FoV and long standoff distance. FEM and GO models of defective foams are established to calculate the near-field scattering light distribution. The proposed GO modeling method can accurately and quickly calculate the intensity information of defective foams. More complex properties of the measured object can be simulated by multiple geometric optical tracing. The simulation model theoretically reveals the imaging process, helping to explain the THz images. Further work will build more THz image data sets of measured objects.
[12] C. P. Chiou, R. B. Tbompson, J. L. Blackshire. Modeling of terahertz ray signals for NDE applications. AIP Conf. Proc., 2008, 975: 414.
[13] V. R. Melapudi, N. V. Nair, L. Udpa, S. S. Udpa, W. P. Winfree. Imaging and modeling techniques for terahertz inspection of NASA-SOFI. AIP Conf. Proc., 2007, 894: 401.
Hui Wang, Deliang Zhou, Yan Wang, Runfeng Su, Shaohe Li, Xuecou Tu, Xiaoqing Jia, Lin Kang, Biaobing Jin, Huabing Wang, Jian Chen, Peiheng Wu. Simulation for embedded-defects foam terahertz images of active bifocal terahertz imaging system at 0.22 THz based on geometric optics[J]. Chinese Optics Letters, 2023, 21(6): 061102.

