基于稀疏数据的液‑液相分离凝聚物形态快速分析方法
Intracellular liquid-liquid phase separation is related to various biological processes in cells. Analysis of the phenomenon and the phase separation mechanism can provide a reference and strategy for regulating cell physiological processes and drug development. Phase imaging technology is used in the study of liquid-liquid phase separation because it is highly advantageous for contactless and label-free quantitative observation of colorless transparent objects. However, in this technique, the sample thickness is coupled to its refractive index, and the morphological distribution must be inverted using the corresponding algorithm. The efficiency of the analysis depends largely on the amount of data acquired, time required for calculation and processing, and accuracy. To meet the demand for the real-time acquisition of morphological information of phase-separated condensates in the field of life science research, this study proposes a fast inversion method for three-dimensional morphology using only two phase images and a design of an interferometric phase imaging system with dual optical information acquisition using a single image sensor.
A method for the morphological analysis of liquid-liquid phase separation aggregates is proposed in this paper. The first step in this method is to use a single sensor based on interferometric phase imaging technology to collect two sample phase distribution maps incident in the nonorthogonal directions. The second step is to extract the edges of these phase images. The boundary point coordinates of the agglomerate substructure on the projection surface were detected point-by-point according to the pixel points of each phase image to obtain the structural contours of the sample projection on the two imaging surfaces. The next step is to select and arrange the obtained control points using approximation fitting based on the geometric characteristics of the phase volume. A direct linear transformation was used to select the control points to solve the quantitative relationship between the spatial and projection plane coordinates. Based on this correlation, the corresponding three-dimensional coordinates in the same spatial coordinate system were calculated from the two-dimensional coordinates of the undetermined points. Thus, the three-dimensional shape reconstruction of the phase volume was realized.
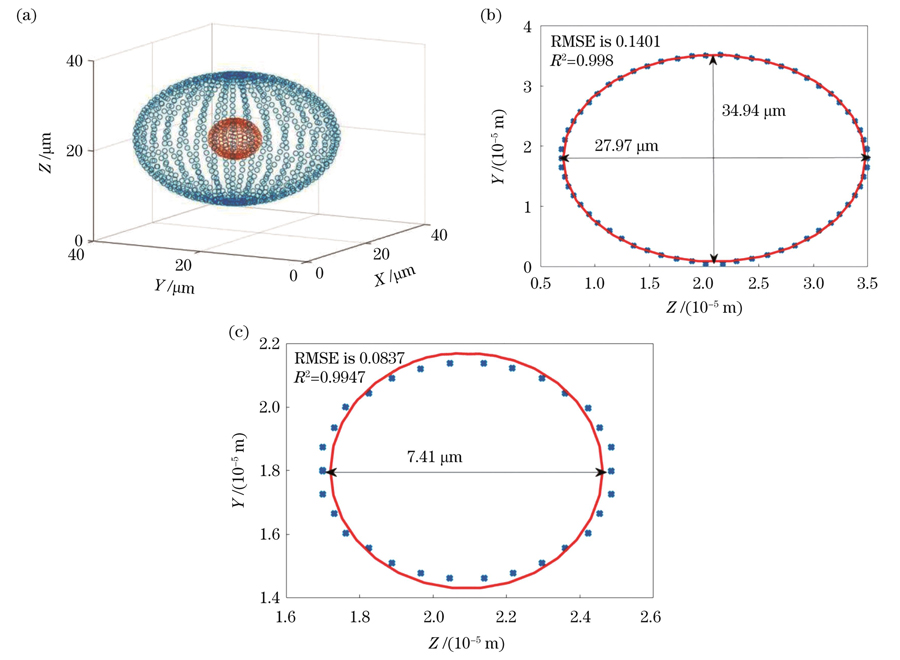
To elaborate the principles and steps of the algorithm, this study uses the nucleus model as an example to extract the surface morphology of the liquid-liquid phase separation condensate, such as the internal nucleolus, and establishes a two-medium concentric ellipsoid model (Fig. 2) to simulate the internal structure of the nucleus and design polystyrene microspheres[Fig. 7 (c)]. This reconstruction algorithm yielded better reconstruction results for the two-medium concentric ellipsoid model and polystyrene microspheres [Figs. 6 and 7 (d)]. The reconstruction of the sphere and ellipsoid demonstrated the effectiveness of the algorithm for different feature surfaces and the time efficiency of inversion calculation (Table 2). The processing speed satisfied the requirements of real-time analysis. The rapid reconstruction of the polystyrene microspheres also shows the feasibility of first extracting the relationship between the corresponding projection pixels based on two non-orthogonal phase maps and then quickly inverting the three-dimensional shape of the sample.
A method for the morphological analysis of liquid-liquid phase separation condensates was proposed. A single sensor was used to obtain the phase distribution diagrams of the two samples based on interferometric phase imaging technology. The boundary point coordinates of the condensate substructure on the projection plane were detected point-by-point based on the pixel points of the phase diagram, and the structural contours of the sample projection on the two imaging planes were obtained. Based on the geometric characteristics of the phase volume, the control points were selected and arranged using approximation fitting, and a mapping relationship between the three-dimensional space coordinates and the corresponding plane projection coordinates was established. Subsequently, the three-dimensional space coordinates of the phase volume were obtained through plane projection coordinate inversion, and a three-dimensional shape reconstruction of the phase volume was realized. The proposed morphological analysis method only needs to collect two phase diagrams, which requires a calculation time of approximately 0.05 s, which can provide a reference for the real-time detection of transparent objects such as liquid-liquid phase separation. It should be noted that this algorithm is simple and rapid. For the liquid-liquid phase separation of such spherical or spheroid phase bodies, the three-dimensional shape can be efficiently inverted in real time, but the reconstruction of irregular phase bodies still requires improvement in terms of calculation accuracy. The selection of control points to establish two-dimensional-three-dimensional mapping is a key factor. In the future, machine-learning algorithms can be considered to determine their coordinates and numbers. To address the difficulty in selecting control points under experimental conditions, this study proposes an operation scheme for the fitting approximation. The configuration of the appropriate number and location of control points for different feature samples under experimental conditions, according to different detection requirements, is a problem that we are currently exploring.
1 引言
生物细胞内包含多种细胞器,不同的细胞器将细胞分成不同的隔室,以确保以时空受控的方式发生各种各样的细胞活动[1-2]。有些隔室需要通过膜与外界隔开,有些则是无膜的,被称为无膜细胞器[3],如能够形成核糖体的核仁[4]等。理解这些无膜隔室之间如何共存以及其与细胞质如何共存是非常重要的生物物理问题[5-6]。最近的实验研究表明无膜细胞器具有可融合、流动与形变的液态特征,无膜隔室通过多价相互作用驱使的“液-液相分离”(LLPS)进行组装[7-11]。液体表面张力决定了液-液相分离产生的凝聚物呈球形结构且具有固定的尺寸,但目前尚不清楚这些尺寸是如何保持的[12-14]。基于无膜液滴的特性,显微成像技术、光调控技术等常被用来探究其结构以及融合、裂变和阻断等物理性质[15-16]。相位成像技术因能无损、免标记地获取透明样本的内部结构信息,在生命科学、材料学等领域得到了越来越多的关注与应用[17-19]。Zeng等[20]采用微分干涉显微技术在体外观察了SynGAP CC-PBM/PSD-95 PSG混合物是如何形成液滴的。该类技术提供的相位信息是透射介质厚度与折射率沿光入射方向的累积,包含了样本的结构信息。正是由于累积的叠加,各介质在入射方向的厚度无法从该方向的相位分布中获得,至少需要两个方向的相位图进行计算反演才能得样本亚结构形貌,因而多种解耦反演算法及其相应的成像方法被提出,以探究样本的物理结构等[21]。目前的层析定量检测[22]、数字全息显微成像[23]等方法可以测量生物细胞的三维折射率分布。Tang等[24]采用数字全息显微系统,通过融合9个以上重构平面图像有效消除了散斑噪声,进而对尺寸为5~100 μm的微小型浮游生物进行了三维成像和准确识别,该方法耗时352.41 s。郑南南等[25]采用活体三维成像发现了小鼠肿瘤目标点,通过多组滤光片得到了三个方向(coronal view、sagittal view和transaxial view)的图像并对肿瘤样本进行了三维重建,该算法耗时1.25 s。以上技术虽然可以获得较高的成像精度,但操作复杂、所需数据量大、耗时长,而且对实验装置和操作的要求较高。本课题组从降低成像光路搭建难度与成本、减小采集和运算数据量出发,探究了基于双路相位信息快速获取样本亚结构界面三维形貌的方法,以期为相分离凝聚物形态的定量分析提供参考。
2 数据采集及三维形貌反演算法原理
三维形貌重建的过程是建立二维数据到三维数据映射关系的过程。从建立映射的计算反演来看,由正交方向采集二维投影数据较为常见,本课题组前期围绕正交采样开展了重建工作[21],但正交成像对光路搭建、调试的要求较为严苛:或受到数值孔径对收光角度的限制,或物光和参考光各自光臂的布置较难符合要求,而且双路采集信号在增加成本的同时也可能会引入更复杂的噪声和误差。为降低信号采集难度和成本,本团队提出了一种由两幅非正交相位图反演液-液相分离样本亚结构界面形貌的算法以及相应的干涉相位成像光路设计。
成像光路基于马赫-曾德尔干涉原理,由单个相机采集双路非正交的光干涉信息,如
表 1. 双介质同心椭球模型非正交方向控制点的坐标
Table 1. Coordinates of non-orthogonal direction control points of two-medium concentric ellipsoid model
| |||||||||||||||||||||||||||||||||||||||||||||||||||||||||||||||||||||||
表 2. 双介质同心椭球模型的重建数据
Table 2. Reconstruction data of two-medium concentric ellipsoid model
| |||||||||||||||||||||

图 1. 非正交干涉相位成像装置光路图(M:全反射镜;BS:分光棱镜;L:透镜;D:光阑;MO:物镜;POL:电动旋转偏振片;P:平行分量;S:垂直分量)
Fig. 1. Optical path diagram of non-orthogonal interference phase imaging device (M: total reflective mirror; BS: beam splitter prism; L: lens; D: diaphragm; MO: microscope objective; POL: electric rotating polarizer; P: parallel component; S: vertical component)
接下来基于两幅非正交方向获得的相位图进行样本三维形貌的反演。为方便阐述算法的原理及步骤,以细胞核模型为例提取其与内部核仁这样的液-液相分离凝聚物的表面形貌,并建立双介质相位体模型,以模拟细胞核的内部结构。为考察算法在非理想实验条件下对不同面型的反演效果,在考虑样本实际物理特征(相分离凝聚物呈球形,各介质并非理想均匀且存在噪声等)的基础上,以同心球和椭球体分别模拟核仁和胞核[如

图 2. 双介质同心椭球模型。(a)模型的三维空间示意图;(b)模型在X方向的相移分布图
Fig. 2. Two-medium concentric ellipsoid model. (a) Three-dimensional space diagram of the model ; (b) phase shift distribution of the model in X direction
根据相位产生的机理和定义,样品引起的相移量可表示为
式中:
本课题组此前关于相位图边缘检测的工作表明,梯度类算子可以有效地从相位分布数据中提取出样本亚结构在垂直于入射光方向上的投影边界,但是对于不同种类的样本,各算子的效果不尽相同。由于噪声极易影响到图像边界,因此,在进行边缘检测前就要对图像进行平滑滤波。高斯滤波[滤波函数G(y,z)如

图 3. 同心椭球模型边缘检测结果。(a)模型在YOZ平面上的Canny边缘算子检测图;(b)模型在YOZ平面上的LOG边缘算子检测图;(c)模型在YOZ平面上的投影边界;(d)模型在另一平面上的投影边界
Fig. 3. Concentric ellipsoid model edge detection results. (a) Canny edge operator detection map of the model in YOZ plane; (b) LOG edge operator detection diagram of the model in YOZ plane; (c) projection boundary of the model in YOZ plane; (d) projection boundary of the model in the other plane
该边界较原模型存在一些偏差,这可能是由于Canny算子易在图像纹理较为丰富的地方(如边缘处)出现偏移,检测出的边缘点与原始图像的位置就有了一定误差。因此,又采用对边缘位置检测准确的LOG算子对原相位图像进行处理,结果如
这两个方向的边缘反映的是同一样本在不同平面上的投影,不考虑样本动态形变时,其二维坐标之间以及各面二维坐标与对应点三维坐标之间分别有着确定的、一一对应的映射关系,若能获得部分点之间的映射便可推广到全部点的三维坐标,即反演得到样本结构形貌。为获取上述映射关系,本文采用直接线性变换(DLT),选取参考点(即控制点)解算空间坐标和投影平面坐标间的定量关系,进而基于这一关系由各投影点二维坐标反演得到其在同一空间坐标系下对应的三维坐标,如
由上述原理可知,控制点的选取对结果的准确性具有决定性影响,以分布广泛和均匀作为原则选取控制点为宜。在实验条件下,各类样本在投影面上的边界点呈不同程度的离散杂乱分布,如

图 5. 模型在YOZ平面的投影边界及局部边界放大图
Fig. 5. Projection boundary and enlarged local boundary of the model in YOZ plane
接下来确定控制点的数量。根据成像的共线性条件建立空间坐标与像素坐标之间的关系,共线条件方程式为
式中:
接着对待定点的空间坐标进行解算。首先对待定点空间坐标的近似值进行解算,以空间坐标作为未知数,因

图 6. 双介质同心椭球模型的重建结果。(a)模型重建结果的三维分布;(b)外部椭球轴向截面的边界点分布;(c)内球轴向截面的边界点分布
Fig. 6. Reconstruction results of two-medium concentric ellipsoid model. (a) Three-dimensional distribution of model reconstruction result; (b) boundary point distribution of axial section of external ellipsoid; (c) boundary point distribution of axial section of inner sphere
由
3 实验验证
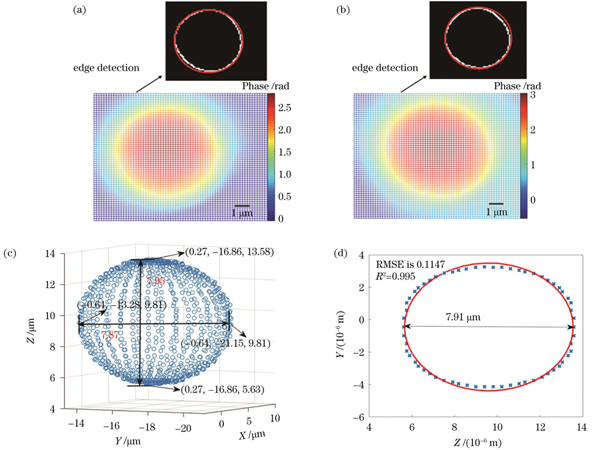
为了验证所提算法在实际应用中的可行性,本课题组基于血细胞、聚苯乙烯微球等样本进行多次实验来考察边缘检测、逼近拟合提取控制点的方案对不同相态、不同介质分界面的实施效果。结果表明,该方法主要对折射率变化敏感,对液-液和液-固分界面同样有效。出于方便对照的考虑,本文用标准聚苯乙烯微球和环境液来模拟不同介质的相分离状态。以一个直径为8 µm的聚苯乙烯微球为例,根据厂商数据,其折射率为1.588,尺寸误差在3%以内;以Cargille折射率匹配液作为环境液,其在23 ℃下的实测折射率为1.4218(采用阿贝折射仪测量)。入射光波长为632.8 nm,分别从夹角为60°的两个方向入射,获得的两幅相位图如

图 7. 聚苯乙烯微球的相位分布及反演形貌分布。(a)~(b)入射方向夹角为60°的两束入射光的相位图;(c)重建的三维形态分布;(d)轴向截面边界点分布及拟合评估
Fig. 7. Phase diagrams and inversion morphology of polystyrene micro-sphere. (a)-(b) Phase diagrams of two incidental beam with an angle of 60° in incidental direction; (c) reconstructed three-dimensional morphological distribution; (d) axial section boundary point distribution and fitting evaluation
上述界面的反演仅需0.0415 s即可完成。
4 结论
本文提出一种适用于液-液相分离凝聚物形态分析的方法。采用单个传感器基于干涉相位成像技术获得两幅样本的相位分布图,对相位图按像素点逐点检测凝聚物亚结构在投影面上的边界点坐标,由此分别获得样本投影在两个成像面上的结构轮廓。基于相位体几何特征,通过逼近拟合的方式选取和布置控制点,建立三维空间坐标与其对应的平面投影坐标之间的映射关系,进而通过平面投影坐标反演获得相位体的三维空间坐标,实现相位体的三维形态重建。该形态分析方法仅需采集两幅相位图,计算处理耗时0.05 s左右,可为液-液相分离这类无色透明物体的原态实时检测研究提供参考。同时也注意到,所提方法简便快速,对于液-液相分离球形或类球形相位体可以较好地实时反演其三维形态,但是对于不规则相位体的重建尚需提高计算精度,其中建立二维-三维映射的控制点的提取是一个关键因素,后续拟考虑引入机器学习算法来确定控制点的坐标及数量。如何在实验条件下针对不同特征的样本,根据不同的检测要求,配置合适数量和位置的控制点是本课题组正在积极探究的课题。
[1] Brangwynne C P. Phase transitions and size scaling of membrane-less organelles[J]. The Journal of Cell Biology, 2013, 203(6): 875-881.
[2] Hyman A A, Weber C A, Jülicher F. Liquid-liquid phase separation in biology[J]. Annual Review of Cell and Developmental Biology, 2014, 30: 39-58.
[3] Molliex A, Temirov J, Lee J H, et al. Phase separation by low complexity domains promotes stress granule assembly and drives pathological fibrillization[J]. Cell, 2015, 163(1): 123-133.
[4] Banani S F, Lee H O, Hyman A A, et al. Biomolecular condensates: organizers of cellular biochemistry[J]. Nature Reviews Molecular Cell Biology, 2017, 18(5): 285-298.
[5] Alberti S, Gladfelter A, Mittag T. Considerations and challenges in studying liquid-liquid phase separation and biomolecular condensates[J]. Cell, 2019, 176(3): 419-434.
[6] 吴荣波, 李丕龙. 液-液相分离与生物分子凝集体[J]. 科学通报, 2019, 64(22): 2285-2291.
Wu R B, Li P L. Liquid-liquid phase separation and biomolecular condensates[J]. Chinese Science Bulletin, 2019, 64(22): 2285-2291.
[7] Li P L, Banjade S, Cheng H C, et al. Phase transitions in the assembly of multivalent signalling proteins[J]. Nature, 2012, 483(7389): 336-340.
[8] Mehta S, Zhang J. Liquid-liquid phase separation drives cellular function and dysfunction in cancer[J]. Nature Reviews Cancer, 2022, 22(4): 239-252.
[9] Banani S F, Rice A M, Peeples W B, et al. Compositional control of phase-separated cellular bodies[J]. Cell, 2016, 166(3): 651-663.
[10] Langdon E M, Gladfelter A S. A new lens for RNA localization: liquid-liquid phase separation[J]. Annual Review of Microbiology, 2018, 72: 255-271.
[11] Schmidt H B, Görlich D. Transport selectivity of nuclear pores, phase separation, and membraneless organelles[J]. Trends in Biochemical Sciences, 2016, 41(1): 46-61.
[12] Wegmann S, Eftekharzadeh B, Tepper K, et al. Tau protein liquid-liquid phase separation can initiate tau aggregation[J]. The EMBO Journal, 2018, 37(7): e98049.
[13] Boulay G, Sandoval G J, Riggi N, et al. Cancer-specific retargeting of BAF complexes by a prion-like domain[J]. Cell, 2017, 171(1): 163-178.e19.
[14] Luby-Phelps K. The physical chemistry of cytoplasm and its influence on cell function: an update[J]. Molecular Biology of the Cell, 2013, 24(17): 2593-2596.
[15] 关苑君, 马显才. 光学显微成像技术在液-液相分离研究中的应用[J]. 中山大学学报(医学科学版), 2022, 43(3): 504-510.
Guan Y J, Ma X C. Application of optical microscopic imaging technology in liquid-liquid separation research[J]. Journal of Sun Yat-Sen University (Medical Sciences), 2022, 43(3): 504-510.
[16] Setru S U, Gouveia B, Alfaro-Aco R, et al. A hydrodynamic instability drives protein droplet formation on microtubules to nucleate branches[J]. Nature Physics, 2021, 17(4): 493-498.
[19] 杨泽文, 张璐, 吕宁, 等. 生物折射率三维无标记定量成像研究进展[J]. 中国激光, 2022, 49(5): 0507201.
[20] Zeng M L, Shang Y, Araki Y, et al. Phase transition in postsynaptic densities underlies formation of synaptic complexes and synaptic plasticity[J]. Cell, 2016, 166(5): 1163-1175.
[21] 季颖, 黄锦槟, 李响, 等. 基于正交采样的相位体三维形态快速重建算法[J]. 光学学报, 2021, 41(23): 2312006.
[22] 李婷婷, 冯大伟, 李琦, 等. 基于显微镜数字图像的荧光免疫层析定量检测方法[J]. 中国激光, 2020, 47(11): 1107001.
[23] He W L, Dou J T, Yang Z M, et al. Sequential shift absolute phase aberration calibration in digital holographic phase imaging based on Chebyshev polynomials fitting[J]. IEEE Photonics Journal, 2019, 12(1): 6900111.
[24] Tang M, Liu C, Wang X P. Autofocusing and image fusion for multi-focus plankton imaging by digital holographic microscopy[J]. Applied Optics, 2020, 59(2): 333-345.
[25] 郑南南, 黄钢. 小动物活体光学三维成像系统及其对乳腺癌的定量分析[J]. 激光生物学报, 2022, 31(3): 215-223.
[26] 龚凌冉, 贾希宇, 徐媛媛, 等. 基于正交双波长测量的有核细胞三维形态重建[J]. 中国激光, 2022, 49(20): 2007206.
[27] Majeed H, Sridharan S, Mir M, et al. Quantitative phase imaging for medical diagnosis[J]. Journal of Biophotonics, 2017, 10(2): 177-205.
Article Outline
贾希宇, 龚凌冉, 徐媛媛, 季颖. 基于稀疏数据的液‑液相分离凝聚物形态快速分析方法[J]. 中国激光, 2023, 50(9): 0907401. Xiyu Jia, Lingran Gong, Yuanyuan Xu, Ying Ji. Rapid Analysis Method for Liquid‐Liquid Phase Separation Condensate Morphology Based on Sparse Data[J]. Chinese Journal of Lasers, 2023, 50(9): 0907401.


