Single-shot mid-infrared incoherent holography using Lucy-Richardson-Rosen algorithm
1 Introduction
In the past, holography, and three-dimensional imaging (3D) techniques were mostly powered by coherent light sources since spatially incoherent illumination demanded cumbersome optical architectures such as rotational shearing interferometers, triangle interferometers and conoscopic holography1. The need for such optical architectures is derived from the requirement that two-beam interference (TBI) was needed to compress 3D information in a two-dimensional (2D) hologram. The birth of active optical devices such as spatial light modulators and computer processing methods, eased the constraints of optical architectures of incoherent holography with TBI. One milestone in this research direction was the development of Fresnel incoherent correlation holography (FINCH), which is one of the widely used incoherent holography architectures today2-4. In 1968, deconvolution based 2D coded aperture imaging (CAI) using randomly arranged pinholes was demonstrated by Dicke and Ables to overcome the low-intensity problem when using a single pinhole for X-ray and gamma-ray imaging5, 6. However, the study was not explored beyond 2D imaging. In 2008, a 3D imaging technique based on CAI was demonstrated with wavelength as the third dimension7. Later, the CAI method was extended to 3D imaging and four-dimensional (4D) imaging with depth as the third dimension8-10, and depth and wavelength as the third and fourth dimensions, respectively11, 12. Therefore, CAI offers multidimensional imaging capabilities without TBI and with a minimum number of optical components, which makes them more attractive than FINCH-based techniques.
This research project began when we attempted the CAI method employing the benchtop Fourier transform infrared microspectroscopy (FTIRm) system at the Australian Synchrotron operating with a conventional GlobarTM IR source. This instrument, which comprises a Bruker Hyperion 3000 IR microscope and V70 FTIR spectrometer, is used in support of many applications at the Infrared Microspectroscopy (IRM) beamline, whereby the identification and analysis of functional groups within a sample enable a better understanding of diverse materials from diseased tissue to composite materials and foods to paintings13-15. We applied the CAI method to the benchtop FTIR instrument at the IRM beamline by manufacturing scattering lenses on calcium fluoride (CaF2) substrates. A matching 15× (NA = 0.4) Cassegrain objective lens (COL) and a 64×64 focal plane array (FPA) imaging detector (pixel size = 40 μm) were used. During this study, we noticed that COL exhibited interesting focal characteristics with sharp autocorrelation functions and low cross-correlation with respect to other planes (see Supplementary information Section 1, Section 2).
Let us ask this fundamental question – why is scattering based coded apertures preferred for 3D imaging? The reason is that the average speckle size formed by scattering is approximately the diffraction limited spot size16. Consequently, the autocorrelation function is sharp and about twice that of the size of the focal spot that can be obtained with a lens of the same NA1. Secondly, the speckle patterns change with depth resulting in the capability to discriminate different planes along depth by cross-correlation. Therefore, for 3D imaging, a sharp autocorrelation and low cross-correlation along depth (SALCAD) is needed. The fields generated using scatterers can be classified as random SALCAD fields and the one from COL as a deterministic SALCAD field. Deterministic SALCAD fields require a lower photon budget than the random counterparts and the point spread functions (PSFs) can be calculated, unlike random SALCAD fields where PSFs are recorded9. So, this imaging concept can be considered as correlation holography when the SALCAD condition is satisfied and the object is illuminated by a spatially incoherent source. Recently, a modified approach was employed where sparse randomly arranged focal spots were generated instead of scattering to improve the signal to noise ratio17. However, this method is suitable only for imaging a single plane, and to image multiple planes, many such phase masks are needed to be spatially multiplexed. Fresnel zone aperture based 2D imaging systems have been reported in the past18-20.
2 Results and discussion
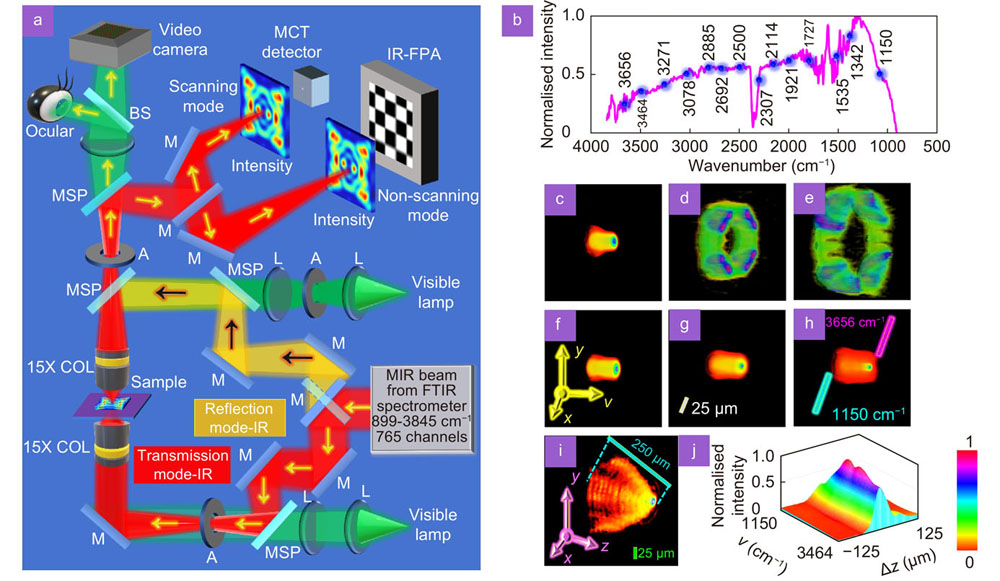
The FTIRm consists of collinear dual beams generated from two sources: (i) a standard white light source for bright-field visible light observation of the sample plane and (ii) a broadband GlobarTM IR source that allows the acquisition of mid-IR (MIR) spectral images in the range ~ 899 cm–1–3845 cm–1 as shown in

Fig. 1. Simplified schematic of the FTIR microspectroscopic system and the measured spatial and spectral characteristics. (a ) Abbreviations: COL – Cassegrain objective lens, IR – Infrared, BS – beam splitter, M – mirror, L – lens, FTIR – Fourier transform infrared spectrometer, FPA – focal plane array, MSP – Motorized sliding plate, MCT - mercury-cadmium-telluride, A – aperture, MIR – mid infrared, PSF – point spread function. The MIR from the FTIR spectrometer is sent into the IR/VISIBLE microscope. The microscope is aligned collinearly for both MIR and reference visible light. There are two modes of operation: (reflection and transmission) and two modes of data recording (mapping using single element MCT detector and imaging using multi-element FPA detector). (b ) Spectral profile of the GlobarTM source with 14 spectral channels marked in blue are selected for the study. (c –e ) 4D plot of the PSFs recorded for an axial aberration Δz = 0, 125 μm and 250 μm, respectively. Spectral cube data PSF(x, y, ν) was formed from the 14 spectral channels each averaged over 100 spectral channels –50 to +50 channels. The non-changing pattern along ν indicates spectral aberrations suppressed by the COL. (f –h ). Autocorrelation cube data of (c–e), respectively. The thin cylindrical structures obtained for Δz = 125 μm and 250 μm indicates the possibility of imaging in deconvolution mode with a similar resolving power as Δz = 0 μm. (i ) Depth cube data PSF(x, y, Δz) from 0 to 250 μm. Unlike a regular lens where the intensity distribution is filled, the COL generates hollow intensity distribution with four distinct lobes causing a sharp autocorrelation function. (j ) The spectral and spatial cube data were combined to form 8415 spatio-spectral images corresponding to the 14 spectral channels and aberrations 0 to 250 μm in steps of 25 μm and was cross-correlated with the image corresponding to the central spatio-spectral point (2307 cm–1, 125 μm) and cross-correlation value at the origin (x=0, y=0) is plotted. The FWHM along z was ~50 μm indicating that the intensity of a plane 50 μm apart has a loss of about 50% of intensity which is ideal for 3D MIR imaging applications.
The IR light produced by the GlobarTM source is spatially incoherent and so the light emitted from one object point does not interfere with the light emitted from another point, instead their intensities add up. As a result, this FTIRm system is a shift-invariant imager, linear in intensity, i.e., PSF and the intensity distribution obtained for an object
The
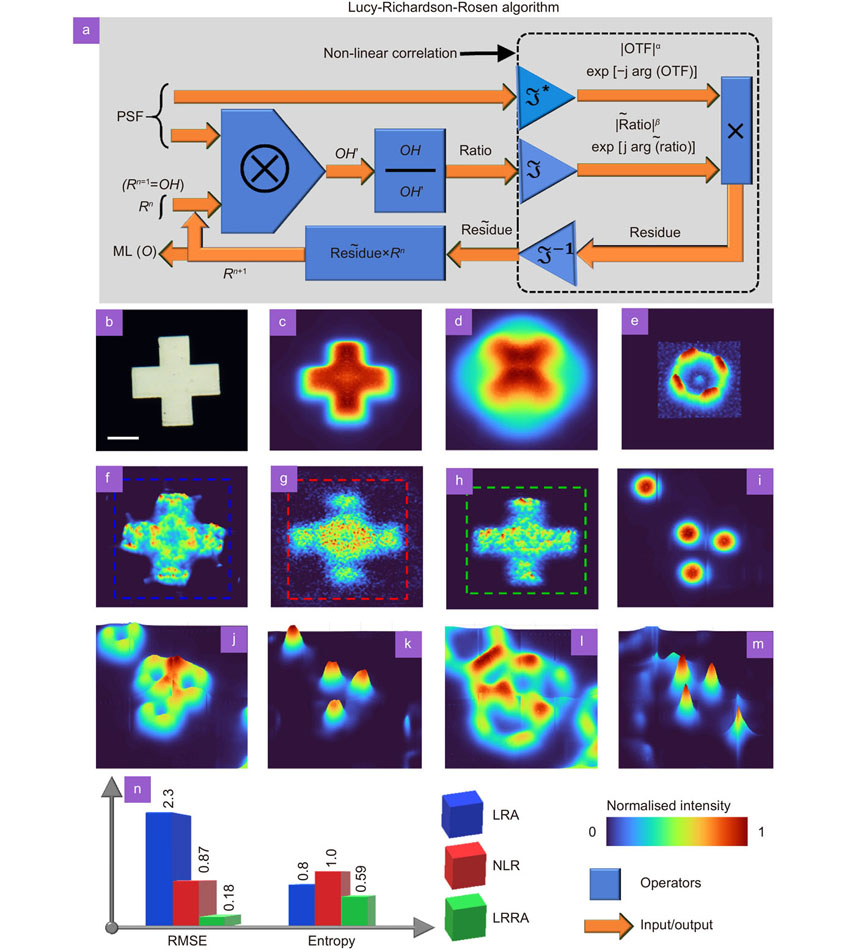
The next important aspect of imaging is the reconstruction technique. It is well-established from previous studies that the PSF is not the optimal reconstruction function by cross-correlation21, and a non-linear reconstruction (NLR) method was introduced by Rosen in which the magnitudes of the spatial frequency spectrum of the

Fig. 2. Reconstruction results using Lucy-Richardson algorithm, Non-linear reconstruction and Lucy-Richardson-Rosen algorithm. (a ) Lucy-Richardson-Rosen algorithm, O – object, OH – object hologram, PSF – point spread function, OTF – optical transfer function, × - element by element product,
b ) Direct imaging of the cross object using a visible light channel of the microscope. Average image of all the 765 spectral channels of the cross object at (c ) Δz = 0. (d ) Δz = 100 μm, (e ) The PSF recorded for Δz = 100 μm. Reconstruction results of the cross object using (f ) LRA (150 iterations), (g ) NLR (α = 0, β = 0.6) and (h ) LRRA (20 iterations, α = 0.2, β = 1). (i ) Direct MIR imaging result of four pinholes Δz = 0. (j ) Intensity pattern recorded for four pinholes for Δz = 150 μm and (k ). its reconstruction result. (l ) Intensity pattern recorded for four pinholes for Δz = 200 μm and (m ). its reconstruction result. (n ) Bar plots of RMSE and entropy for LRA, NLR and LRRA. The performance of LRRA is found to be significantly higher than LRA and NLR with RMSE ratio of 13 and 5 times, respectively. The LRRA has a rapid convergence with 7 times faster than LRA for the cross object. It must be noted that the above values are for only the cross object. The performances vary with the complexity of the object with the minimum difference for simple objects and significant difference for complicated objects. The scale bar is 50 μm.
The spatio-spectral aberrations of the system have been studied25. A cross shaped object (150 μm × 150 μm) and four random pinholes (50 μm in diameter) ablated on chromium-gold layer coated calcium fluoride substrate were used as test objects. The visible light image and IR image when Δz = 0 are shown in
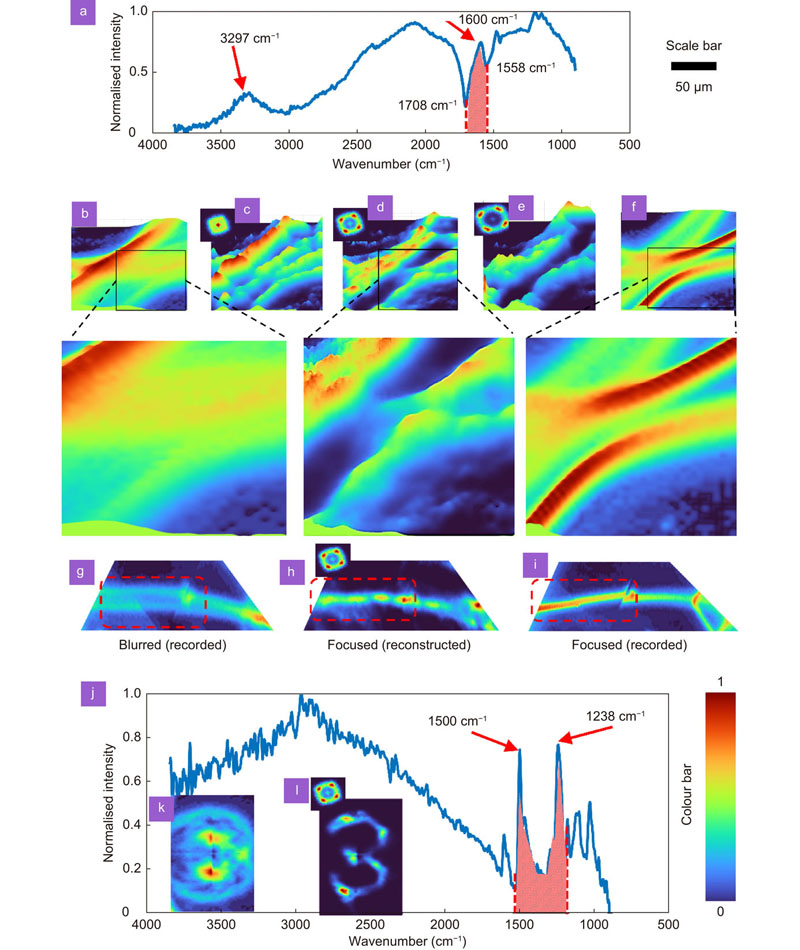
The experiment was then repeated on a bundle of silk fibers. The absorption spectrum of silk is shown in

Fig. 3. Reconstruction results of thick and strong IR absorbing materials. (a ) Normalised absorbance of the silk fiber sample. The characteristic absorption peaks are noted at 3297 cm–1 and 1600 cm–1. The spectral matrices for Δz = 0 from 1708 cm–1 to 1558 cm–1 were averaged to obtain Fig. 3(b). (b ) Direct imaging of a bundle of silk threads in 3D space, showing focused and out-of-focus objects. Reconstruction result using LRRA (α = 0.5, β = 1, iterations = 18) using PSFs recorded at (c ) Δz = 25 μm, (d ) Δz = 50 μm and (e ), Δz =75 μm. (f ) Direct imaging of a bundle of silk fibers for Δz ≈ 50 μm. The magnified regions of the direct imaging and reconstruction results indicate that the LRRA could obtain a good reconstruction even for thick objects and strong IR absorbing objects. (g ) Direct imaging of a single silk fiber in 3D space. (h ) Reconstruction results using PSF of Δz = 50 μm. (i ) Direct imaging of the single silk fiber for Δz ≈ 50 μm. (j ) Normalised absorbance of the polymer material of USAF target with characteristic peaks at 1500 cm–1 and 1238 cm–1. (k ) Direct imaging of the USAF object ‘3’ located at Δz ≈ 50 μm. (l ) Reconstruction result of the USAF object ‘3’ using LRRA (α = 0.6, β = 1, iterations = 14). The scale bar is 50 μm. The lateral resolution of the imaging system is ~15 μm.
3 Conclusion
In conclusion, we demonstrated 3D imaging without TBI using deterministic fields. Unlike scattering based SALCAD fields, where the PSFs have to be recorded at all axial planes, with deterministic SALCAD fields it is possible to calculate the PSFs from the complex amplitude of the optical modulator. Consequently, the reconstruction in this case mimics that of conventional incoherent holography. Furthermore, we have invented a new reconstruction method by introducing non-linearity into the LRA using the NLR approach, which performs significantly better than both LRA and NLR. The method and reconstruction have been demonstrated in the FTIRm chemical imaging system by introducing necessary data structure conversions (see Supplementary information Section 5). We believe that the approach can be easily adapted to power sensitive areas such as astronomical, fluorescence and biomedical imaging. Above all, we also believe that this research work will benefit the users of synchrotron based FTIRm technique to be able to investigate multiple samples during the limited beamtime in the future which was the motivation that led to this research work. The proposed method opens a new direction where deterministic fields and structured light can be engineered for rapid 3D imaging with a low photon budget, high lateral, and axial resolutions.
The evolution of incoherent holography over the years from the complicated architectures such as rotational shearing interferometer26, conoscopic holography27, and FINCH2, 3, to this version of holography with deterministic SALCAD fields using Lucy-Richardson-Rosen algorithm is interesting. We believe that the proposed method will compete with the existing coherent holography methods such as MIR digital holography and holographic interferometry using quantum cascade laser28, single shot Raman holography29, and label-free second harmonic phase imagers30.
This research was undertaken on the IRM beamline at the Australian Synchrotron (Victoria, Australia), part of ANSTO (Proposal ID. 15775, Reference No. AS1/IRM/15775 and Proposal ID. M17333, Reference No. AS2/IRM/17333). This work was performed in part at the Swinburne's Nanofabrication Facility (Nanolab). Funded by European Union’s Horizon 2020 research and innovation programme under grant agreement No. 857627 (CIPHR).
The authors declare no competing financial interests.
Supplementary information for this paper is available at
[6] Dicke RHScatter-hole cameras for X-rays and gamma raysAstrophys J1968153L101L10610.1086/180230
[16] Dainty JC. Stellar speckle interferometry. In Dainty JC. Laser Speckle and Related Phenomena 255–280 (Springer, 1975)
[18] Lohman AW. OpticalInformationProcessing (Physikalisches Institut der Universitat, 8520 Erlangen, EDR, 1978).
[21] Horner J L, Gianino PDPhase-only matched filteringAppl Opt19842381281610.1364/AO.23.000812
[26] Murty MVRK, Hagerott ECRotational-shearing interferometryAppl Opt1966561561910.1364/AO.5.000615
Article Outline
Vijayakumar Anand, Molong Han, Jovan Maksimovic, Soon Hock Ng, Tomas Katkus, Annaleise Klein, Keith Bambery, Mark J. Tobin, Jitraporn Vongsvivut, Saulius Juodkazis. Single-shot mid-infrared incoherent holography using Lucy-Richardson-Rosen algorithm[J]. Opto-Electronic Science, 2022, 1(3): 210006.


