光学学报, 2019, 39 (10): 1030004, 网络出版: 2019-10-09
红提糖度和硬度的高光谱成像无损检测  下载: 1012次
Nondestructive Detection of Sugar Content and Firmness of Red Globe Grape by Hyperspectral Imaging
图 & 表
图 1. 三种放置模式下红提果粒的高光谱图像。(a)横放;(b)果柄侧朝下;(c)果柄侧朝上
Fig. 1. Hyperspectral images in three placement orientations. (a) Horizontal; (b) fruit stalk-side down; (c) fruit stalk-side up
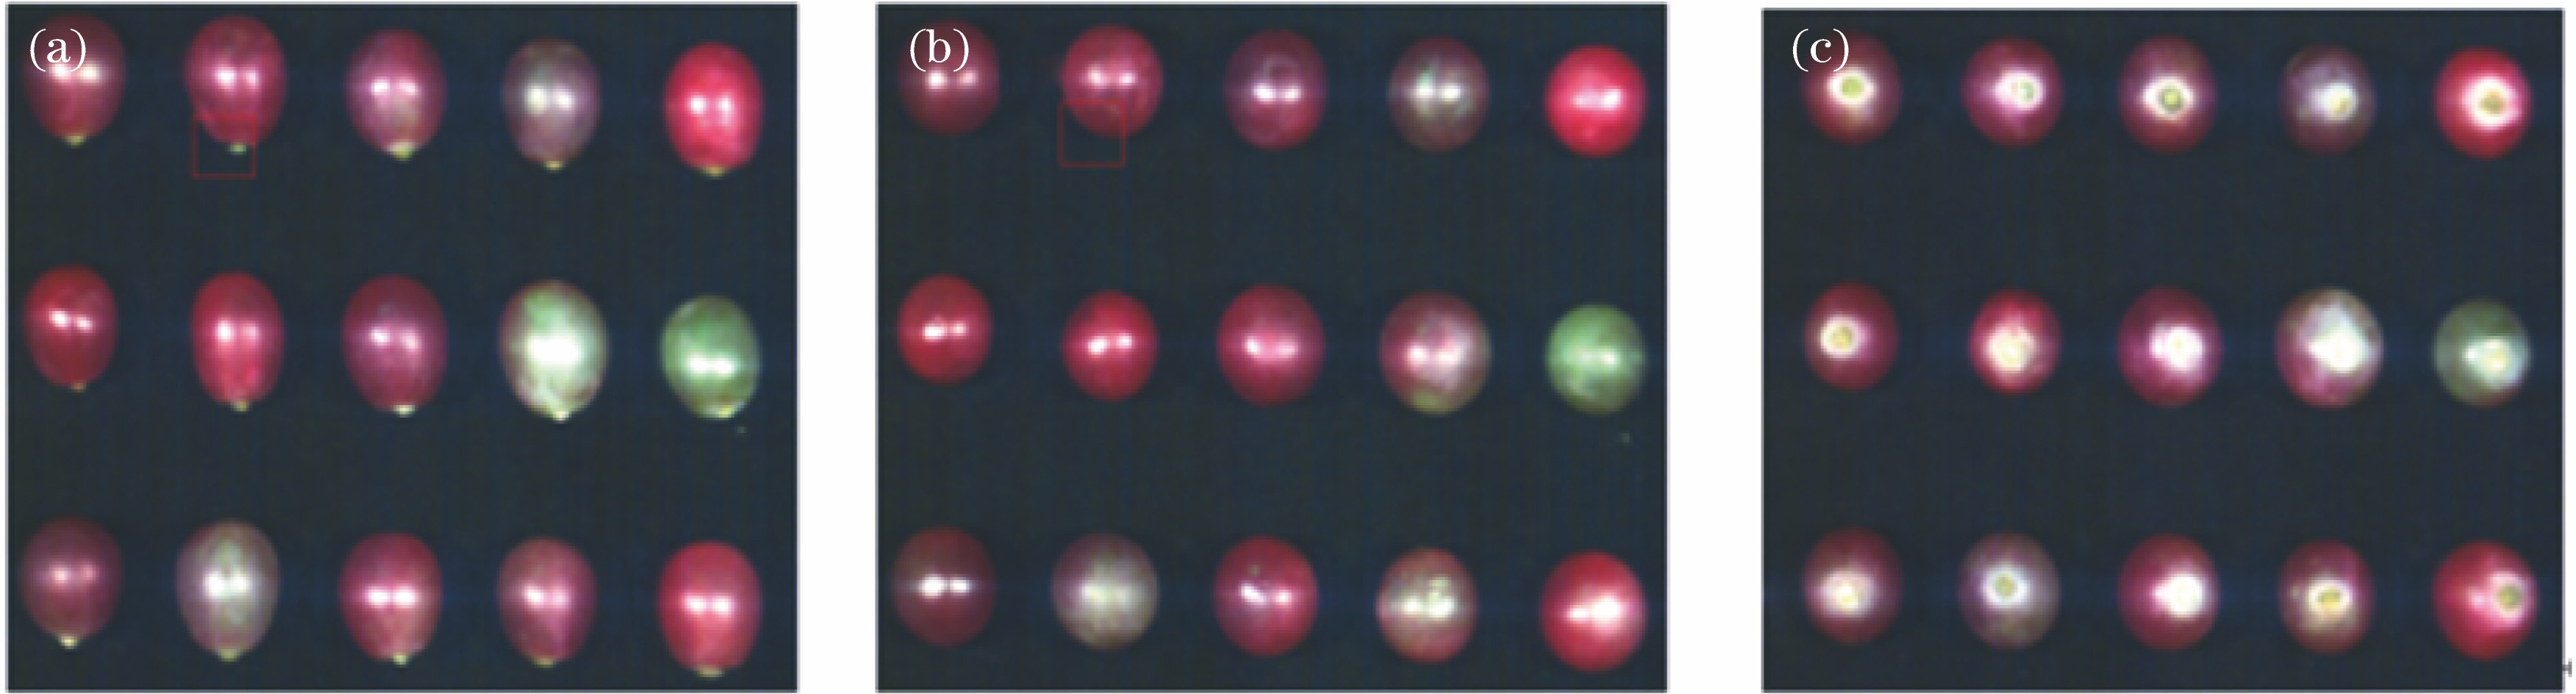
图 2. 高光谱图像中背景与红提区域的反射率
Fig. 2. Reflectivity of background and red globe grape area in hyperspectral images

图 3. 红提果粒的高光谱图像处理。(a) 726.6 nm处高光谱的图像;(b)掩模板图像;(c)掩模后红提区域的图像
Fig. 3. Hyperspectral image processing of red globe grapes. (a) Hyperspectral image at 726.6 nm; (b) mask template image; (c) masked image of red globe grape area


图 5. 红提糖度的GA特征波长选取图。(a)GA筛选图;(b)RMSECV变化图
Fig. 5. GA characteristic wavelength extraction of sugar content of red globe grape. (a) GA-screened image; (b) change of RMSECV

图 6. 红提糖度的SPA特征波长选取图。(a)RMSE变化图;(b)SPA选取的变量
Fig. 6. SPA characteristic wavelength extraction of sugar content of red globe grape. (a) Change of RMSE; (b) selected variables of SPA

图 7. 红提糖度的CARS特征波长选取图。(a)采样变量数;(b) RMSECV;(c)回归系数路径
Fig. 7. CARS characteristic wavelength extraction of sugar content of red globe grape. (a) Number of sampled variables; (b) RMSECV; (c) paths of regression coefficients

图 8. 红提糖度的UVE特征波长选取图
Fig. 8. UVE characteristic wavelength extraction of sugar content of red globe grape

图 9. 基于GA-RF的红提糖度的最优模型
Fig. 9. Optimal model for sugar content of red globe grape based on GA-RF


表 1采用不同预处理方法得到的全波长PLSR预测模型
Table1. Full-band PLSR prediction model using different preprocessing methods
| ||||||||||||||||||||||||||||||||||||||||||||||||||||||||||||||||||||||||||||||||||||||||||||
表 2利用SPXY算法划分样本集的数据统计
Table2. Datastatistics of partitioning sample sets by SPXY algorithm
|
表 3不同放置位置下得到的全波长PLSR预测模型
Table3. Full-band PLSR prediction model with different placementorientations
| |||||||||||||||||||||||||||||||||||||||||||||||||||||||||||||||||||||||||
表 4基于红提特征波长建立的糖度和硬度预测模型的结果
Table4. Results of prediction model for sugar content and firmness based on characteristic wavelengths of red globe grape
| ||||||||||||||||||||||||||||||||||||||||||||||||||||||||||||||||||||||||||||||||||||||||||||||||||||||||||||||||||||||||||||||||||||||||||||||||||||||||||||||||||||||||||||||||||||||||||||||||||||||||||||||||||||||||||||||||||||||||
表 5糖度和硬度最优模型的特征波点列表
Table5. Characteristic wave points of optimal model for sugar content and firmness
|
高升, 王巧华, 付丹丹, 李庆旭. 红提糖度和硬度的高光谱成像无损检测[J]. 光学学报, 2019, 39(10): 1030004. Sheng Gao, Qiaohua Wang, Dandan Fu, Qingxu Li. Nondestructive Detection of Sugar Content and Firmness of Red Globe Grape by Hyperspectral Imaging[J]. Acta Optica Sinica, 2019, 39(10): 1030004.


 PDF全文
PDF全文

