Chinese Optics Letters, 2020, 18 (8): 082701, Published Online: Jul. 20, 2020
High-quality quantum process tomography of time-bin qubit’s transmission over a metropolitan fiber network and its application  Download: 635次
Figures & Tables
Fig. 1. Schematics of the experimental setup in the Nanjing University optical fiber network. Node A and node B are located in the Zhongying Tang Building and the Electron Microscope Building, respectively, in the Gulou Campus. Node C is located in the Fundamental Laboratory Building in the Xianlin Campus. These nodes are separated by distances of 0.2 km and 30.5 km. Fiber is installed along the yellow line. Abbreviations of components: IM, intensity modulator; IM bias, intensity modulator bias; AMP, amplifier; PM, phase modulator; PBS, polarization beam splitter; BS, beam splitter; PC, polarization controller; EPC, electrical polarization controller; DWDM, dense wavelength division multiplexer; SynLs, synchronized laser; FM, Faraday rotation mirror; PS, phase shifter; SSPD, superconducting single-photon detector; PD, power detector; APD, avalanche photodiode FPGA; field programmable gate array; VDC, variable direct current. Imagery©2020 Google. Map data from Google, Maxar Techonologies, CNES/Airbus.
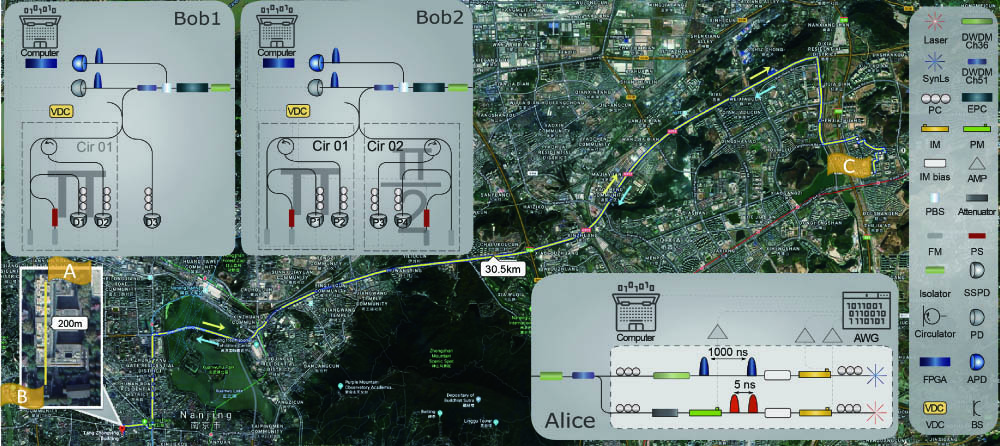
Fig. 2. Characterization of the quantum channel. (a) Density matrices of output time-bin-encoded states. (b) State fidelities of the six output states to the ideal states. (c), (d) Real and imaginary parts of the process matrices for the quantum channel with a fidelity of

Fig. 3. A 12 h continuous operation of the Nanjing quantum network with excellent system parameters: quantum bit error rate (blue, left vertical axis) and (red, right vertical axis) for COW protocol.


Table1. Characteristics of Our System under Test
|
Peiyu Zhang, Liangliang Lu, Fangchao Qu, Xinhe Jiang, Xiaodong Zheng, Yanqing Lu, Shining Zhu, Xiao-Song Ma. High-quality quantum process tomography of time-bin qubit’s transmission over a metropolitan fiber network and its application[J]. Chinese Optics Letters, 2020, 18(8): 082701.


 PDF全文
PDF全文

