激光与光电子学进展, 2020, 57 (19): 192801, 网络出版: 2020-09-27
基于土壤协变量与VIS-NIR光谱估算土壤有机质含量的研究  下载: 700次
Soil Organic Matter Content Estimation Based on Soil Covariate and VIS-NIR Spectroscopy
图 & 表
图 3. 原始光谱与预处理后土壤光谱反射率曲线。(a)原始光谱反射率;(b)经SG平滑处理后的光谱反射率;(c)经MSC处理后的光谱反射率;(d)经FD处理后的光谱反射率
Fig. 3. Original spectra and the pretreated soil spectral reflectance curves. (a) Original spectral reflectance; (b) spectral reflectance after SG smoothing; (c) spectral reflectance corrected for multiple scattering; (d) spectral reflectance treated with first order differentiation
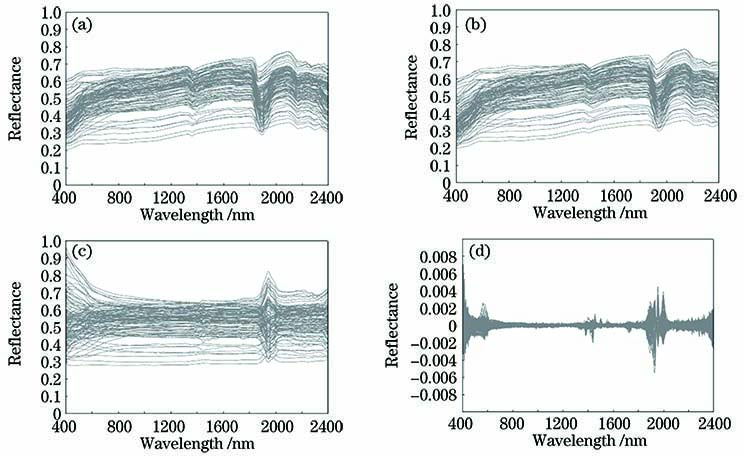
图 4. 前10个变量贡献图。(a)原始光谱反射率;(b)经SG-MSC处理后的光谱反射率;(c)经SG-MSC-FD处理后的光谱反射率
Fig. 4. Contribution diagram of the first 10 variables. (a) Original spectral reflectance; (b) spectral reflectance after SG-MSC treatments; (c) spectral reflectance after SG-MSC-FD treatments
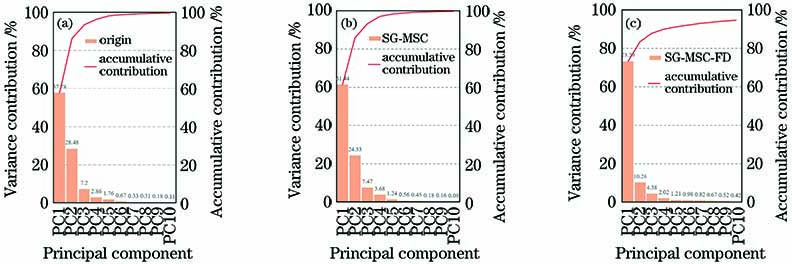
图 6. 不同土壤参数之间的相关性(n=101),图中曲线为拟合曲线
Fig. 6. Correlation between different soil parameters (n=101), in which the curves are fitting curves
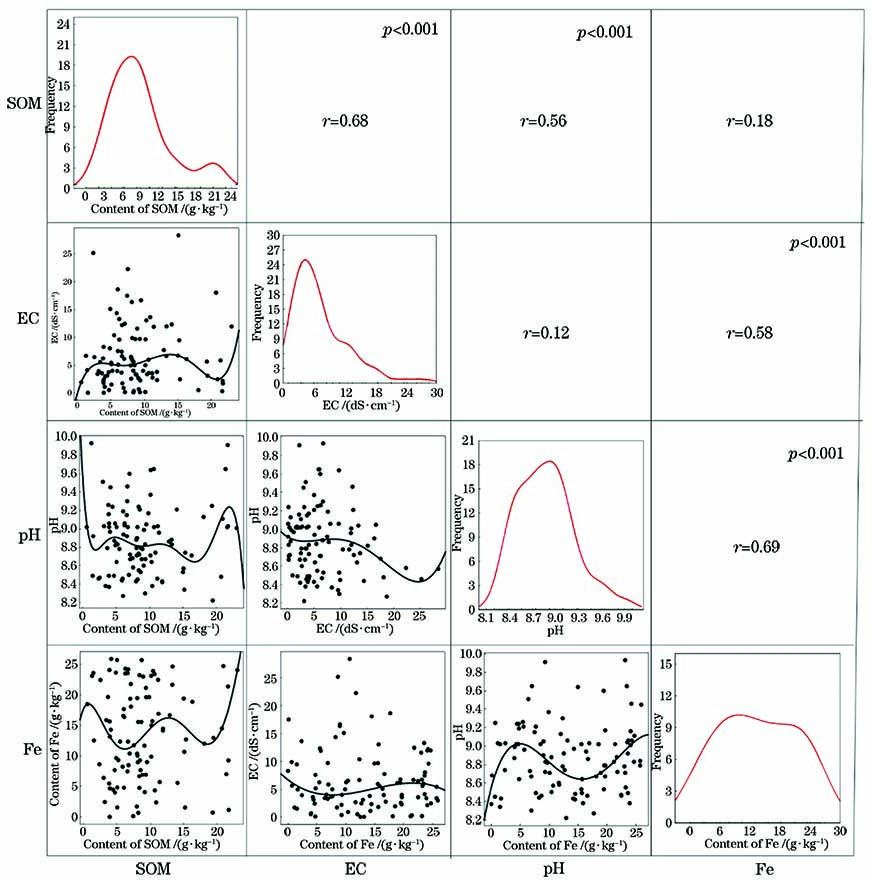
图 7. SOM,EC,Fe和pH与原始光谱反射率之间的相关性(n=101)
Fig. 7. Correlation between SOM, EC, Fe and pH and original spectral reflectance (n=101)
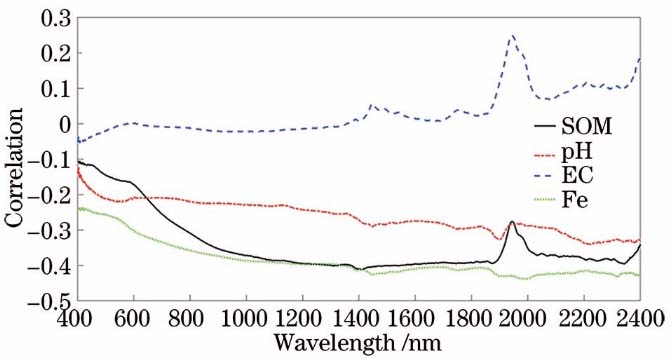
图 8. 原始光谱以及SG-MSC,SG-MSC-FD两种光谱处理下SOM与前5个主成分相关性
Fig. 8. Correlation between soil organic matter and the first five principal components for original spectrum and preprocessed spectra under two spectral treatments of SG-MSC and SG-MSC-FD
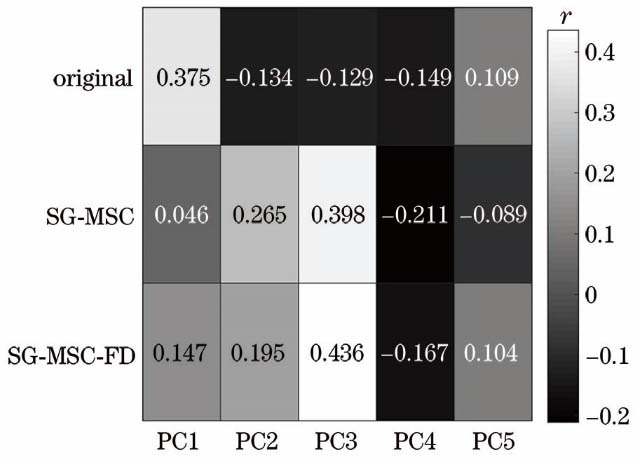
图 9. 三种策略下PLSR模型的拟合散点图。(a)模型1;(b)模型2;(c)模型3;(d)模型4;(e)模型5;(f)模型6;(g)模型7
Fig. 9. Fitting scatter diagrams of PLSR model under three strategies. (a) Model 1; (b) model 2; (c) model 3; (d) model 4; (e) model 5; (f) model 6; (g) model 7
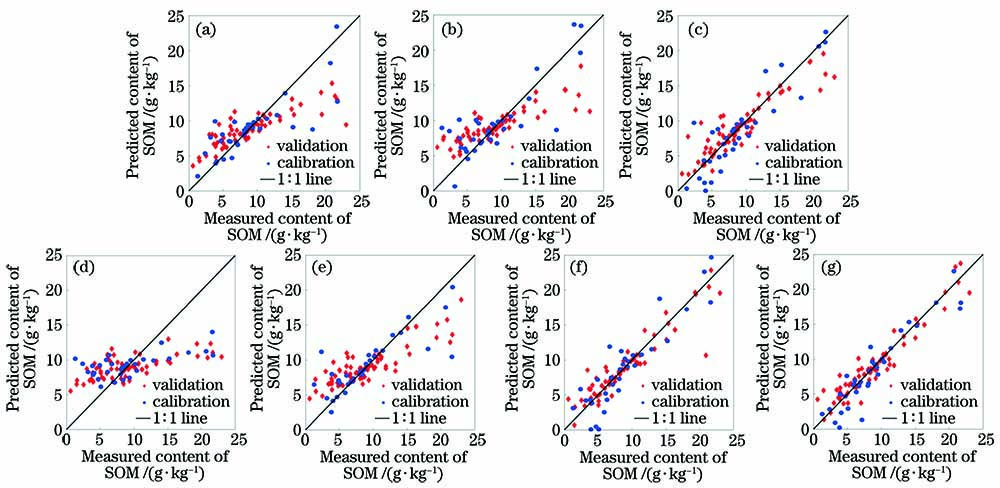
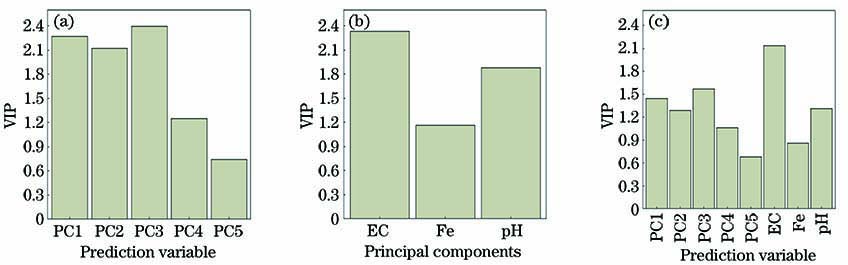
表 1土壤属性统计特征
Table1. Statistical characteristics of soil properties
|
表 2三种策略下PLSR建模结果
Table2. PLSR modeling results under three strategies
| ||||||||||||||||||||||||||||||||||||||||||||||||||||||||||||||||||
马国林, 丁建丽, 张子鹏. 基于土壤协变量与VIS-NIR光谱估算土壤有机质含量的研究[J]. 激光与光电子学进展, 2020, 57(19): 192801. Guolin Ma, Jianli Ding, Zipeng Zhang. Soil Organic Matter Content Estimation Based on Soil Covariate and VIS-NIR Spectroscopy[J]. Laser & Optoelectronics Progress, 2020, 57(19): 192801.


 PDF全文
PDF全文

