Instantaneous frequency analysis of broadband LFM signals by photonics-assisted equivalent frequency sampling  Download: 684次
1. Introduction
Linearly frequency modulated (LFM) microwave signals have wide applications in radar and electronic warfare systems[13" target="_self" style="display: inline;">–
In recent years, many photonics-assisted methods have been proposed for microwave frequency measurement. In such systems, frequency measurement is implemented by mapping the frequency to a parameter such as amplitude, time, phase sloop, and space[5
In this Letter, we propose and demonstrate a photonics-assisted equivalent frequency sampling (EFS) method to analyze the instantaneous frequency of broadband LFM signals. This method uses our recently proposed photonic scanning receiver[10,15,16], which is realized by optical-domain frequency scanning and electrical-domain intermediate frequency (IF) envelope detection. Based on this photonic scanning receiver, which can scan a wide spectral range at a very fast speed, the EFS is achieved by setting its frequency scanning rate slightly different from the repetition rate of the LFM-SUT. The main advantage of this method is that it avoids the use of high-speed ADCs. Besides, the instantaneous frequency to be measured is mapped to the time position of a short pulse; thus, the instantaneous frequency acquisition is greatly simplified compared with the time-domain STFT processing. Furthermore, the photonic scanning receiver uses a photonic frequency multiplication technique, making it possible to achieve a large frequency measurement range.
2. Principle
Figure 1(a) shows the schematic diagram of the photonic-scanning-receiver-based frequency measurement system. A laser diode (LD) generates a continuous wave (CW) light, which is modulated by a Mach–Zehnder modulator (MZM1). MZM1 is driven by an IF-band LFM signal (IF-LFM) generated by a low-speed electrical signal generator (ESG). MZM1 is biased at its maximum transmission point to suppress the odd-order modulation sidebands such that the -order modulation sidebands are generated in the optical spectrum. An erbium-doped fiber amplifier (EDFA1) is used to boost the optical power of the signal from MZM1, and an optical dual-band filter (ODBF) is followed to select the -order modulation sidebands. The obtained optical signal (at point ) can be expressed as

Fig. 1. (a) Schematic diagram of the photonic-scanning-receiver-based microwave photonic frequency measurement system and (b) principle of the EFS.
Then, the optical signal from the ODBF is modulated by another MZM (MZM2), which is driven by the LFM-SUT. Before being applied to MZM2, the LFM-SUT passes through an image-reject filter (IRF) and is amplified by a low-noise amplifier (LNA). The IRF is used to avoid the measurement ambiguity between two frequency bands that mirror each other[15]. The obtained optical signal after MZM2 (at point ) can be expressed as
After MZM2, another EDFA (EDFA2) is used to compensate for the optical power loss. Within the expected frequency measurement range of the proposed system, the -order sideband at is close to the optical carrier at , and they are selected out by an optical bandpass filter (OBPF). The obtained optical signal (at point ) is
This optical signal is sent to a photodetector (PD) to perform optical-to-electrical conversion. The generated electrical signal is
As can be seen, the obtained electrical signal contains a direct-current (dc) component and a frequency component at . Next, a narrow-band IF filter is used to select the frequency component at . A microwave envelope detector is followed to get the envelope signal of this IF signal, which can be expressed by[15]
Assume that the instantaneous frequency of the LFM-SUT is , where , , and are the temporal period, the initial frequency, and the chirp rate, respectively. To implement the EFS, the temporal period of the IF-LFM signal () is slightly different from , and the frequency sweeping rate () is different from . With this configuration, only a specific instantaneous frequency is acquired in a single period of the LFM-SUT. The principle of EFS when is slightly larger than is illustrated in Fig. 1(b), where the two straight lines corresponding to the frequency-time relationship of the frequency measurement system and the LFM-SUT have one intersection point in each period. Since both the temporal periods and chirp rates of the two straight lines are different, the vertical coordinates corresponding to the intersection points in different periods are also different, which compose the instantaneous frequency measurement result of the EFS method. The frequency measurement step between two adjacent periods is calculated to be
3. Experiment
To investigate the performance of the proposed EFS method, a proof-of-concept experiment is carried out. In the experiment, the CW light generated by the LD (TeraXion Inc.) has a wavelength of 1550.54 nm. The IF-LFM signal generated by the ESG (Keysight M8195S) has a bandwidth of 2.5 GHz (5–7.5 GHz) and a repetition rate of 100 kHz. Both of the MZMs (Fujitsu, FTM7938EZ) have a bandwidth of ∼25 GHz. The optical signals from two MZMs are amplified by two EDFAs (Amonics, AEDFA-PA-35-B-FA), respectively. The ODBF is realized by an optical signal processer (Finisar Inc., WaveShaper 4000s), and the OBPF is realized by an optical filter (Yenista, XTM-50). The PD has a 3 dB bandwidth of 10 GHz, and the IF filter is centered at 10 GHz with a 3 dB bandwidth of 15 MHz. The optical spectra at different points are analyzed using an optical spectrum analyzer (Yokogawa, AQ6370C) with a resolution of 0.02 nm. The microwave envelope detector (Agilent, 8474C) has an operation bandwidth from dc to 33 GHz. The envelope signal is sampled by a real-time oscilloscope (Agilent, DSO-X 92504A) with a moderate sampling rate that is 100 MSa/s. Since the image frequency interference is not considered, the IRF is not used in the experiment. Based on these parameters, the frequency measurement range of the established system is chosen to be 30–40 GHz, which is four times the bandwidth of the IF-LFM signal. The time required for a single-period frequency scanning is .
To test the measurement accuracy over the whole measurement range, the SUT is set to a single-frequency signal from 30 GHz to 40 GHz with a step of 500 MHz, which is generated by a microwave signal generator (Agilent, E8257D). The optical spectra of the signal after MZM1 and the signal from the ODBF are shown in Fig. 2(a), in which the -order modulation sidebands are successfully selected after the ODBF with the undesired components well suppressed. Figure 2(b) shows the spectra of the signal from MZM2 and the signal from the OBPF. It is found that the desired optical carrier and the -order modulation sideband are acquired after the OBPF. When the frequency of the SUT is 31 GHz, the sampled envelope signal having a single short pulse is shown in Fig. 3. The full width at half-maximum (FWHM) of the pulse is 46 ns, corresponding to a frequency measurement resolution of 46 MHz[15]. The averaged measurement error considering all the frequencies is 6.9 MHz. Hence, the proposed system is capable of implementing frequency measurements with small errors over the whole frequency measurement range. Based on the method in Ref. [10], the spurious free dynamic range (SFDR) of the system is measured to be 50 dB.

Fig. 2. (a) Optical spectra of the signal after MZM1 and the signal after ODBF and (b) optical spectra of the signal after MZM2 and the signal after OBPF.
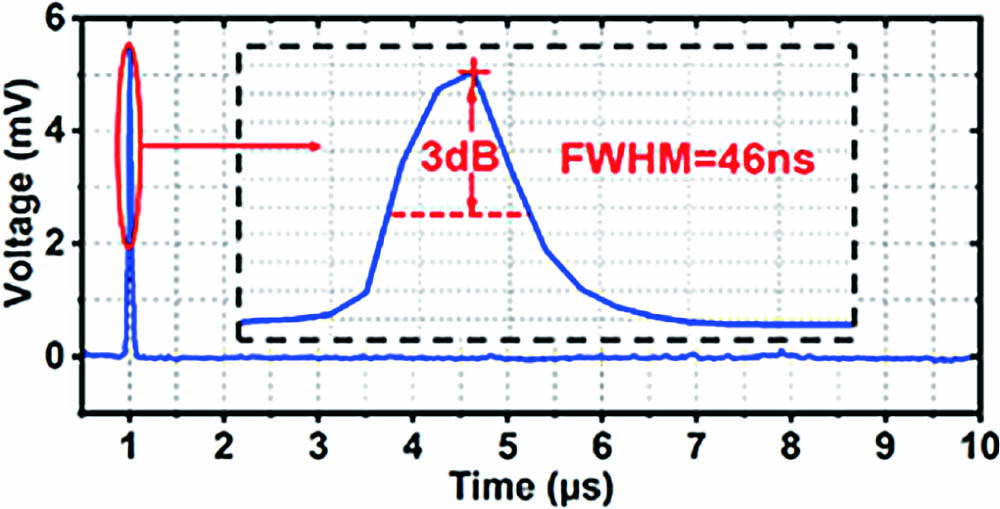
Fig. 3. Sampled waveform of the envelope signal when the SUT is a single-frequency signal at 31 GHz.
Then, frequency analysis of LFM signals is demonstrated. Theoretically, the maximum bandwidth of the LFM-SUT that can be measured by the established system is 10 GHz (30–40 GHz). In the experiment, the LFM-SUT is first set to have a positive frequency chirp with a total bandwidth of 3 GHz (30–33 GHz) and a temporal period of . According to Eqs. (7) and (8), the frequency measurement step of the EFS method is 231 MHz, and it takes 13 periods to complete the frequency measurement. As an example, the waveforms of the envelope signals sampled in the , , , and periods are shown in Fig. 4(a). In these waveforms, a short pulse appears at a specific time position, which is respectively. Based on Eq. (6), the instantaneous frequencies acquired in these four periods are 30.58 GHz, 31.28 GHz, 31.97 GHz, and 32.66 GHz, respectively. By reconstructing all of the EFS results into a single period of , the instantaneous frequency measurement result is finally obtained, as shown in Fig. 4(b), where the true frequency-time relation of the LFM-SUT is also provided. In Fig. 4(b), the averaged measurement error of all 13 frequency sampling results is calculated to be 6.1 MHz.
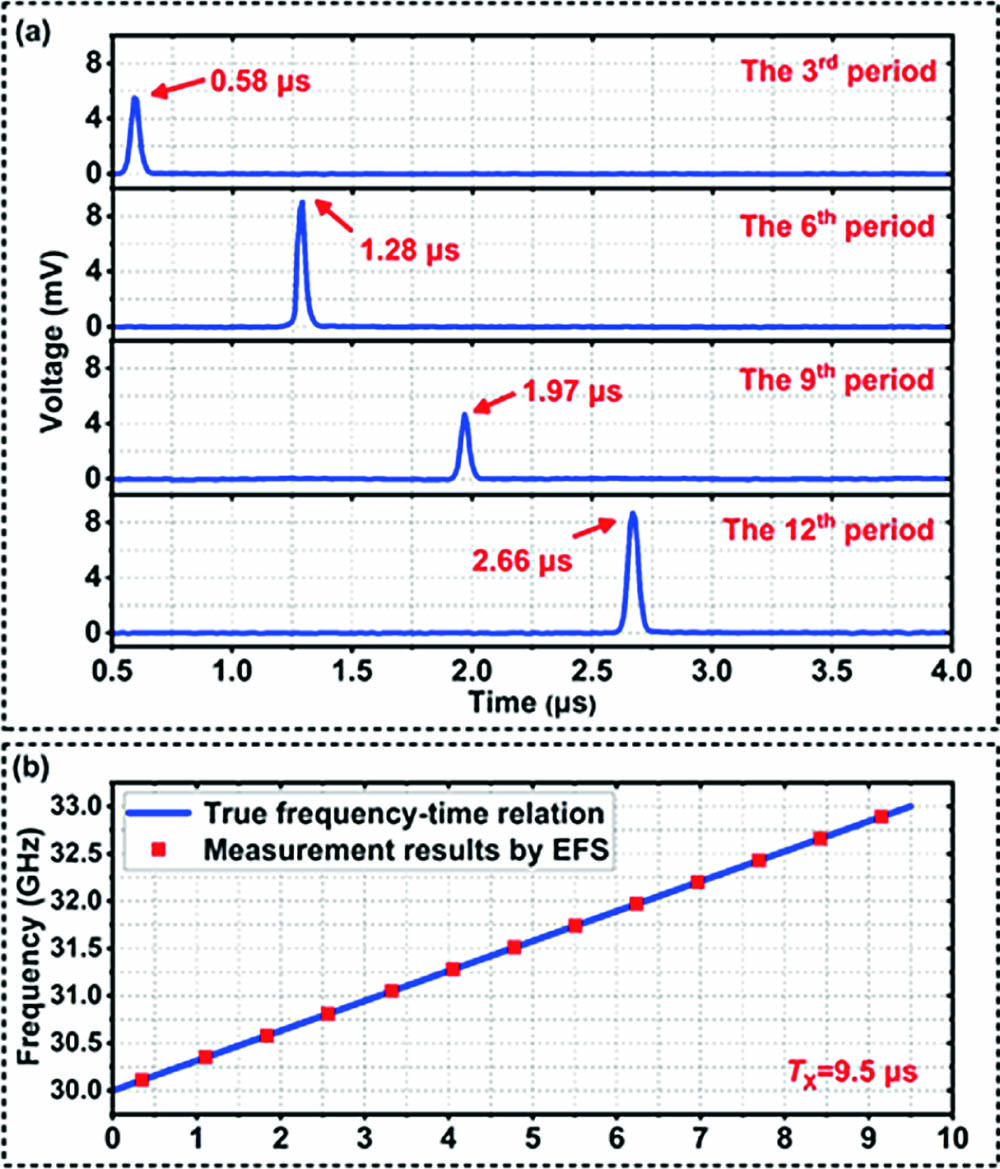
Fig. 4. (a) Sampled waveforms in four periods when measuring the LFM-SUT from 30 GHz to 33 GHz and (b) the measurement results obtained by the proposed method.
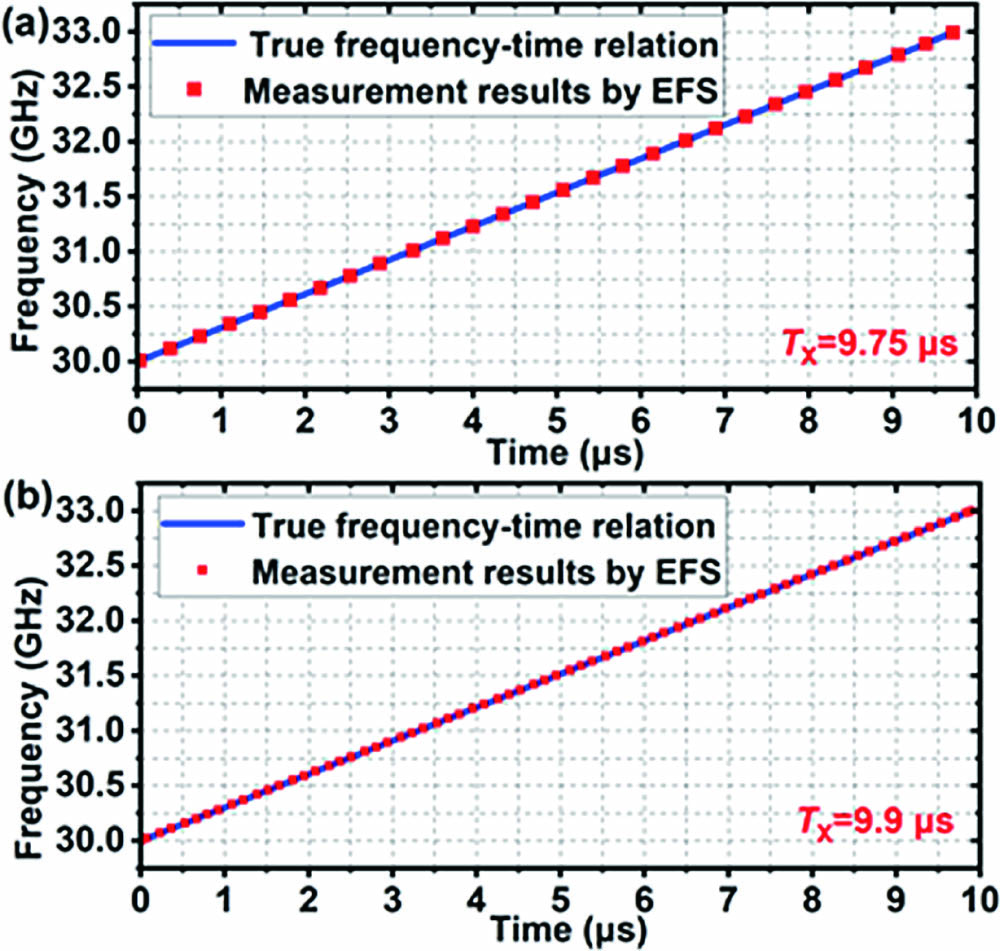
The previous measurement has a large frequency step because of the relatively large difference between the temporal periods of the frequency scanning receiver and the LFM-SUT, which can only acquire a sparse frequency-time relation. To get more complete frequency information, a small frequency measurement step is preferred. To check this property, the temporal period of the LFM-SUT is changed to () and (), respectively, while the bandwidth remains at 3 GHz (30–33 GHz). The corresponding frequency measurement step is reduced to 111 MHz and 43.5 MHz, respectively. Figure 5 shows the measured frequency-time relations, in which the EFS generates 28 and 69 frequency samples, respectively. In Figs. 5(a) and 5(b), the averaged frequency measurement error is calculated to be 6.3 MHz and 3.3 MHz, respectively. These results can verify that, by reducing the frequency measurement step, the proposed method can obtain very detailed frequency-time information of the LFM-SUT.
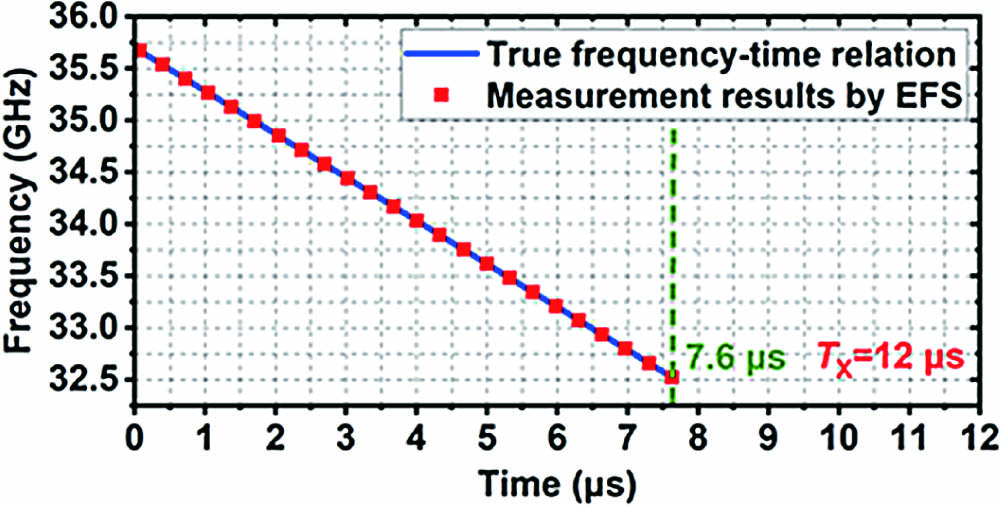
In the previous demonstration, the LFM-SUT has a full duty cycle, and its chirp rate is positive. In fact, the proposed EFS method is also capable of analyzing pulsed LFM signals or LFM signals with negative frequency chirps. To show this property, the LFM-SUT is set to a pulsed LFM signal with a negative chirp rate. Specifically, the LFM-SUT has a bandwidth of 3.2 GHz (35.7–32.5 GHz) and a temporal period of with a duty cycle of 64%. To measure this signal, the scanning period of the IF-LFM signal is tuned to , and the sampling rate of the ADC is still 100 MSa/s. Figure 6 shows the measurement result, which contains 24 EFS values with a step of ∼137 MHz. The averaged measurement error is calculated to be 2.4 MHz, and the acquired frequencies take up out of a period of , which agrees well with the true duty cycle.
4. Conclusion
In conclusion, we have proposed and demonstrated a photonics-assisted EFS method for instantaneous frequency analysis of broadband microwave LFM signals. This method is realized by a photonic scanning receiver that has a frequency scanning rate slightly different from the repetition rate of the LFM-SUT. This method can avoid the use of high-speed ADCs and simplify the frequency acquisition procedure. In the experiment, frequency analysis of Kα-band LFM signals with bandwidth up to 3 GHz is implemented with a sampling rate of 100 MSa/s. The averaged instantaneous frequency measurement errors are less than 6.5 MHz. Therefore, the proposed method is a good solution to instantaneous frequency measurement of high-frequency and broadband LFM signals.
Article Outline
Yuewen Zhou, Fangzheng Zhang, Shilong Pan. Instantaneous frequency analysis of broadband LFM signals by photonics-assisted equivalent frequency sampling[J]. Chinese Optics Letters, 2021, 19(1): 013901.
