Temperature measurement based on adaptive dual-comb absorption spectral detection  Download: 736次
1 Shanghai Key Laboratory of Modern Optical System, Engineering Research Center of Optical Instrument and System, Ministry of Education, School of Optical-Electrical and Computer Engineering, University of Shanghai for Science and Technology, Shanghai 200093, China
2 State Key Laboratory of Precision Spectroscopy, East China Normal University, Shanghai 200062, China
Figures & Tables
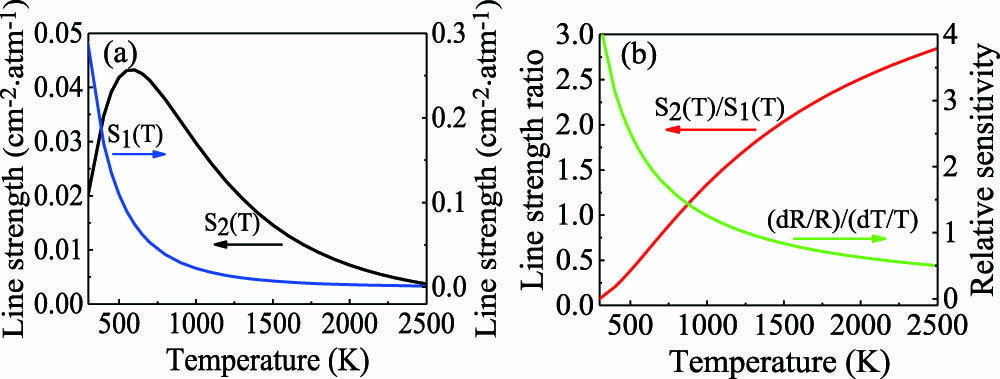
Fig. 1. (a) Line strength at different temperatures for each line. (b) Line strength ratio and relative sensitivity of target lines at different temperatures.
下载图片 查看原文
Fig. 2. Experimental setup. EDFA: erbium-doped optical fiber amplifier; HNLF: highly nonlinear fiber; BPF: bandpass filter; CP: coupler; ACS: asynchronous clock signal; PES: phase error signal; FAC: fast acquisition card; CLK: clock; CH: signal input channel; M: mixer.
下载图片 查看原文
Fig. 3. Spectra of two combs from the fiber oscillator (gray solid line), broadening spectra after the highly nonlinear fibers (blue dotted line), and filtered spectra (red area) for (a) comb and (b) comb B respectively.
下载图片 查看原文
Fig. 4. (a) Dual-comb interferograms of a single measurement (black) and -fold time-domain averaging (pink). (b) Comparison of the absorption line of water vapor at 296 K with the HITRAN database.
下载图片 查看原文
Fig. 5. Multiple-peak Voigt fit (solid line) to the measured spectral absorbance (dotted line) at different temperatures. The corresponding relative residuals normalized to the peak value of the respective fitting curve are shown on the top panel with a range from −10% to 10%.
下载图片 查看原文
Table1. Parameters of the Two Target Lines for Simulation and Experiment
| Line index | Wavenumber | Line strength at 296 K | |
|---|
| 1 | 7168.437 | 0.29 | 173.366 | | 2 | 7185.597 | | 1045.058 |
|
查看原文
Table2. Detailed Comparison Between Measured Temperature and Setting Temperature
| Setting temperature (K) | Average temperature (K) | Calculated temperature (K) | Relative deviation (%) |
|---|
| 500 | 465.2 | 476.1 | 2.34 | | 600 | 559.4 | 574.8 | 2.75 | | 700 | 645.7 | 666.2 | 3.17 | | 800 | 733.4 | 755.0 | 2.94 | | 900 | 810.3 | 846.9 | 4.51 | | 1000 | 891.5 | 935.5 | 4.93 |
|
查看原文
Kangwen Yang, Hai Li, Hang Gong, Xuling Shen, Qiang Hao, Ming Yan, Kun Huang, Heping Zeng. Temperature measurement based on adaptive dual-comb absorption spectral detection[J]. Chinese Optics Letters, 2020, 18(5): 051401.


 PDF全文
PDF全文

