Chinese Optics Letters, 2018, 16 (9): 091001, Published Online: Sep. 6, 2018   

On-line beam diagnostics based on single-shot beam splitting phase retrieval Download: 714次

Author Affiliations
1 Shanghai Institute of Optics and Fine Mechanics, Chinese Academy of Sciences, Shanghai 201800, China
2 University of Chinese Academy of Sciences, Beijing 100049, China
Abstract
We propose a novel on-line beam diagnostic method based on single-shot beam splitting phase retrieval. The incident beam to be measured is diffracted into many replicas by a Dammann grating and then propagates through a weakly scattering phase plate with a known structure; the exiting beams propagate along their original direction and form an array of diffraction patterns on the detector plane. By applying the intensity of diffraction patterns into an iterative algorithm and calculating between the grating plane, weakly scattering plane, and detector plane, the complex field of the incident beam can be reconstructed rapidly; the feasibility of this method is verified experimentally with wavelengths of 1053 and 632.8 nm.

In a high-power laser system, the quality of the laser beam performs an important role[1]. However, due to the complexity of high-power laser systems containing hundreds of optical elements, the quality of the laser beam may be influenced by the material defects, manufacturing error, gas density variations, thermal distortion, and dust in the environment, which will lead to the deformation of the wave-front and failure of the experiment. The traditional beam diagnostics method includes the interferometers[2] and Shack–Hartmann[3,4] sensors, where the interferometers have high accuracy, but their complex structure and high demands of the environment make them difficult to measure the on-line beam quality. The Shack–Hartmann sensors measure the wave-front by dividing it into subbeams with arrays of microlenses and analyzing focal spot displacement[5], and it has been applied successfully in the OMEGA extended performance (EP) laser system to measure the focal spot at full energy[6]. However, the resolution of the Shack–Hartmann sensor is limited by its finite number of microlenses[7]. Phase retrieval is an effective technique for estimating the wave-front based on a series of intensity measurements[8,9]. It has been applied to the high-energy laser system focal spot characterization[10]. The phase retrieval method contains a variety of algorithms like the Gerchberg–Saxton (G-S) algorithm[11], the Yang–Gu algorithm[12], the Eerror-reduction (ER) algorithm[13], and the hybrid input–output (HIO) algorithm[14]. In 2010, Zhang proposed the coherent modulation imaging (CMI) algorithm[15,16], which uses only one diffraction pattern to recover the phase of the incident beam and is able to achieve fast converge due to the random phase modulation. The CMI technique has been successfully applied in wave-front diagnostics in high-power laser systems[17]. All of these algorithms can realize phase reconstruction with one single measurement. However, since only one frame of the diffraction pattern is recorded, the information coded is quite limited, and they always suffer disadvantages of a small field of view, low converging speed, and low reliability. The ptychography algorithm[18] proposed by Rodenburg uses a single probe to laterally scan the target sample in overlapping positions and record the diffraction patterns; by applying the ptycholographic iterative engine (PIE) algorithm[19] to the intensity of recorded diffraction patterns, the amplitude and phase of the target sample can be reconstructed rapidly with high resolution. However, the data acquisition of the PIE experiment generally takes 10 min or more[20]; in case of an X-ray, the acquisition time will even be hours[21]. The long data acquisition time requires high stability of the experimental environment, and all of these disadvantages make the PIE algorithm unavailable for dynamic imaging. To speed up the data acquisition, our research group proposed a grating-based single-shot PIE method[22]. This method uses a two-dimensional grating to split the illuminating probe into overlapping beam clusters illuminating on the sample. In 2016, Cohen and Sidorenko[23] proposed using a pinhole array to generate an array of overlapping illuminating probes. Since these two methods replace the probe scanning process with overlapping multi-beam illumination to realize PIE with a single measurement, the data acquisition time is obviously shortened. However, the beam clusters illuminating on the sample are required to be overlapped, and, at the recording plane, they are required to be separated. These requirements make the experiment setup accordingly complex.

In this Letter, on-line beam diagnostics based on single-shot beam splitting phase retrieval is proposed. The incident beam to be measured is split into ten or more replicas by a Dammann grating; these replicas illuminate on a weakly scattering plate with known structure. Since there is no overlap between the neighboring replicas, the experiment setup can be simplified, and the diffraction patterns recorded on the charge coupled device (CCD) are easy to separate with each other totally by iteratively calculating between three planes: the grating plane, weakly scattering plane, and detector plane. The complex field of the incident beam can be reconstructed rapidly and precisely. Compared with the CMI technique, this method uses a single-shot diffraction pattern, which has more replicas, and thus, the signal to noise ratio obviously improves.

The principle of the single-shot beam splitting phase retrieval can be shown schematically with Fig. 1. The incident beam to be measured is diffracted into many replicas by a Dammann grating, and then all these replicas are incident on a weakly scattering plate with a known structure. The exiting waves propagate roughly along their own direction and form an array of diffraction patterns on the detector plane. If the diffraction angle of Dammann grating is large enough, there will be no overlap between the neighboring diffracted beams, and the diffraction patterns recorded on the detector plane will be clearly isolated from each other. Since these recorded diffraction patterns are formed by the diffracted replicas (except for different ramps), they are in fact the same as that recorded by sequentially scanning the weakly scattering plate through a single laser beam. If the complex fields of diffracted replicas are known, the transmitting function of the weakly scattering plate can be reconstructed by a standard PIE algorithm, inversely, the complex field of diffracted replicas can be recovered when the transmitting function of the weakly scattering plate is known. If the transmitting function of the weakly scattering plate is known in advance, the condition of overlapping illumination on it will be unnecessary; this makes the experiment much easier to realize.

Fig. 1. Schematic diagram of single-shot beam splitting phase retrieval.

下载图片 查看所有图片

In real experiments, the structure of the Dammann grating cannot be ideally perfect. The diffracted beams from it will not be exactly the same as each other. Then, in the iteration process, the algorithm cannot be applied only on the plane of the weakly scattering plate, the transmitting function of the Dammann grating must also be considered. A standard PIE algorithm can be applied in advance in the experiment to obtain the exact structure of the Dammann grating Q(x,y) and the weakly scattering plate P(x,y). Firstly, the weakly scattering plate is moved out from the optical path, and the Dammann grating is laterally scanned across the illuminating beam at overlap positions. The mnth order of the transmitting field of the Dammann grating can be reconstructed with the mnth recorded diffraction pattern. Then the weakly scattering plate is put back into the light path and scanned laterally across the illuminating beam arrays. Its transmitting function Pm.n(x,y) of the region illuminated by the mnth diffracted beam can be reconstructed in the same way. With the known transmitting functions of the Dammann grating and the weakly scattering plate, by giving an initial guess Gk(x,y) to the light field incident on the Dammann grating, the complex field of the incident beam can be reconstructed iteratively with the following steps: The mnth diffracted beam Gk,m,n(x,y) is computed as Gk(x,y)·Qmn(x,y) and propagates to the weakly diffractive plate by computing Illuk,m,n=I(Gk·Qmn,L1), where I(Gk·Qmn,L1) represents the Fresnel propagation of Gk·Qmn by a distance of L1.Calculate the exiting field of Ok,m,n=Illuk,m,n*P from the weakly diffractive plate and propagate it to the detector as Diffk,m,n=I(Ok,m,n,L2).Replace the modulus of Diffk,m,n with the square root of Im,n and keep the phase of Diffk,m,n unchanged. The complex field on the CCD chip is updated as Diffk,m,n=Im,nexp(jφm,n), where φm,n is the phase of Diffk,m,n.Propagate Diffk,m,n back to the weakly scattering plate plane to obtain an updated exiting field Ok,m,n=I1(Diffk,m,n,L2), where I1 represents the inverse Fresnel propagation, and update the illuminating beam on the weakly diffractive plate as Illuk,m,n=Illuk,m,n+|P||P|maxconj(P)|P|2+α(Ok,m,nOk,m,n),where α is a constant to suppress the noise, and, to avoid the denominator becoming zero, we set α=1 here. This updated equation is similar to the updated equation in ptychography[16], where the parameter β is set to be 1.Propagate Illuk,m,n back to the Dammann grating plane to get an updated exiting beam Rk,m,n=I1(Illuk,m,n,L1), and then update the illuminating beam Gk,m,n on the Dammann grating according to Eq. (2): Gk=Gk+|Qmn||Qmn|maxconj(Qmn)|Qmn|2+α(Rk,m,nGk,m,n*Qmn).Jump to step (1) to repeat the above computations on other diffracted beams until all diffracted beams are addressed.Calculate the reconstruction error with Eq. (3): Errork=m,n|Im,n|Diffk,m,n||2m,nIm,n.If the reconstruction error is larger than the expected value, jump to step (1) to start another round of iterative computations, else propagate Gk to the aperture plane to get the transmitted field T(x,y) of the incident beam. The pseudo-code algorithm (Appendix A) of this iteration process can be seen at the bottom of this article.

The experiment setup is shown in Fig. 2, where an aperture with diameter of 2 mm is adopted to limit the size of incident beam. The Dammann grating has 5×5 diffraction orders, and the angel between two neighboring diffraction orders is 6.787°. At the wavelength of 632.8 nm, the weakly diffractive plate is made by recording speckle patterns on a holographic plate and bleaching it with the solution of K3Fe(CN)6, at a wavelength of 1053 nm. The weakly diffractive plate is made by smearing the glass slide with polyethylene spheres with diameter of 2 μm. The detector is a Lumenera CCD with 4008pixel×2672 pixel, where the pixel size is 9 μm. The distances between the Dammann grating, the weakly scattering plate, and the CCD are 106.48 and 55.18 mm, respectively. A lens with focal length 100 mm is placed before the Dammann grating to collect more light to the CCD. Thus, the illuminating beam on the Dammann grating is a sphere wave, and the incident wave at the aperture plane is a plane wave.

Fig. 2. Experimental setup of single-shot beam splitting phase retrieval.

下载图片 查看所有图片

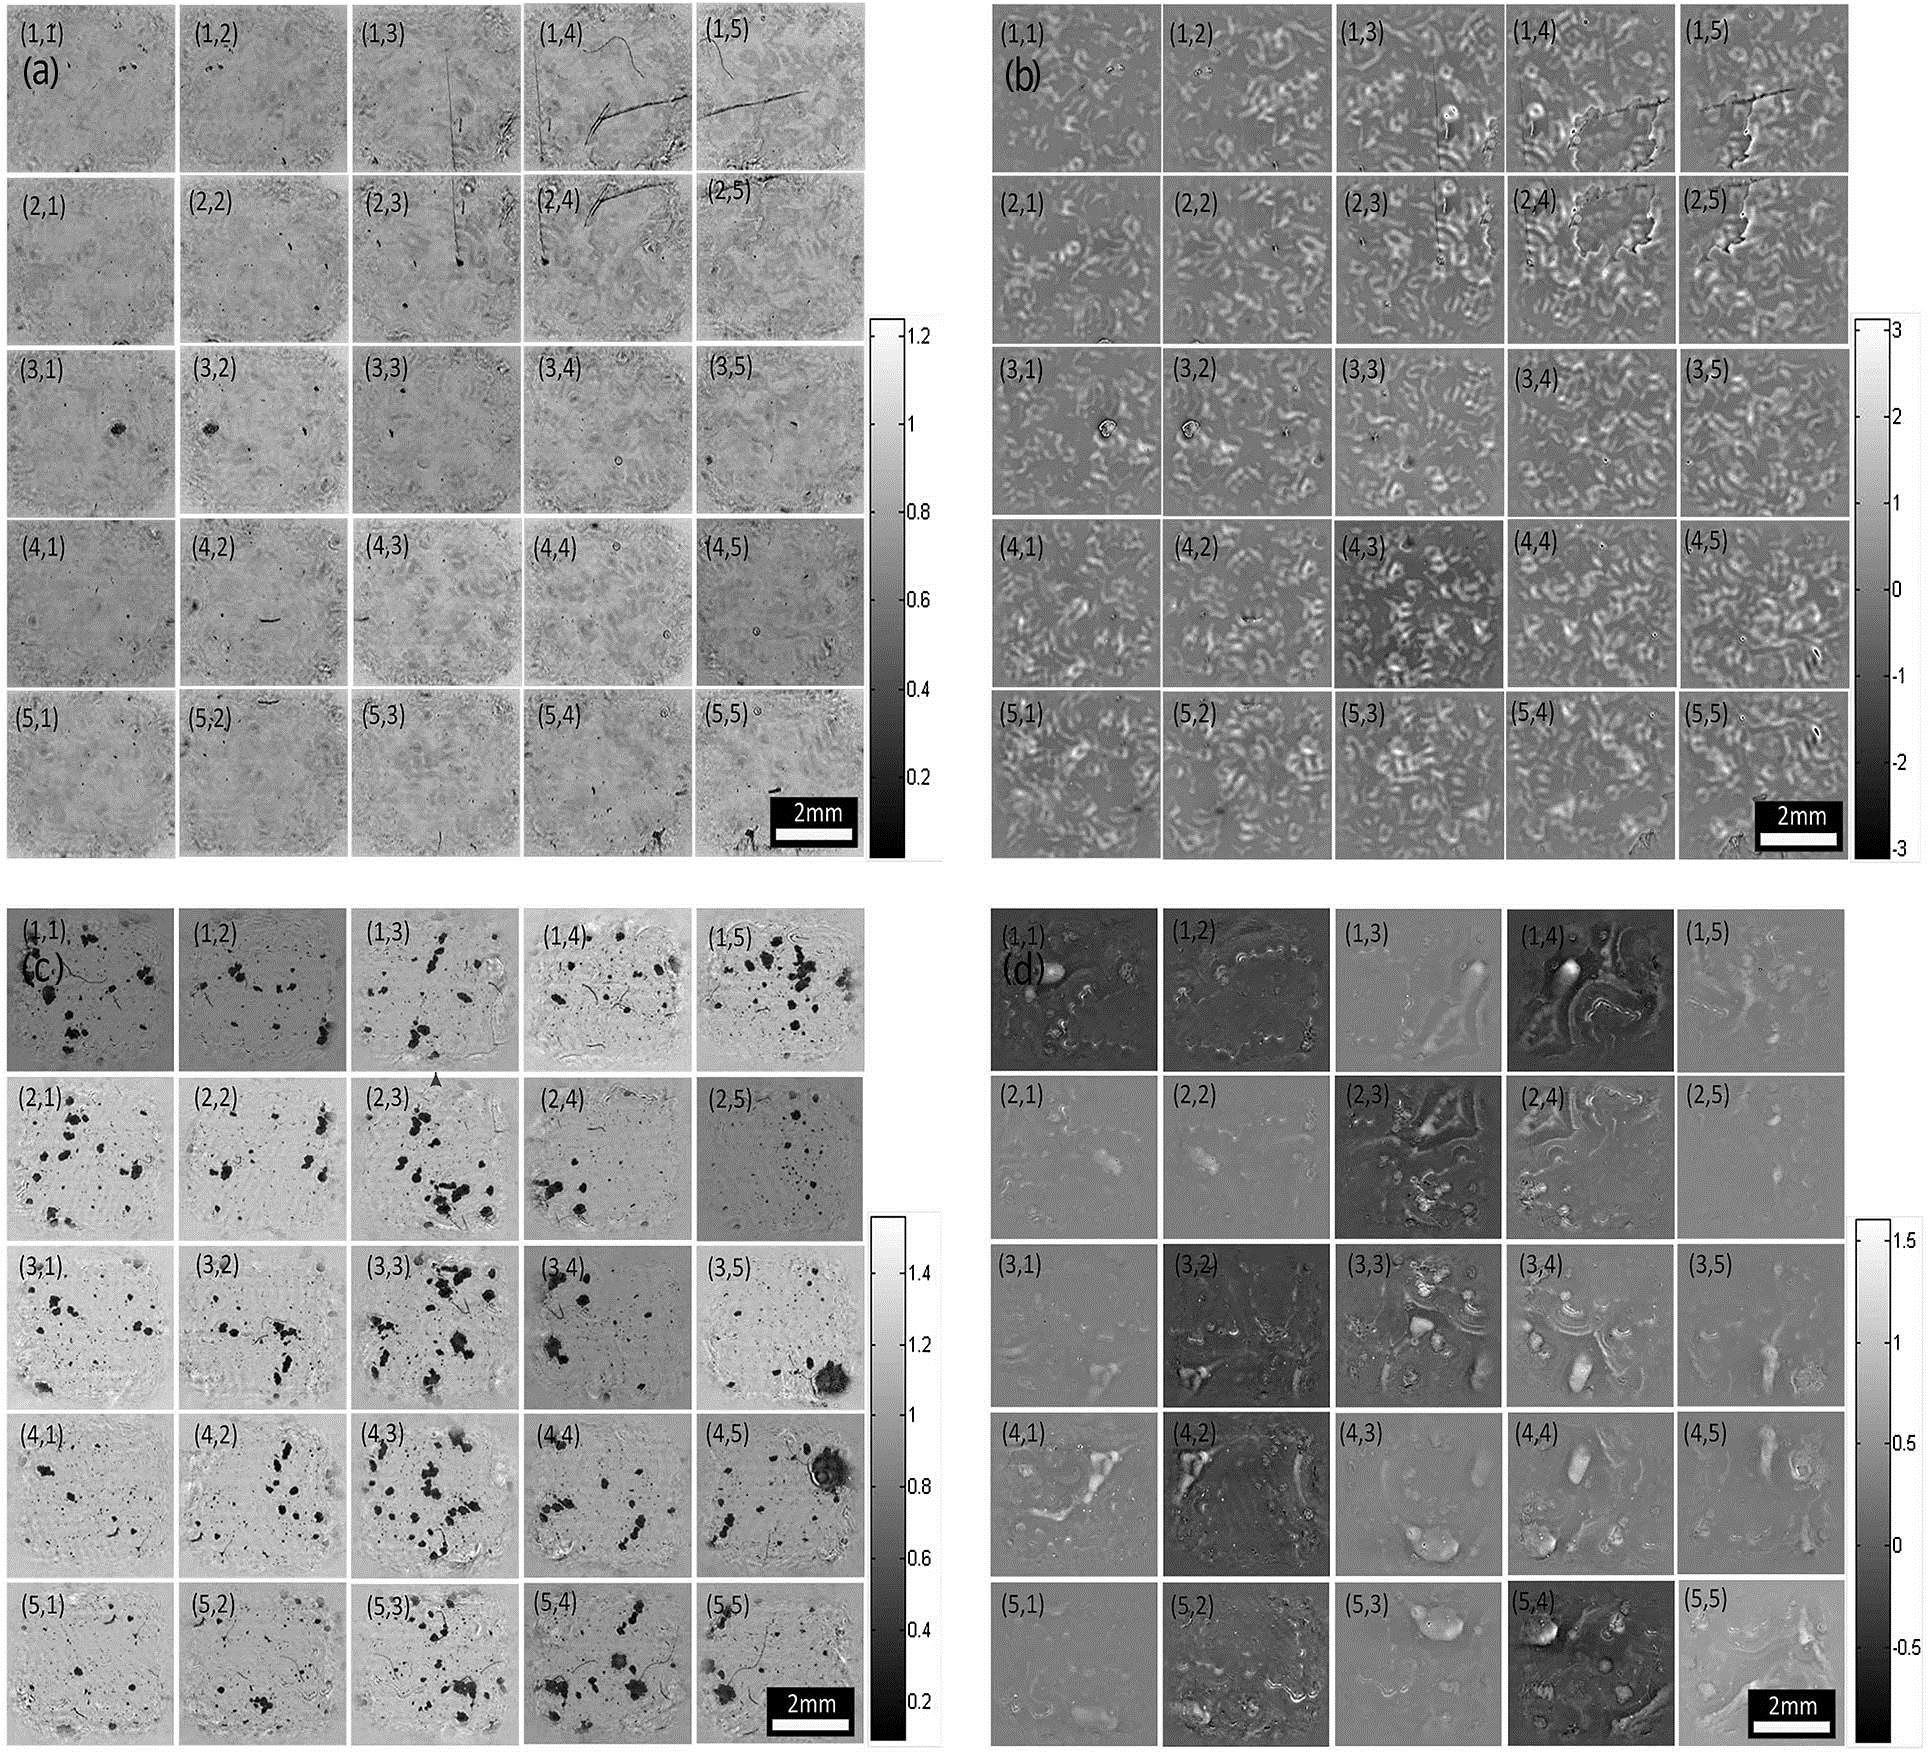
To get the accurate transmitting function of the Dammann grating and the weakly scattering plate, we use translation stages (Thorlabs PMZ-8) to scan them, and then we adopt a standard PIE algorithm to reconstruct their complex field. The Dammann grating is scanned in 10×10 overlap positions with a step of 0.198 mm. At each position, a 5×5 diffraction patterns array is recorded, and we split the 5×5 diffraction array into 25 independent sub-diffraction patterns. By using them, the modulus and the transmitting phase of each diffraction order can be reconstructed, which is shown in Fig. 3. It can be seen that the transmitting modulus and phase of each diffraction order are different from those of the other. The units of the modulus and phase measured for the 5×5 diffraction orders are arbitrary and in radians, since the amplitude can represent the transmittance, and the range of phase changes from π to π. The units are the same in Figs. 4, 5, and 6.
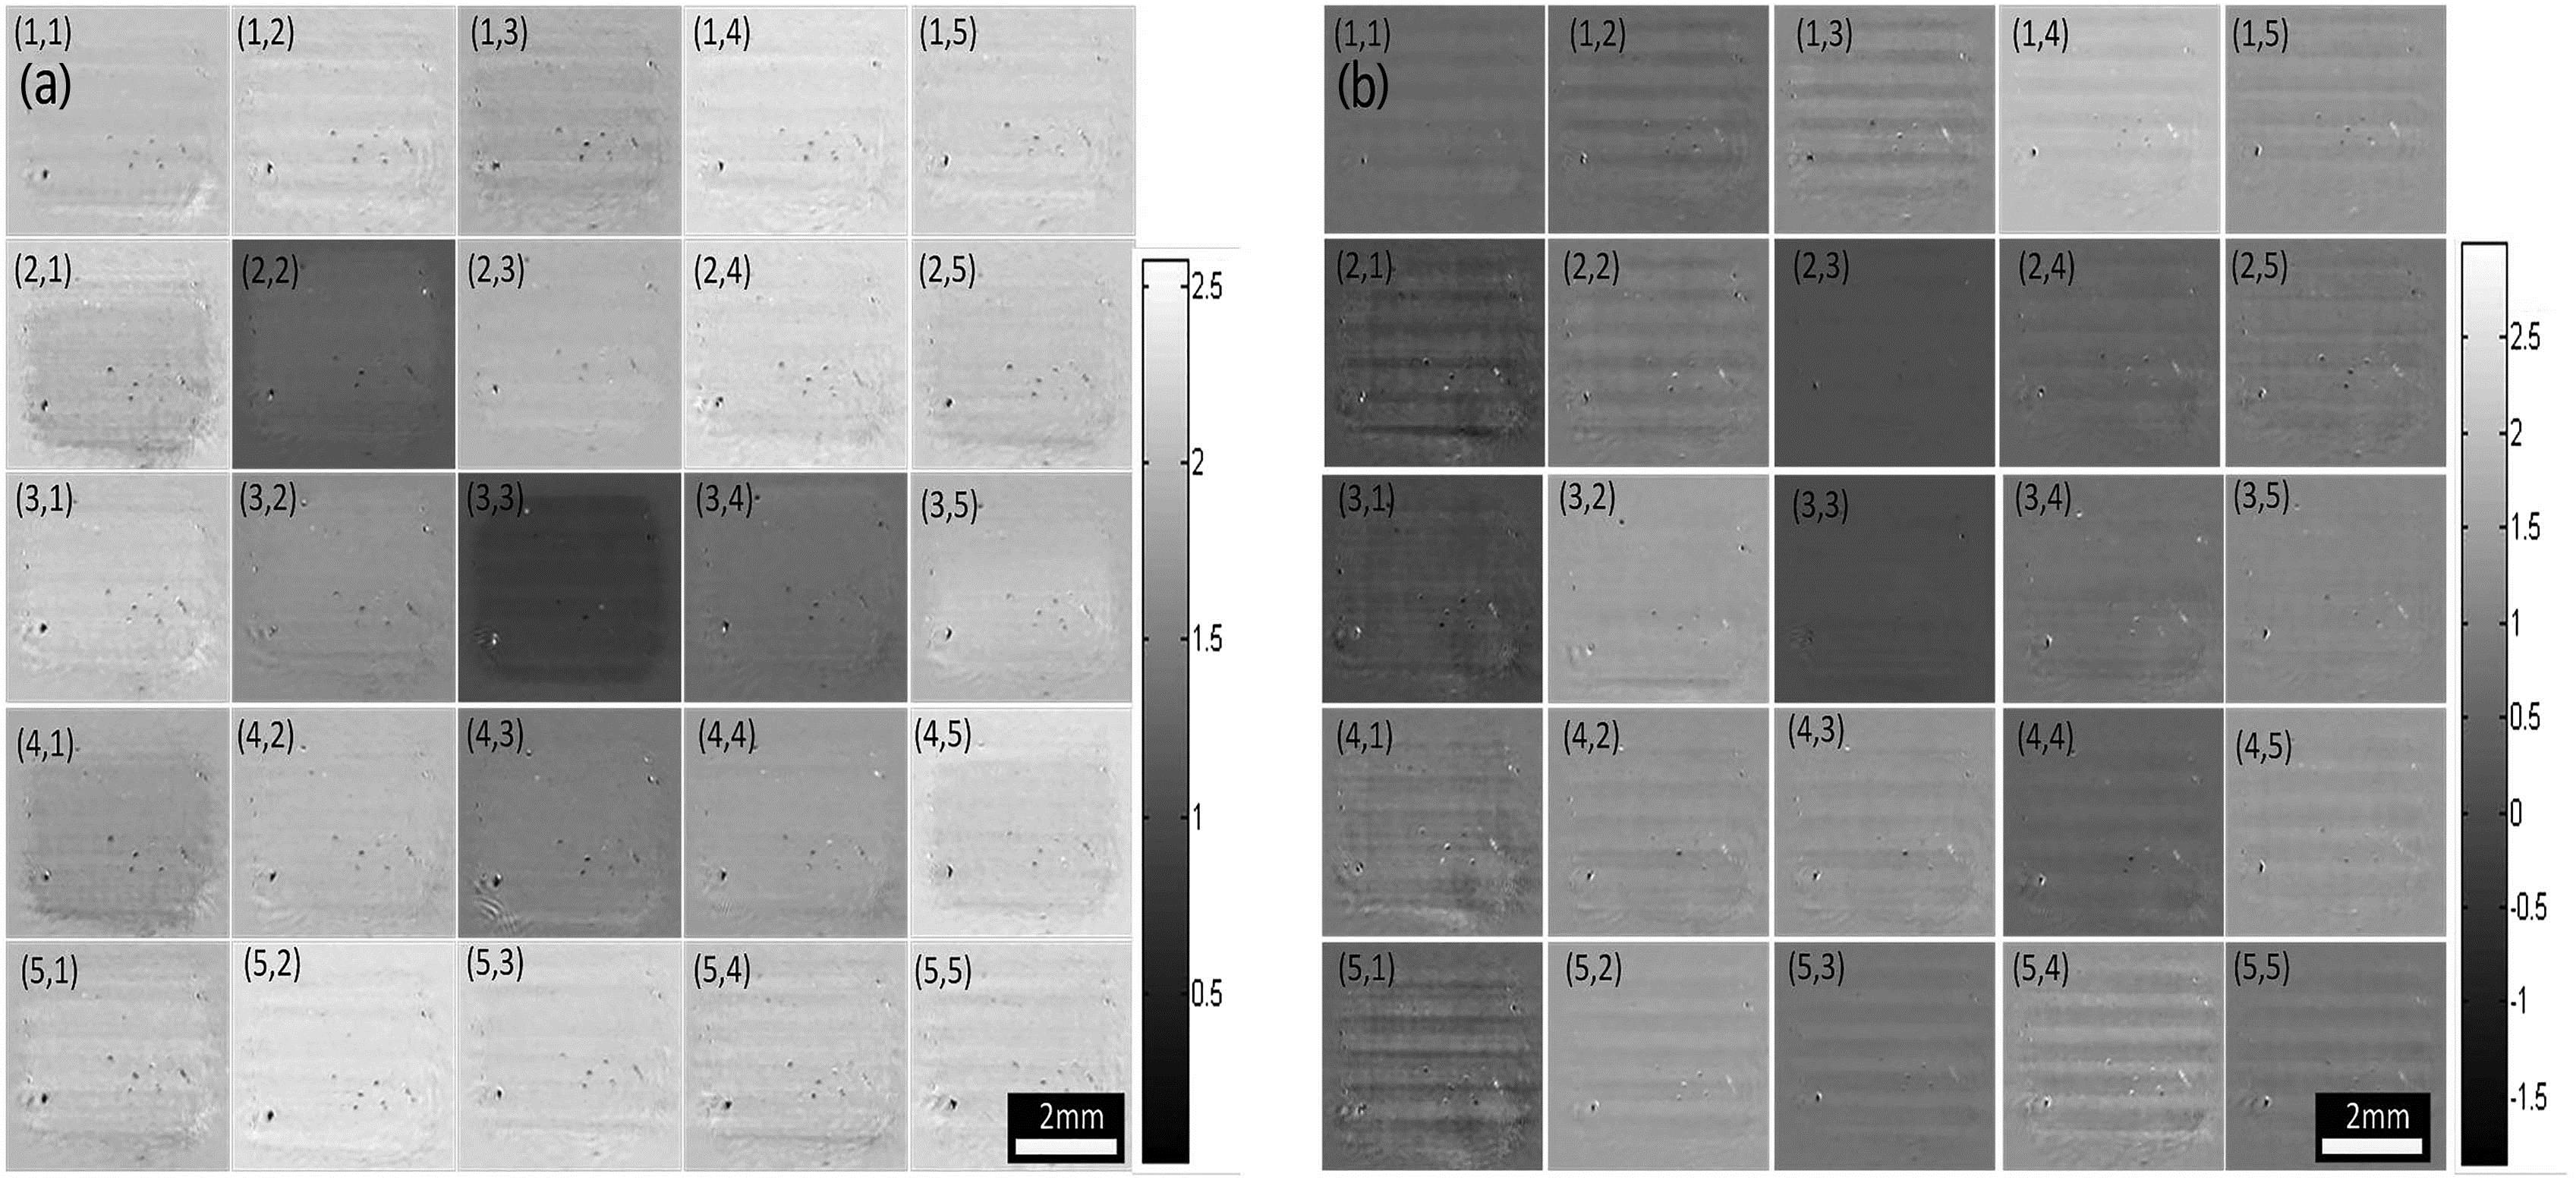
Fig. 3. 5×5 orders of transmission functions of the Dammann grating: (a) the transmitting modulus and (b) the transmitting phase.

下载图片 查看所有图片

Fig. 4. (a) The transmitting modulus and (b) the transmitting phase of the 5×5 orders of transmission functions of the weakly scattering plate at a wavelength of 632.8 nm; (c) the transmitting modulus and (d) the transmitting phase of the 5×5 orders of transmission functions of the weakly scattering plate at a wavelength of 1053 nm.
下载图片 查看所有图片

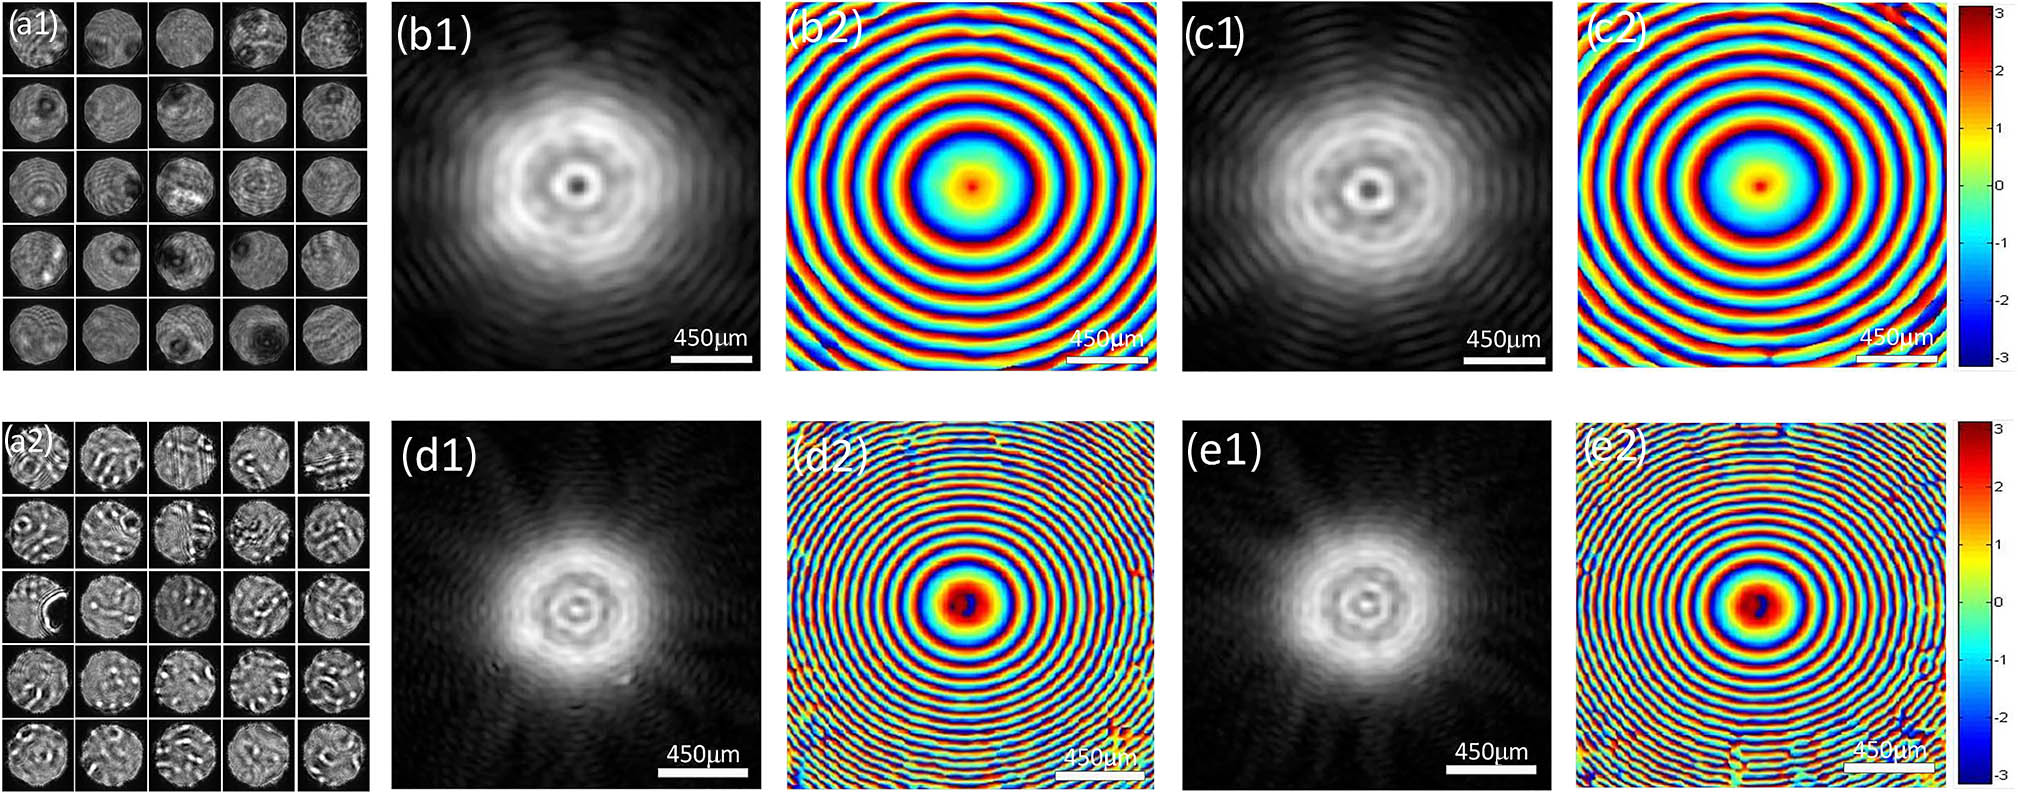
Fig. 5. (a1) The recorded diffraction pattern array at a wavelength 1053 nm; (a2) the recorded diffraction pattern array at a wavelength 632 nm; (b1) the reconstructed amplitude and (b2) phase of the light field incident on the grating at a wavelength of 1053 nm by the beam splitting phase retrieval algorithm; (c1) the reconstructed amplitude and (c2) phase of the light field incident on the grating at a wavelength of 1053 nm by the PIE algorithm; (d1) the reconstructed amplitude and (d2) phase of the light field incident on the grating at a wavelength of 632.8 nm by the beam splitting phase retrieval algorithm; (e1) the reconstructed amplitude and (e2) phase of the light field incident on the grating at a wavelength of 632.8 nm by the PIE algorithm.

下载图片 查看所有图片

Fig. 6. (a) Reconstructed amplitude and (b) phase of the incident beam at the aperture plane at a wavelength of 632 nm by the beam splitting phase retrieval algorithm; (c) reconstructed amplitude and (d) phase of the incident beam at the aperture plane at a wavelength of 1053 nm by the beam splitting phase retrieval algorithm.

下载图片 查看所有图片

For measuring the weakly scattering plate, it is also scanned in 10×10 positions with a step of 0.297 mm. At each position, the detector also records a 5×5 diffraction array, and the reconstructed transmitting modulus of and phase of the weakly scattering plate at wavelengths 632.8 and 1053 nm are shown in Fig. 4, where the sub-image shows the structure of the region corresponding to different diffraction orders.

To verify the feasibility of this method, we use a laser beam with wavelengths 1053 and 632.8 nm as the incident beam. The diffraction patterns are shown in Figs. 5(a1) and 5(a2). We can find that all of the diffraction patterns are isolated from each other. Since the diffracted replicas illuminate different separate regions of the weakly scattering plate, the recorded diffraction patterns are totally different from each other. By taking these recorded patterns into the iterative algorithm mentioned above with 200 iterations, the complex field of the sphere wave before the Dammann grating can be reconstructed, as shown in Figs. 5(b1), 5(b2), 5(d1), and 5(d2). Compared with the complex field of the illuminating beam reconstructed by the PIE algorithm [as shown in Figs. 5(c1), 5(c2), 5(e1), and 5(e2)], when recovering the transmitting field of the Dammann grating, the reconstructed quality of this method is quite the same as the PIE algorithm. Figures 6(a), 6(b), 6(c), and 6(d) show the reconstructed modulus and phase of the incident beam at the aperture plane, where the plane wave is recovered. It can be seen that both the plane wave and sphere wave can be reconstructed precisely.

To check the resolution of this method, a USAF 1951 resolution target is put at the aperture plane. Its transmitting modulus is reconstructed, and the results are shown in Fig. 7. It can be seen that at a wavelength 1053 nm, the third element of the fourth group is clearly reconstructed, corresponding to a spatial resolution of 49.5 μm. The second element of the fifth group can be clearly distinguished at wavelength of 632.8 nm, corresponding to a spatial resolution of 27.8 μm.
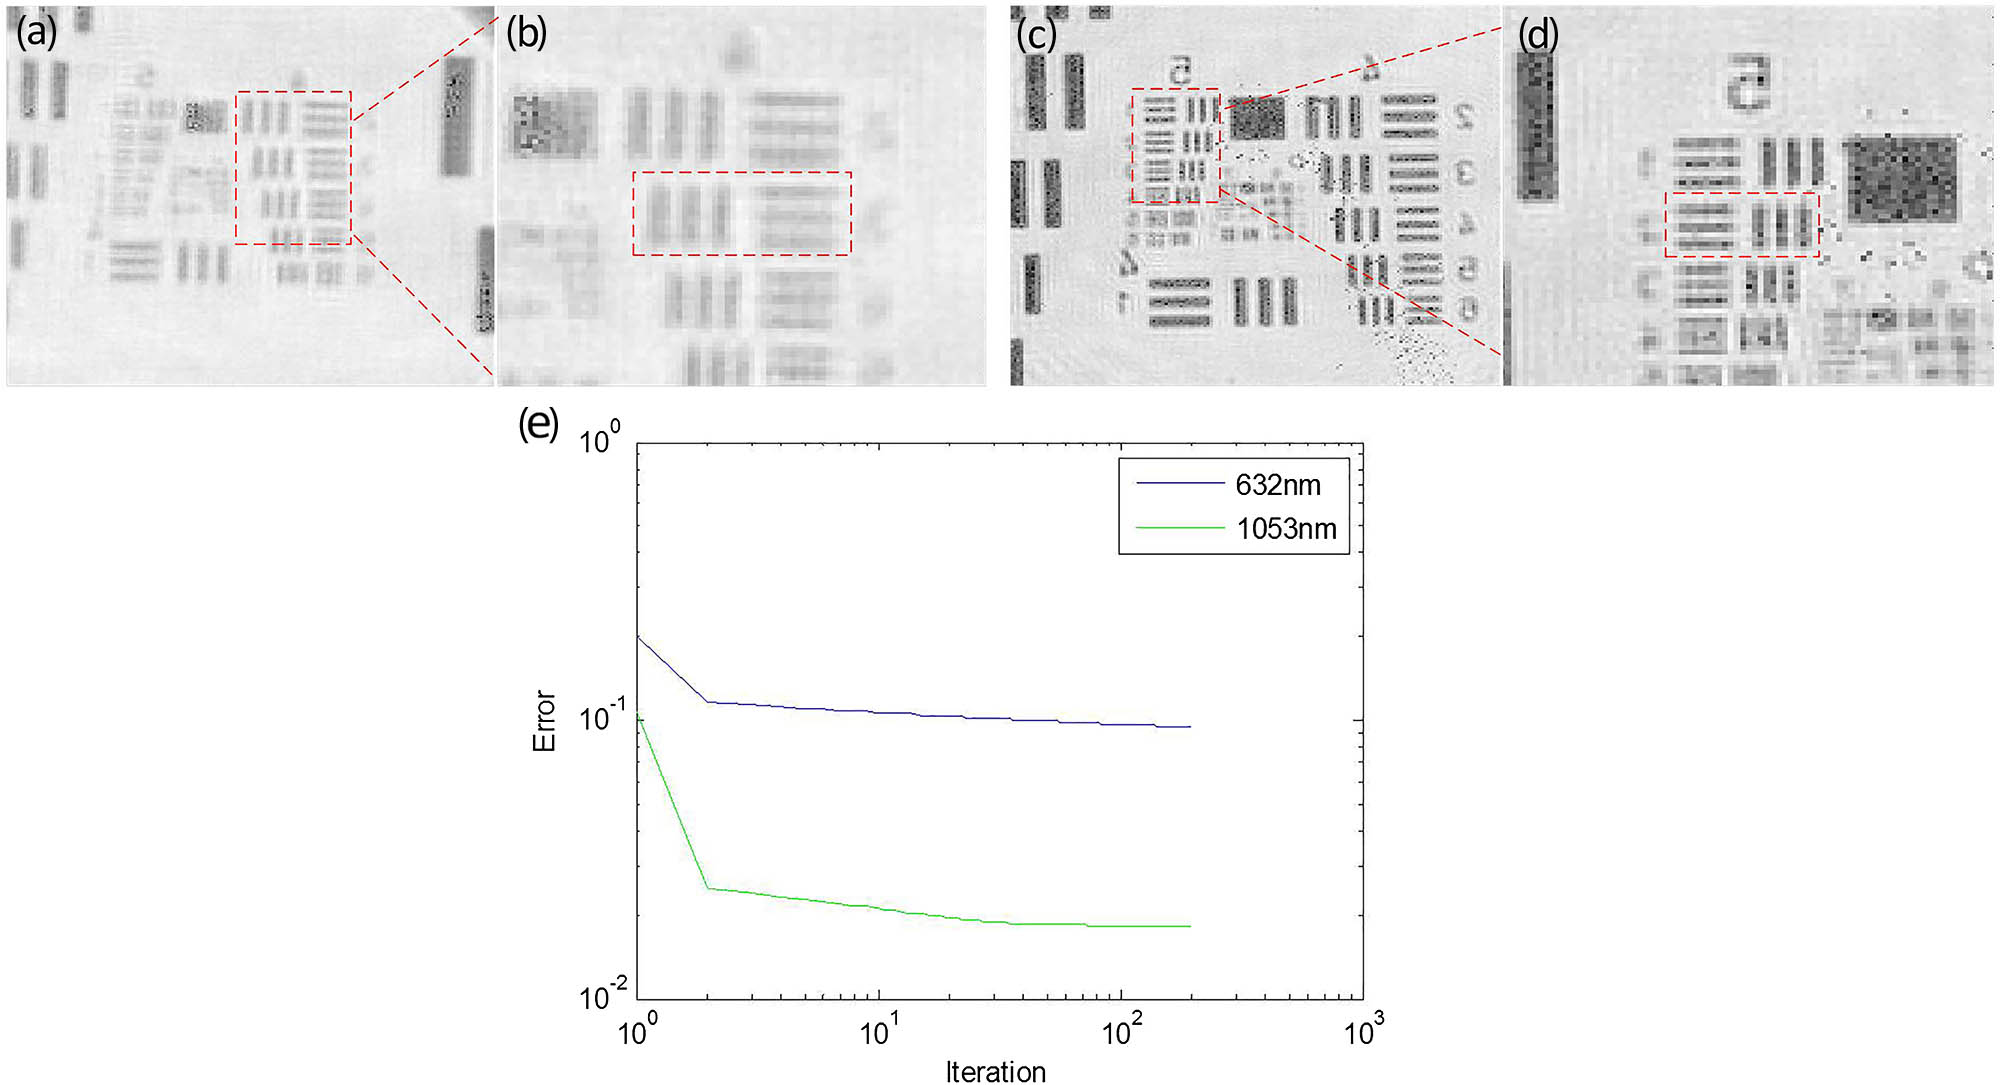
Fig. 7. (a), (b) The reconstructed amplitude of USAF 1951 resolution target and its amplification of a dashed red box at a wavelength of 1053 nm in log scale; (c), (d) the reconstructed amplitude of USAF 1951 resolution target and its amplification of a dashed red box at a wavelength of 632.8 nm in log scale; (e) the curve of error changed with iteration times in log scale at wavelengths of 632.8 and 1053 nm.

下载图片 查看所有图片

The curve of error changed with iteration times in the log scale is shown in Fig. 7(e). At the wavelength of 632.8 nm, the reconstruction error reduces to 9.95% within 50 iteration times and converges to 9.46% after 200 iteration times. When the wavelength is 1053 nm, the reconstruction error reduces to 1.88% within 30 iteration times and converges to 1.83% after 150 iteration times, both corresponding to a fast converging speed. The convergence criteria of our algorithm are that when the error of one iteration has little difference with the error of next iteration, that is, the error of iteration changes very slowly or remains unchanged, then, the iterative algorithm reaches convergence. In Fig. 7(e), the reconstruction error of both wavelengths remains almost unchanged after 200 iteration times (at a wavelength 632.8 nm, the reconstruction error remains 9.46% after 200 iteration times; at a wavelength 1053 nm, the reconstruction error remains 1.82% after 200 iteration times), and thus, 200 iterations are set to be a good stopping condition. That 9.46% is acceptable for 632.8 nm does not mean a more stringent condition is imposed to 1053 nm, because this single-shot phase retrieval system under two different wavelengths with two different weakly scattering plates may converge to two different error values independently.

In this Letter, a single-shot beam splitting phase retrieval method for on-line beam detection has been proposed. The incident beam to be measured is diffracted into many replicas by a Dammann grating. These replicas propagate along their own directions and pass through a weakly scattering plate with a known structure. The diffraction patterns can be recorded with a single measurement. By adopting the iterative algorithm between the grating plane, the weakly scattering plate plane, and the record plane, the complex field of the incident beam can be reconstructed; the feasibility of this method has been verified experimentally with wavelengths 632.8 and 1053 nm. Both the incident sphere wave and plane wave can be reconstructed rapidly and precisely. Since there is no overlap between the neighboring illuminating beams on the weakly scattering plate, the experiment setup is simplified and easy to be applied in on-line beam diagnostics.

References

[1] ZachariasR. A.BeerN. R.BlissE. S.BurkhartS. C.StolzC. J., Opt. Eng.43, 2873 (2004).

[2] LatychevskaiaT.LongchampJ. N.FinkH. W., Opt. Express20, 28871 (2012).OPEXFF1094-4087

[3] BasdenA.GengD.GuzmanD.MorrisT.MyersR.SaunterC., Appl. Opt.46, 6136 (2007).APOPAI0003-6935

[4] KongL.ZhangL.ZhuL.BaoH.GuoY.RaoX.ZhongL.RaoC., Chin. Opt. Lett.14, 100102 (2016).CJOEE31671-7694

[5] JeongT. M.MenonM.YoonG., Appl. Opt.44, 4523 (2005).APOPAI0003-6935

[6] BromageJ.BahkS. W.IrwinD.KwiatkowskiJ.PruyneA.MillecchiaM.MooreM.ZuegelJ. D., Opt. Express16, 16561 (2005).OPEXFF1094-4087

[7] FleckA.LakshminarayananV., Appl. Opt.49, G136 (2005).APOPAI0003-6935

[8] BahkS. W.BromageJ.BegishevI. A.MilehamC.StoecklC.StormM.ZuegelJ. D., Appl. Opt.47, 4589 (2005).APOPAI0003-6935

[9] TaoH.VeetilS. P.PanX.LiuC.ZhuJ., Chin. Opt. Lett.14, 071203 (2016).CJOEE31671-7694

[10] KruschwitzB. E.BahkS. W.BromageJ.MooreM. D.IrwinD., Opt. Express20, 20874 (2012).OPEXFF1094-4087

[11] GerchbergR. W., Optik35, 237 (1972).OTIKAJ0030-4026

[12] YangG. Z.GuB. Y., Acta. Phys. Sin.30, 410 (1981).

[13] FienupJ. R., Opt. Lett.3, 27 (1978).OPLEDP0146-9592

[14] FienupJ. R., Appl. Opt.21, 2758 (1982).APOPAI0003-6935

[15] ZhangF.RodenburgJ. M., Phys. Rev. B82, 2511 (2010).

[16] ZhangF.ChenB.MorrisonG. R.ComamalaJ. V.SicairosM. G.RobinsonI. K., Nat. Commun.7, 13367 (2016).NCAOBW2041-1723

[17] PanX.VeetilS. P.LiuC.TaoH.JiangY.LinQ.LiX.ZhuJ., Laser Phys. Lett.13, 055001 (2016).1612-2011

[18] FaulknerH. M.RodenburgJ. M., Phys. Rev. Lett.93, 023903 (2004).PRLTAO0031-9007

[19] DongS.NandaP.GuoK.LiaoJ.ZhengG., Photon. Res.3, 19 (2015).

[20] PanX.LiuC.LinQ.ZhuJ., Opt. Express21, 6162 (2013).OPEXFF1094-4087

[21] WangC.XuZ.LiuH.WangY.WangJ.TaiR., Appl. Opt.56, 2099 (2017).APOPAI0003-6935

[22] PanX.LiuC.ZhuJ., Appl. Phys. Lett.103, 171105 (2013).APPLAB0003-6951

[23] CohenO.SidorenkoP., Optica3, 9 (2016).

Xi He, Cheng Liu, Jianqiang Zhu. On-line beam diagnostics based on single-shot beam splitting phase retrieval[J]. Chinese Optics Letters, 2018, 16(9): 091001.

本文已被 1 篇论文引用
被引统计数据来源于中国光学期刊网
引用该论文: TXT   |   EndNote

相关论文

加载中...

关于本站 Cookie 的使用提示

中国光学期刊网使用基于 cookie 的技术来更好地为您提供各项服务,点击此处了解我们的隐私策略。 如您需继续使用本网站,请您授权我们使用本地 cookie 来保存部分信息。
全站搜索
您最值得信赖的光电行业旗舰网络服务平台!