Chinese Optics Letters, 2019, 17 (1): 011101, Published Online: Jan. 17, 2019
Snapshot imaging spectrometer based on a microlens array  Download: 838次
Figures & Tables
Fig. 1. System schematic diagram. The imaging process of a data cube, and its procedure of the down sampling and dispersive optical model.
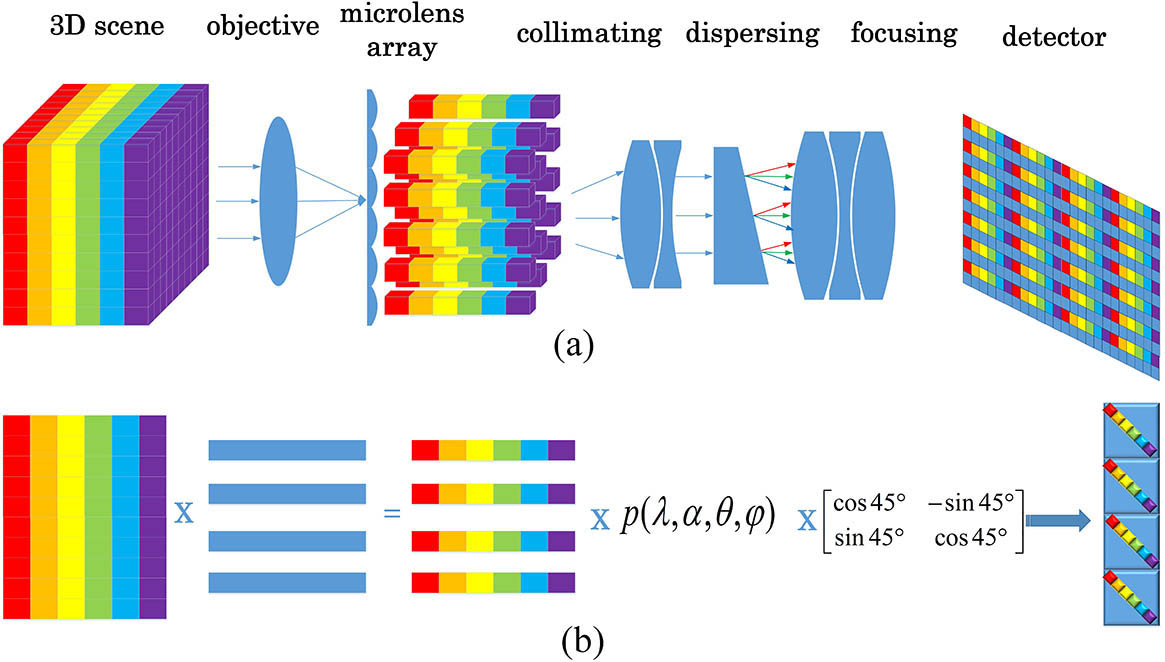

Fig. 3. Simulated diagrams of the system in Zemax. (a) The 2D layout of the final optical system. (b) The spot diagram of the system for different fields of view and different wavelengths.

Fig. 4. F F F F F


Fig. 6. Diagram of the experimental setup. (a) The overall view of the setup. (b) The inside details of the key parts.

Fig. 7. Images of the whiteboard at different wavelengths. (a) 514.5 nm. (b) 560 nm. (c) 632.8 nm.

Fig. 8. Experimental result. (a) The original graph. (b) The image of the original graph through the system.


Zexia Zhang, Jun Chang, Hongxi Ren, Kaiyuan Fan, Dongmei Li. Snapshot imaging spectrometer based on a microlens array[J]. Chinese Optics Letters, 2019, 17(1): 011101.


 PDF全文
PDF全文

