Photonics Research, 2014, 2 (4): 04000B31, Published Online: Sep. 15, 2014
Serial wavelength division 1 GHz line-scan microscopic imaging  Download: 828次
Figures & Tables
Fig. 1. Experimental setup of the superfast serial wavelength-division line scan imaging system with 1 GHz. AM, amplitude modulator; EDFA, erbium-doped fiber amplifier; BS, beam splitter; PD, photodetector. Inset shows the temporal profile and spectrum of the amplitude-modulated 1 GHz pulse.
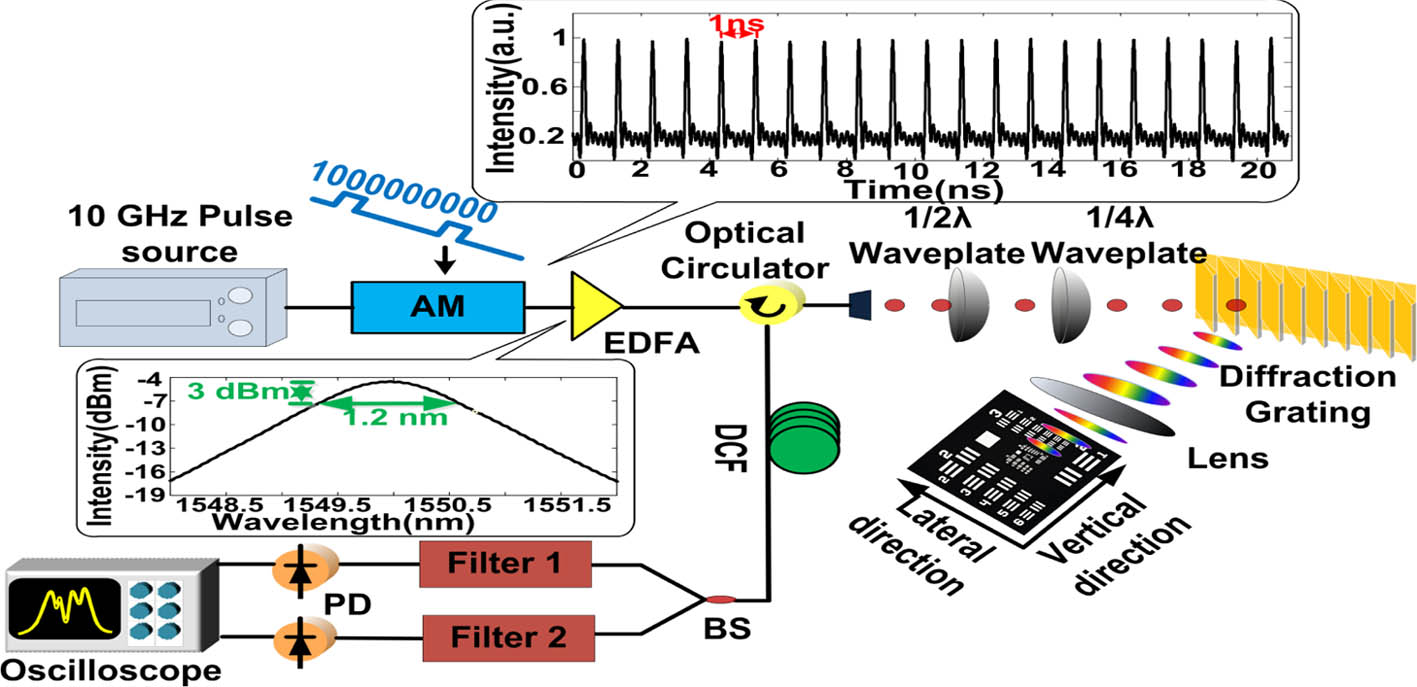
Fig. 2. Principle of this wavelength-division imaging system. Inset shows the wavelength-to-time mapping for a whole pulse and each channel’s information after filters for a single pulse. Here, T represents the period of the mode-locked pulse laser, Z is the temporal width of the dispersed pulse, B is the spectral bandwidth, D is the GVD, and W is the width of pulse filtered from each channel.

Fig. 3. (a) Image of group 4 of a resolution target (USAF-1951), (b) spectrum captured from the red line in (a) measured by an optical spectrum analyzer, and (c) integrated single-shot temporal waveform captured from the red line in (a).

Fig. 4. (a) Temporal waveform encoded with image captured from one channel by filter 1. (b) Waveform captured from the other channel by filter 2. The figure inset shows single-shot frame information. Both channels have no temporal overlap.

Fig. 5. (a) 2D image acquired without wavelength-division and (b) 2D images acquired from two channels after optical filters.

Fig. 6. (a) Reconstructed 2D image with 100 MHz scan rate and (b) reconstructed 2D image with 1 GHz scan rate. It consists of two channels, which can be discerned from the boundary.


Fangjian Xing, Hongwei Chen, Cheng Lei, Zhiliang Weng, Minghua Chen, Sigang Yang, Shizhong Xie. Serial wavelength division 1 GHz line-scan microscopic imaging[J]. Photonics Research, 2014, 2(4): 04000B31.


 PDF全文
PDF全文

