Luminescence of Tb3+/Eu3+ codoped LiYF4 single crystals under UV excitation for white-light LEDs
1 Key Laboratory of Photo-Electronic Materials, Ningbo University, Ningbo 315211, China
2 Ningbo Institute of Materials Technology and Engineering, Chinese Academy of Sciences, Ningbo 315211, China
3 Department of Physics, Dalian Maritime University, Dalian 116026, China
Figures & Tables
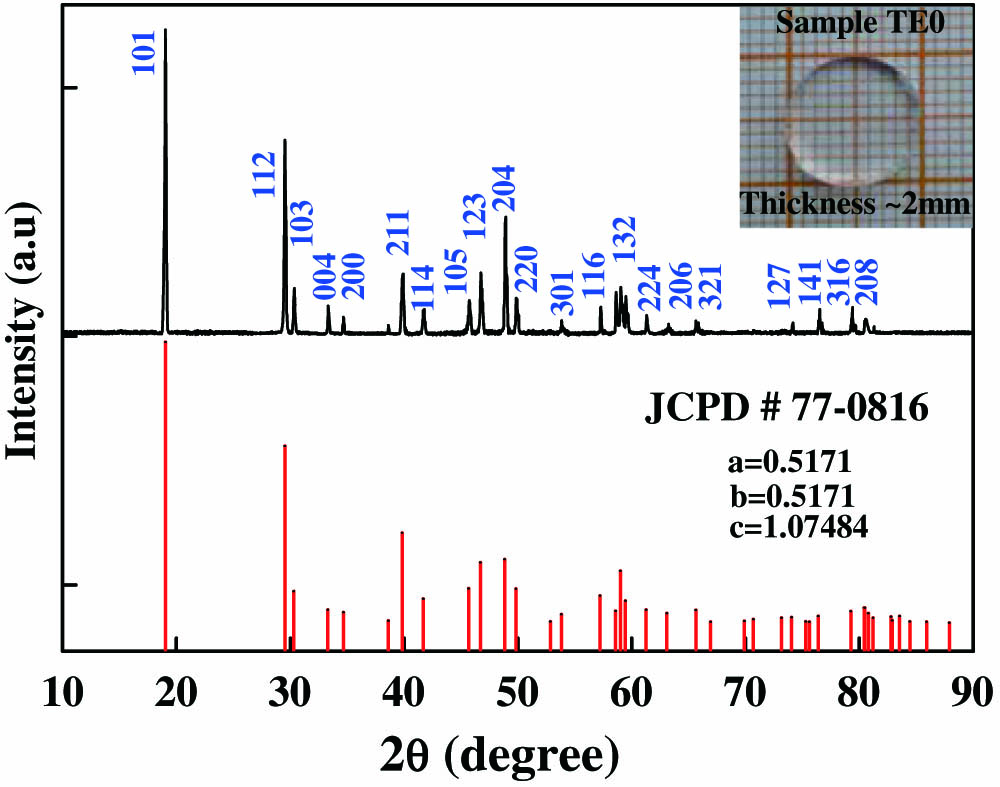
Fig. 1. Powder XRD pattern of Tb3+/Eu3+ co-doped LiYF4 crystal (TE0). The standard pattern of the LiYF4 crystal is shown. Inset, LiYF4 single crystal (TE0).
下载图片 查看原文
Fig. 2. Absorption spectra of Samples T0 and TE0, and the un-doped crystals (marked a, b, and c, respectively).
下载图片 查看原文
Fig. 3. Emission spectra of Samples T0 and TE0 under 374 nm excitation.
下载图片 查看原文
Fig. 4. Excitation spectra of Sample TE0 monitored at 487, 542, and 611 nm wavelengths.
下载图片 查看原文
Fig. 5. Emission spectra of Sample TE0 under various excitation wavelengths (353, 362, 374, and 384 nm).
下载图片 查看原文
Fig. 6. Emission spectra of various Tb3+/Eu3+ co-doped LiYF4 crystals under 384 nm excitation.
下载图片 查看原文
Fig. 7. CIE chromaticity coordinates diagram for Samples TEi (i=0–4) under 384 nm excitation.
下载图片 查看原文
Table1. Concentrations of Tb3+ and Eu3+ Ions in LiYF4 Single Crystalsa
| Symbols | T0 | TE0 | TE1 | TE2 | TE3 | TE4 |
|---|
| Tb | 0.85 | 0.84 | 0.95 | 1.10 | 1.11 | 1.11 | | Eu | 0 | 0.60 | 0.60 | 0.61 | 0.75 | 0.90 |
|
查看原文
Table2. Luminous Parameters of Samples TEia
| | Luminous Parameters |
|---|
| Samples | | (K) | | |
|---|
| TE0 | 0.3130 | 0.3377 | 6441 | 76 | 75 | | TE1 | 0.3027 | 0.3480 | 6904 | 68 | 60 | | TE2 | 0.3051 | 0.3577 | 6713 | 64 | 66 | | TE3 | 0.3120 | 0.3555 | 6399 | 70 | 67 | | TE4 | 0.3242 | 0.3389 | 5878 | 77 | 75 |
|
查看原文
Yongzhang Jiang, Haiping Xia, Shuo Yang, Jiazhong Zhang, Dongsheng Jiang, Cheng Wang, Zhigang Feng, Jian Zhang, Xuemei Gu, Jianli Zhang, Haochuan Jiang, Baojiu Chen. Luminescence of Tb3+/Eu3+ codoped LiYF4 single crystals under UV excitation for white-light LEDs[J]. Chinese Optics Letters, 2015, 13(7): 071601.


 PDF全文
PDF全文

