Chinese Optics Letters, 2018, 16 (10): 103202, Published Online: Oct. 12, 2018   

Pulse shape of ultrashort intense laser reflected from a plasma mirror Download: 1010次

Author Affiliations
1 State Key Laboratory of Surface Physics and Department of Physics, Fudan University, Shanghai 200433, China
2 Key Laboratory for Laser Plasmas (MoE) and School of Physics and Astronomy, Shanghai Jiao Tong University, Shanghai 200240, China
3 Collaborative Innovation Center of IFSA (CICIFSA), Shanghai Jiao Tong University, Shanghai 200240, China
4 SUPA, Department of Physics, University of Strathclyde, Glasgow G4 0NG, United Kingdom
Abstract
The temporal profiles of high-power short-pulse lasers reflected from self-induced plasma mirrors (PMs) were measured with high temporal resolution in the sub-picosecond window. The leading front shape of the laser pulse is found to depend sensitively on the laser fluence on the PM surface. Spectral modulation plays a key role in pulse profile shaping. Our findings will extend our knowledge on properly using PMs.

With the increase of achievable intensity of high-power lasers, the requirement of higher temporal contrast, defined as the intensity ratio of the leading front to the main peak, has been a growing issue in laser–plasma interaction experiments[1,2]. Nanosecond-duration amplified spontaneous emission (ASE) and shorter-duration prepulses are sources of the background noise. The latter could be attributed to the nature of non-Gaussian-distributed optical spectrum and the residual spectral chirp or non-ideal optics in the laser chain. As a robust technique, the plasma mirror (PM) has been routinely used to improve the laser temporal contrast. The initially transparent PM substrate is employed to transmit the ASE and prepulses and to reflect the main pulse when the substrate is ionized to the plasma state. A number of experiments and theoretical work have been performed to understand dynamics of the PM and to assess its performances[35" target="_self" style="display: inline;">–5]. Laser contrasts in the nanosecond and picosecond regimes were normally characterized by comparing the laser temporal profiles between whether the PM is adopted or not. Two orders of magnitude enhancement in the contrast were reported for both temporal regimes. Further improvements were achieved with the cascaded double-PM scheme[6,7].

PM-enhanced higher contrast lasers are superior in laser-driven ion acceleration and have the possibility to explore novel acceleration mechanisms with an ultrathin target, i.e., radiation pressure acceleration (RPA)[8,9], breakout afterburner (BOA)[10]. Recent researches show that multiple mechanisms may dominate over time due to intra-pulse intensity temporal evolution[11,12]. The prepulse-free lasers, with an additional laser pulse serving as a controllable prepulse, offer the opportunity for controlling and optimizing higher-order harmonic generation (HHG)[2,13]. The sensitive dependence of ion acceleration and HHG on the exact laser pulse shape poses severe requirements on well characterization and control of the complete laser temporal profiles. Two theoretical works suggested that the PM could steepen the femtosecond rising front for an ideal (Gaussian-distributed) input laser pulse[6,14]. However, the temporal profile of the laser pulse reflected from the PM in the sub-picosecond regime and its sensitivity to experimental conditions were scarcely investigated experimentally so far[6]. The optimized PM performance was operationally chosen based on measurements of the integrated reflectivity and evaluations of the far-field beam qualities by varying the laser fluences on the PM surface[5]. The pulse duration after employing the PM was thought to be unchanged in analyzing experimental results.

In this Letter, we show that the temporal shape of the laser pulse is sensitively influenced by laser fluence on the PM surface. A cleaner pulse can be produced using smaller laser fluence at the expense of reflectivity. The role of plasma formation close to the main pulse on the pulse shape is discussed. The results will extend our knowledge on proper utility of the PM technique for temporal contrast improvement and applications.

This experiment was carried out using the high-power Ti:sapphire laser at Shanghai Jiao Tong University. The lasers could deliver pulses with energy up to 5 J in 10 Hz and pulse duration of 25fs (full width at half-maximum, FWHM). The schematic of the PM setup and main diagnostics are shown in Fig. 1(a). Using an f/10 off-axis parabola mirror (OAP1), the incident p-polarized beam is focused on the PM to a spot millimeters in diameter at an incident angle of 10°. To minimize the reflection of the ASE and prepulses, anti-reflection (AR) coated BK7 glass is used as a PM, which has an initial reflectivity of less than 0.2% in the range of 740–860 nm. The damage threshold of the coating is about 4J/cm2[6]. After the PM, the specularly reflected divergent beam is recollimated by an identical OAP mirror (OAP2). A high-reflection (HR) dielectric mirror (M1) subsequently reflects the recollimated beam to the target chamber for characterizations or experiments of proton acceleration and HHG. In this work, the laser fluence on the PM, Fpm, is varied from 5J/cm2 to 150J/cm2 by changing the on-surface beam diameter at a fixed laser energy of 1.8 J. A motorized HR dielectric mirror M2 is used to bypass the PM system[15].

Fig. 1. (a) Schematic of the experimental setup. Two identical off-axis parabola mirrors, OAP1 and OAP2, are used to focus and recollimate the laser beam. The laser pulse temporal profiles are measured with SHG-FROG and Sequoia. W1, W2 are wedged fused silica plates, and M1–M4 are HR mirrors. M2 is mounted on a motorized linear stage. PM stands for plasma mirror. (b) The laser contrast measurement in a 60 ps window using Sequoia. The inset is the zoom-in profile from 1 to 0.5 ps. The ‘a’ and ‘b’ correspond to the estimated PM trigger times for laser fluences Fpm of 140.0J/cm2 and 6.5J/cm2, respectively. Example results of (c) retrieved FROG trace and (d) the corresponding Wigner distribution of laser pulse without a PM.

下载图片 查看所有图片

The reflected beam from the PM system is sampled by two 20-mm-diameter pick-up mirrors (M3 and M4) for pulse temporal profile measurements. In the sub-picosecond regime, it is single-shot measured using a frequency-resolved optical gating (FROG, GRENOUILLE, Swamp Optics, LLC.) device. The device is based on second harmonic generation (SHG), having 1.2 fs temporal and 1.3 nm spectral resolutions, respectively. The temporal window is 300 fs. Wedged plates and a 1-mm-thick vacuum window both made of fused silica are used to reduce the laser energy into individual diagnostics and minimize the transmission-induced dispersion and B integral[16]. Due to the time direction ambiguity of the autocorrelation process, two possible pulses for each FROG trace could be retrieved. By positively chirping the pulse via inserting a thick glass plate into the beam path, the leading and falling sides could be distinguished[17]. The temporal profile, i.e., intensity contrast, in the sub-nanosecond domain is measured with a scanning high-dynamic-range third-order cross-correlator (Sequoia, Amplitude Technologies)[18].

The Sequoia measurement results are shown in Fig. 1(b). The initial temporal intensity contrast is better than 108 before 20ps and better than 105 before 1ps. The contrast could be improved up to 1010 at 10ps and 107 at 1ps with the PM. This temporal contrast improvement allows efficient proton acceleration and HHG[13,18]. A close zoom-in profile near the main peak is shown in the inset of Fig. 1(b) for the case without a PM. It provides information of the PM triggering time, for example, ‘a’ and ‘b’ corresponding to Fpm=140.0J/cm2 and Fpm=6.5J/cm2, respectively.

Figure 1(c) is the raw FROG image of the input laser pulse, i.e., without the PM. The FROG trace contains both amplitude and phase information of the laser pulse, thus allowing the pulse profile to be uniquely retrieved. To visually present the intensity profile of the pulse and the instantaneous frequency, the Wigner distribution, which represents photon distribution in time-frequency space for the retrieved pulse shape, is calculated as[17]W(t,ω)=E(t+t/2)E*(tt/2)exp(iωt)dt,where E(t) is the time-varying electric field, ω is the laser frequency, and t is the time lag. The Wigner distribution of a laser pulse without a PM is shown in Fig. 1(d). High-order dispersions are observed. The profiles of the temporal intensity I(t)=W(t,ω)dω and spectrum of the pulse S(ω)=W(t,ω)dt are also plotted. The spectrum is obviously not Gaussian distributed. Two little bulges (‘prepulses’) appear prior to the main peak with relative intensity levels of 5% and 18% to the main peak, respectively. The two prepulses are formed due to the combined effects of high-order residual dispersions and non-Gaussian-distributed laser spectrum.

The multiple pulses may have an impact on the laser–plasma interaction in two folds. The preceding intense pulses may produce a pinching magnetic field to collimate the successive laser-produced fast electrons[19,20]. Spectral enhancement of the laser-accelerated proton beam may be achieved with double pulses[21,22]. On the other hand, prepulse-free lasers are of prime importance for many topics of laser–solid interactions[9,10,23]. The temporal-shaped laser pulse with a sharp front is required to satisfy a near-solid-density short-scalelength plasma[24,25].

The measured laser temporal profiles with respect to Fpm are compared in Fig. 2. Figure 2(a) is analogous to the initial input pulse, i.e., the temporal profile shown in Fig. 1(d). With decreasing Fpm, obvious pulse shaping occurs in the leading front. The level of the prepulses gradually decreases. The prepulses reduce to a single peak for Fpm<23.8J/cm2 [Fig. 2(c)] and vanish eventually for Fpm<6.5J/cm2 [Fig. 2(f)]. The shape and amplitude of the falling edge of the main pulse and postpulse are nearly unchanged. The prepulse suppression as a function of Fpm is easy to understand. When the fluence is high, it is too early to trigger the PM so that the two prepulses are fully reflected by the preformed plasma surface. The earlier formed plasma has equal effects on reflecting the main pulse and prepulses. The later trigger of the reflective PM surface at low fluence allows more leading parts of the laser to transmit. The rough trigger times for the cases of Figs. 2(a) and 2(f) are labelled in the inset of Fig. 1(b).

Fig. 2. Wigner distribution (left axis) and temporal profiles (right axis) of the laser pulse after reflection from the PM with Fpm equal to (a) 140.0J/cm2, (b) 50.0J/cm2, (c) 23.8J/cm2, (d) 14.0J/cm2, (e) 9.2J/cm2, and (f) 6.5J/cm2. The intensity is normalized to the peak value at t=0fs. The shaded area in each plot is due to the shot-to-shot fluctuations.

下载图片 查看所有图片

Though the main peak pulses are similar in Fig. 2, they have measurable changes on the rising edge. It shows slower up-ramp in contradiction to the steepened profile reported before[14]. We should mention that this difference is due to the different initial laser profiles, i.e., ideal Gaussian profile in simulation and complex pulse shape in reality. The duration of the reflected pulse from the PM is quantified with two methods. The FWHM, the most frequently used definition, of the pulse duration is presented in Fig. 3. The initial laser has a TFWHM of 31 fs, which is larger than the best condition (Fourier-transform-limited pulse) due to the uncompensated high-order dispersion. The TFWHM increases with decreasing Fpm. It is essentially the width of the main laser peak pulse in our cases and insensitive to the weak pedestals and prepulses. For the complicated pulse profile, a definition based on the second-order moment, i.e., variance, of the temporal profile is more appropriate[26]. The second moment of the beam temporal profile I(t) could be calculated in the form τ2=(tt0)2I(t)dt/I(t)dt, where t0=t·I(t)dt/I(t)dt. The calculated duration with variance, Tvar=2τ, is also plotted in Fig. 3(a). It shows an opposite trend to TFWHM. This agrees with the fact that the intensity of the pedestals in the leading part of the laser pulse increases with laser fluence on the PM and plays an increasingly important role in Tvar. Note that the integrated reflectivity decreases by a factor of 2 from 70% to 32% when Fpm decreases from 140.0J/cm2 to 6.5J/cm2. To check whether the pulse-duration variation is due to the laser energy loss when reflecting from the PM, the laser pulse was directly measured by the reflecting laser with M2 for different laser energy (i.e., without using the PM). We found that the pulse duration is nearly constant for two-fold variations of laser energy. This indicates that the pulse-duration change is not an instrumental issue.
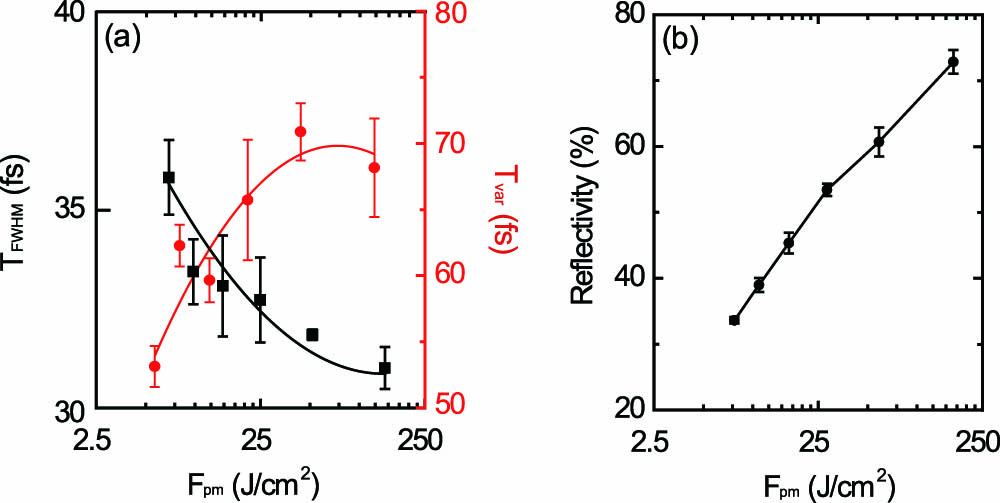
Fig. 3. (a) Pulse durations measured with FWHM (TFWHM) and the second-order moment (Tvar) methods. The solid lines are drawn to guide eyes. (b) Integrated reflectivity of the PM-reflected laser pulse as a function of Fpm.

下载图片 查看所有图片

To understand the pulse shape change, the spectral intensity and phase of PM-reflected laser pulses from the retrieved FROG trace are compared in Figs. 4(a)4(f), which correspond to the same conditions in Figs. 2(a)2(f). Spectral narrowing is observed with decreasing Fpm. Spectral intensity was suppressed at some specific wavelength, e.g., at 775 nm, while the spectral phase has no significant change. The modulations on the laser spectrum could give rise to the pulse shape change and can be explained as follows: the leading front of the laser pulse will ionize the PM surface and get dissipated when its intensity is higher than the ionization threshold of the PM surface. The lower laser fluence results in a later triggering of the PM, and therefore, the more dissipated leading front. Since the rise time of the PM’s reflectivity (the time from triggering the PM to reaching the maximum reflectivity) is about a few hundreds of femtoseconds determined by the time required for ionizing the PM surface to critical density[27,28], significant effects of PM formation on non-ideally compressed pulse reflection are expected. The nonlinear spatio-temporal coupling may also cause the pulse shape change as a result of the beam sampling[6]. This effect is more pronounced for the case when near-field distribution is distorted. The distribution is likely to be deteriorated for high laser fluence. Therefore the spatio-temporal distortion has a negligible effect on pulse-duration change.
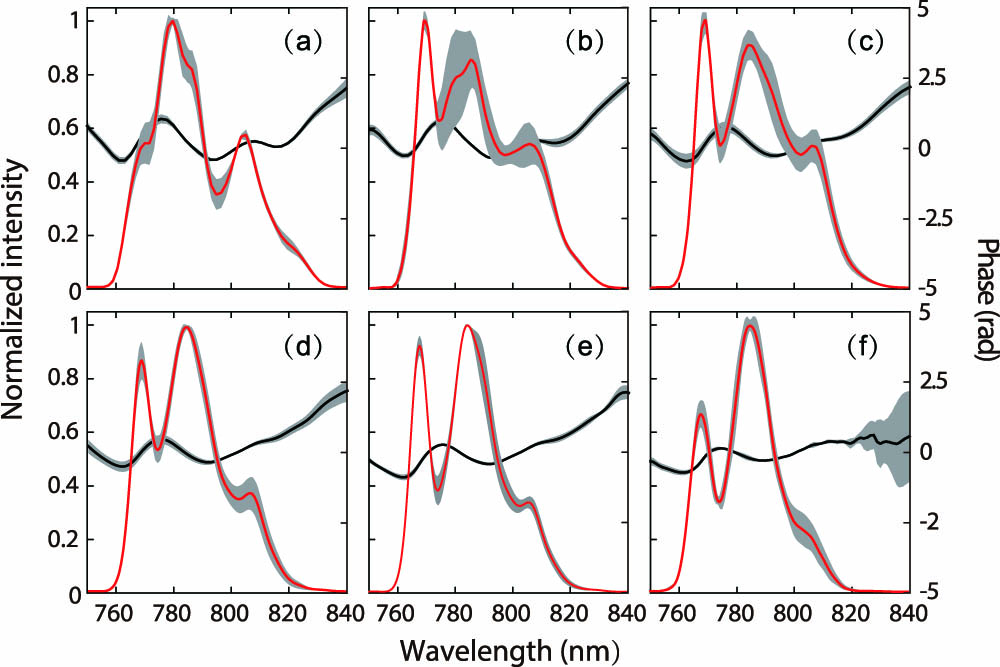
Fig. 4. Retrieved spectral intensity (red line) and phase (black line) of the PM-reflected laser beam with the same laser fluence as in Fig. 2. The shaded area in each plot is due to shot-to-shot fluctuations.

下载图片 查看所有图片

To further understand the spectral modulations presented in Fig. 4, we defined the modulation depth as the ratio of spectral intensity difference after reflection from the PM to the spectral intensity of the incident laser, formulated as Γ=(IreIin)/Iin. Here, Ire and Iin are the spectral intensity of the PM-reflected pulse and the incident pulse, respectively. Figure 5 shows the examples of Γ with Fpm=50.0J/cm2 [Fig. 5(a)] and Fpm=9.2J/cm2 [Fig. 5(b)]. The leading spectral components in time have larger Γ when forming plasma. The group delay t=dϕ/dω, where ϕ is the spectral phase, and ω is the laser frequency, is also compared. The group delay shows complex high-order dispersions, which are usually difficult to be compensated by only tuning the grating compressor. There is no significant change in group delay of the laser pulse with or without PM, as shown by red and a dash line in Fig. 5. The tendency of t is consistent with Γ. The leading components of the spectra interact earlier with the PM substrate and have smaller reflection, which will cause spectrum erosion. This causes the spectral modulations shown in Fig. 4, and the eroded spectrum therefore results in the increase of the pulse duration, as shown in Fig. 3(a). The consistency of Γ with the group delay t implies that the measurement of Γ could be used to infer the laser spectral phase.
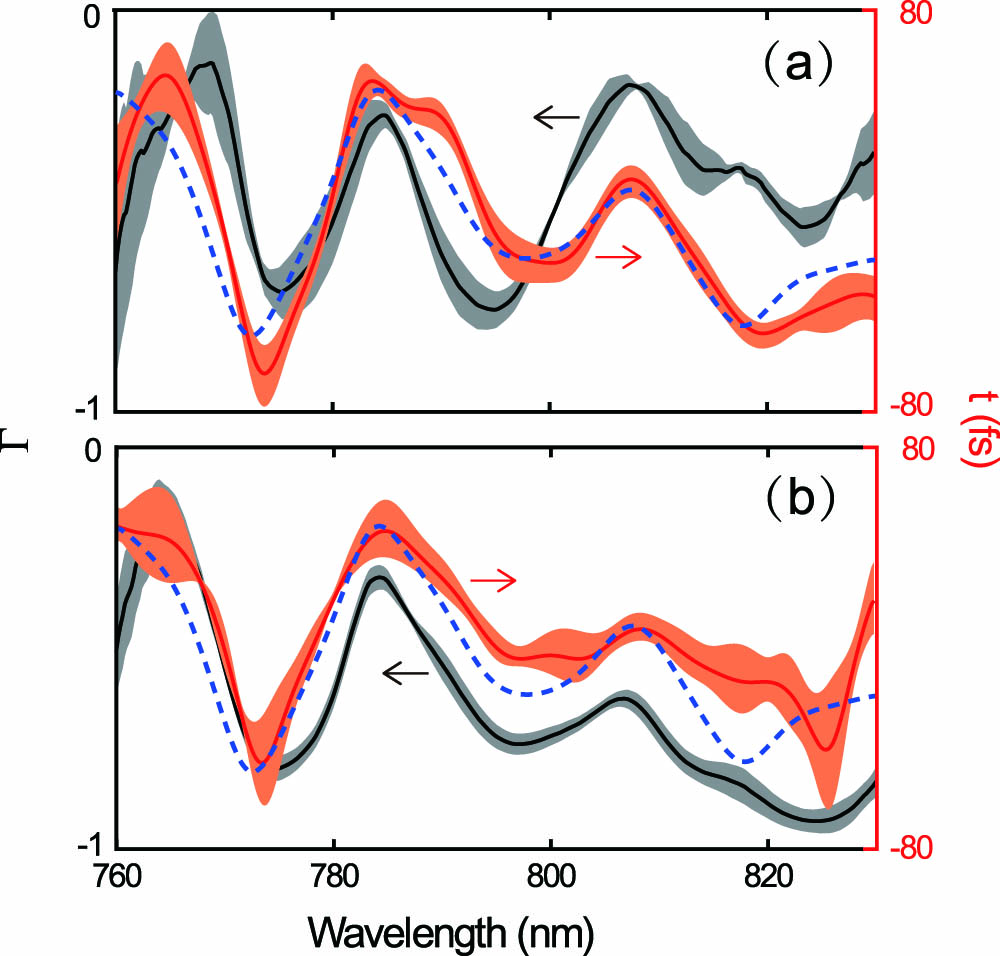
Fig. 5. Modulation depth Γ (black line) and group delay t (red line) for two laser fluence examples of (a) Fpm=50.0J/cm2 and (b) Fpm=9.2J/cm2. The dashed lines are the reference group delays for the laser pulse without a PM. The shaded areas are the standard deviations due to shot-to-shot fluctuations.

下载图片 查看所有图片

In summary, we have measured the temporal profiles of laser pulses after reflection from a self-induced PM in the sub-picosecond temporal window. We find that the prepulses within a few hundred femtoseconds before the main peak could be suppressed by varying the fluence on the PM. The suppression is determined by the group delay of the main pulse. Experimental results suggest that special cares should be taken when non-ideally compressed pulses are used in experiments. Our findings will extend our knowledge on the proper utility of the PM technique for temporal contrast improvement and in applications of laser-driven particle acceleration and radiation source development.

References

[1] NeelyD.FosterP.RobinsonA.LindauF.LundhO.PerssonA.WahlströmC.-G.McKennaP., Appl. Phys. Lett.89, 021502 (2006).APPLAB0003-6951

[2] KahalyS.MonchocéS.VincentiH.DzelzainisT.DromeyB.ZepfM.MartinP.QuéréF., Phys. Rev. Lett.110, 175001 (2013).PRLTAO0031-9007

[3] KapteynH. C.MurnaneM. M.SzokeA.FalconeR. W., Opt. Lett.16, 490 (1991).OPLEDP0146-9592

[4] DoumyG.QuéréF.GobertO.PerdrixM.MartinP.AudebertP.GauthierJ. C.GeindreJ.-P.WittmannT., Phys. Rev. E69, 1539 (2004).

[5] DromeyB.KarS.ZepfM.FosterP., Rev. Sci. Instrum.75, 645 (2004).RSINAK0034-6748

[6] WittmannT.GeindreJ. P.AudebertP.MarjoribanksR. S.RousseauJ. P.BurgyF.DouilletD.LefrouT.PhuocK. T.ChambaretJ. P., Rev. Sci. Instrum.77, 083109 (2006).RSINAK0034-6748

[7] LévyA.CeccottiT.D’OliveiraP.RéauF.PerdrixM.QuéréF.MonotP.BougeardM.LagadecH.MartinP.GeindreJ.-P.AudebertP., Opt. Lett.32, 310 (2007).OPLEDP0146-9592

[8] YanX. Q.LinC.ShengZ. M.GuoZ. Y.LiuB. C.LuY. R.FangJ. X.ChenJ. E., Phys. Rev. Lett.100, 135003 (2008).PRLTAO0031-9007

[9] HenigA.SteinkeS.SchnürerM.SokollikT.HörleinR.KieferD.JungD.SchreiberJ.HegelichB. M.YanX. Q.Meyer-Ter-VehnJ.TajimaT.NicklesP. V.SandnerW.HabsD., Phys. Rev. Lett.103, 245003 (2009).PRLTAO0031-9007

[10] YinL.AlbrightB. J.BowersK. J.JungD.FernándezJ. C.HegelichB. M., Phys. Rev. Lett.107, 045003 (2011).PRLTAO0031-9007

[11] PaddaH.KingM.GrayR. J.PowellH. W.Gonzalez-IzquierdoB.StockhausenL. C.WilsonR.CarrollD. C.DanceR. J.MacLellanD. A.YuanX. H.ButlerN. M. H.CapdessusR.BorghesiM.NeelyD.McKennaP., Phys. Plasmas. 23, 063116 (2016).PHPAEN1070-664X

[12] HigginsonA.GrayR. J.KingM.DanceR. J.WilliamsonS. D. R.ButlerN. M. H.WilsonR.CapdessusR.ArmstrongC.GreenJ. S.HawkesS. J.MartinP.WeiW. Q.MirfayziS. R.YuanX. H.KarS.BorghesiM.ClarkeR. J.NeelyD.McKennaP., Nat. Commun.9, 724 (2018).NCAOBW2041-1723

[13] GaoJ.LiuF.GeX.DengY.ZhangG.FangY.WeiW.YangS.YuanX.ChenM.ShengZ.ZhangJ., Chin. Opt. Lett.15, 081902 (2017).CJOEE31671-7694

[14] BulanovS. S.MacchiA.MaksimchukA.MatsuokaT.NeesJ.PegoraroF., Phys. Plasmas14, 093105 (2007).PHPAEN1070-664X

[15] FangY.GeX.YangS.WeiW.YuT.LiuF.ChenM.LiuJ.YuanX.ShengZ.ZhangJ., Plasma Phys. Control. Fusion58, 075010 (2016).

[16] PalaniyappanS.ShahR. C.JohnsonR.ShimadaT.GautierD. C.LetzringS.JungD.HörleinR.OffermannD. T.FernandezJ. C.HegelichB. M., Rev. Sci. Instrum.81, 10E103 (2010).RSINAK0034-6748

[17] SchreiberJ.BelleiC.ManglesS. P. D.KamperidisC.KneipS.NagelS. R.PalmerC. A. J.RajeevP. P.StreeterM. J. V.NajmudinZ., Phys. Rev. Lett.105, 235003 (2010).PRLTAO0031-9007

[18] GeX.FangY.YangS.WeiW.LiuF.YuanP.MaJ.ZhaoL.YuanX.ZhangJ., Chin. Opt. Lett.16, 013201 (2018).CJOEE31671-7694

[19] RobinsonA. P. L.SherlockM.NorreysP. A., Phys. Rev. Lett.100, 025002 (2008).PRLTAO0031-9007

[20] ScottR. H. H.BeaucourtC.SchlenvoigtH.-P.MarkeyK.LancasterK. L.RidgersC. P.BrennerC. M.PasleyJ.GrayR. J.MusgraveI. O.RobinsonA. P. L.LiK.NotleyM. M.DaviesJ. R.BatonS. D.SantosJ. J.FeugeasJ.-L.NicolaïP.MalkaG.TikhonchukV. T.McKennaP.NeelyD.RoseS. J.NorreysP. A., Phys. Rev. Lett.109, 015001 (2012).PRLTAO0031-9007

[21] MarkeyK.McKennaP.BrennerC. M.CarrollD. C.GüntherM. M.HarresK.KarS.LancasterK.NürnbergF.QuinnM. N.RobinsonA. P. L.RothM.ZepfM.NeelyD., Phys. Rev. Lett.105, 195008 (2010).PRLTAO0031-9007

[22] ScottG. G.BagnoudV.BrabetzC.ClarkeR. J.GreenJ. S.HeathcoteR. I.PowellH. W.ZielbauerB.ArberT. D.McKennaP.NeelyD., New J. Phys.17, 033027 (2015).NJOPFM1367-2630

[23] DromeyB.RykovanovS.YeungM.HörleinR.JungD.GautierD. C.DzelzainisT.KieferD.PalaniyppanS.ShahR.SchreiberJ.RuhlH.FernandezJ. C.LewisC. L. S.ZepfM.HegelichB. M., Nat. Phys.8, 804 (2012).NPAHAX1745-2473

[24] PegoraroF.BulanovS. V., Phys. Rev. Lett.99, 065002 (2007).PRLTAO0031-9007

[25] BulanovS. S.SchroederC. B.EsareyE.LeemansW. P., Phys. Plasmas.19, 093112 (2012).

[26] DielsJ. C.RudolphW., Ultrashort Laser Pulse Phenomena (Elsevier, 2006).

[27] QuéréF.ThauryC.GeindreJ.-P.BonnaudG.MonotP.MartinP., Phys. Rev. Lett.100, 095004 (2008).PRLTAO0031-9007

[28] CaiY.WangW.XiaC.LiuJ.LiuL.WangC.XuY.LengY.LiR.XuZ., Phys. Plasmas16, 103104 (2009).PHPAEN1070-664X

Xulei Ge, Xiaohui Yuan, Yuan Fang, Wenqing Wei, Su Yang, Feng Liu, Min Chen, Li Zhao, Zhengming Sheng, Jie Zhang. Pulse shape of ultrashort intense laser reflected from a plasma mirror[J]. Chinese Optics Letters, 2018, 16(10): 103202.


本文已被 1 篇论文引用
被引统计数据来源于中国光学期刊网
引用该论文: TXT   |   EndNote

相关论文

加载中...

关于本站 Cookie 的使用提示

中国光学期刊网使用基于 cookie 的技术来更好地为您提供各项服务,点击此处了解我们的隐私策略。 如您需继续使用本网站,请您授权我们使用本地 cookie 来保存部分信息。
全站搜索
您最值得信赖的光电行业旗舰网络服务平台!