Photonics Research, 2018, 6 (7): 07000756, Published Online: Jul. 4, 2018
Polarization oscillating beams constructed by copropagating optical frozen waves
Figures & Tables
Fig. 1. Illustration of constructing polarization oscillating beams. (a) Zeroth- and first-order frozen waves that have rectangular and sinusoidal intensity profiles, respectively. The dashed lines denote where the intensity lines come from. (b) Evolution of transverse SoP of a polarization oscillating beam constructed from two sinusoidal frozen waves with opposite spin states and initial phase difference φ 0 = − π / 2
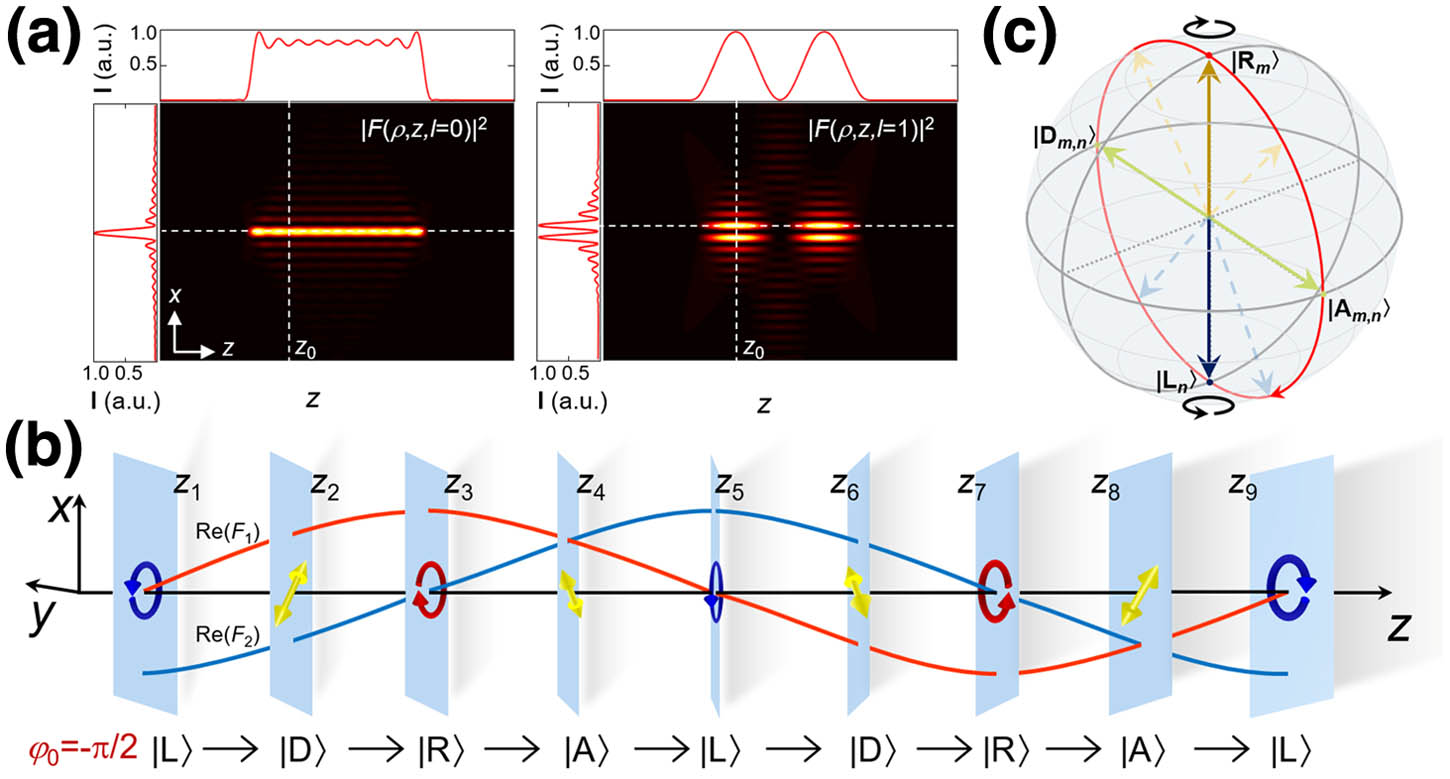
Fig. 2. Experiment setup for constructing polarization oscillating beams. SLM, spatial light modulator; BS, beam splitter; BT, beam terminal; L, lens; F, filter; QWP, quarter-wave plate; G, grating; CCD, charge-coupled device. Insets: (a) computer-generated hologram encoded on SLM; (b) intensity pattern of a first-order frozen wave at a certain location.

Fig. 3. Intensities of constituent zeroth-order frozen waves and transverse SoP distributions of the resultant field at different propagation distances, respectively. The red and cyan ellipses in the bottom diagrams denote the local polarization ellipticity calculated from the measured Stokes parameters [11].

Fig. 4. (a) Longitudinal intensity distributions of two first-order frozen waves (denoted as red dots and black squares) with sinusoidal profiles. Dots, experiment result; curves, analyzed results. (b) Lateral intensity patterns of the synthesized field in equally spaced planes.

Fig. 5. (a), (b) SoP distributions of the | D − 1 , 1 ⟩ | A − 1 , 1 ⟩ S 3

Fig. 6. (a) Intensity pattern of the second-order field at the z = 0


Peng Li, Dongjing Wu, Yi Zhang, Sheng Liu, Yu Li, Shuxia Qi, Jianlin Zhao. Polarization oscillating beams constructed by copropagating optical frozen waves[J]. Photonics Research, 2018, 6(7): 07000756.


 PDF全文
PDF全文

