光学学报, 2020, 40 (15): 1501001, 网络出版: 2020-08-14
转动/振动拉曼激光雷达探测大气压力廓线的方法研究  下载: 1049次
Method for Detecting Atmospheric Pressure Profile Using Rotational and Vibrational Raman Lidar
图 & 表
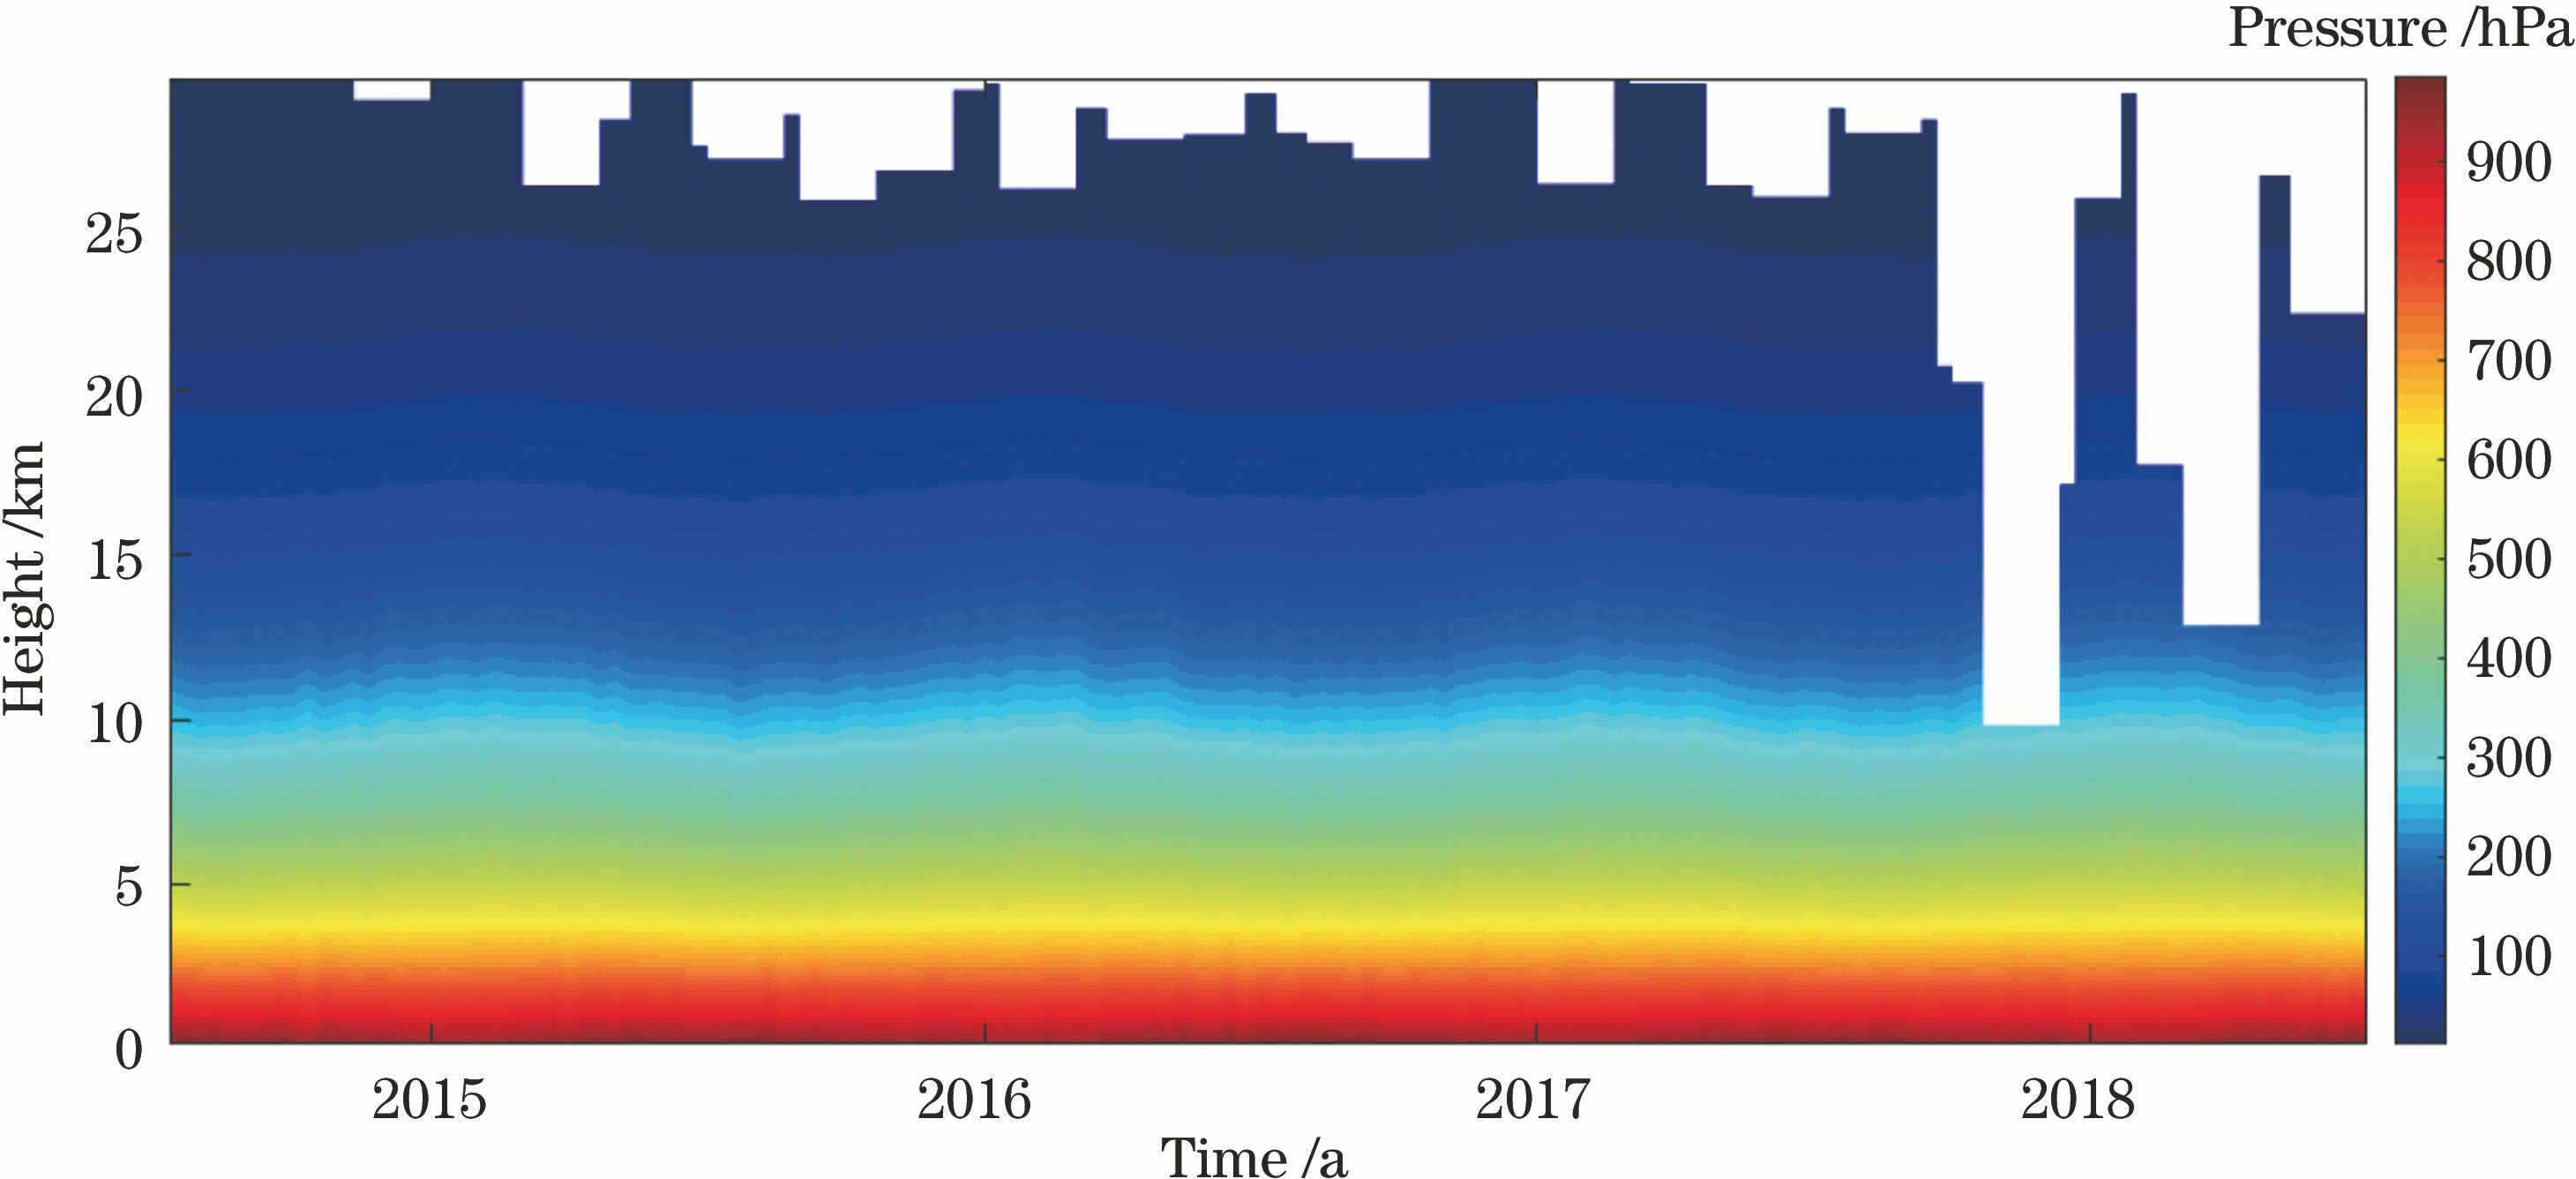
图 2. 西安大气压力廓线。(a) 4年大气压力廓线变化与标准大气模型的比较;(b)大气压力变化幅度随高度变化情况
Fig. 2. Atmospheric pressure profiles over Xian. (a) 4-year atmospheric pressure profiles from sounding balloon and the 1976 US standard atmospheric pressure model; (b) fluctuation of atmospheric pressure with height


图 5. 大气温度廓线和反演出的大气压力廓线。(a)模型温度廓线;(b)大气压力廓线
Fig. 5. Atmospheric temperature and pressure profiles. (a) Temperature profile; (b) pressure profile

图 6. 由探空数据自身反演得出的大气压力误差廓线
Fig. 6. Atmospheric pressure error profile between sounding pressure and the retrieval of sounding temperature

图 7. 由于温度误差引入的大气压力反演误差。(a) 5 K随机误差温度廓线;(b) 5 K随机误差叠加3 K固定偏差的温度廓线;(c)大气压力反演误差廓线
Fig. 7. Pressure inversion error due to temperature error. (a) Temperature profile with 5 K random error; (b) temperature profile with 5 K random error and 3 K fixed error; (c) atmospheric pressure error profile

图 8. 根据实测温度数据误差得到的大气压力廓线反演误差。(a)有偏差的温度廓线1和探空温度廓线;(b)有偏差的温度廓线2和探空温度廓线;(c)两种情况下由温度误差引起的大气压力误差廓线;(d)两种情况下包含温度反演误差和探空自身误差的压力误差廓线
Fig. 8. Errors of atmospheric pressure profile obtained from measured temperature data by lidar. (a) Temperature profile 1 with error 1 and sounding temperature profile; (b) temperature profile 2 with error 2 and sounding temperature profile; (c) atmospheric pressure error profile caused by temperature error in two cases; (d) profile of pressure errors in two cases including temperature inversion error and sounding data error

图 9. 参考点压力偏差引入的大气压力反演误差
Fig. 9. Atmospheric pressure inversion error introduced by reference point pressure deviation

图 10. 比湿与压力反演误差。(a)根据探空数据得到的比湿廓线;(b)比湿引入的压力反演误差
Fig. 10. Specific humidity and pressure inversion error. (a) Specific humidity profile from sounding balloon; (b) pressure inversion error introduced by specific humidity

图 11. 转动拉曼激光雷达反演大气温度、水汽混合比及对应的探空球数据比对结果。(a)距离平方回波信号;(b)温度廓线;(c)水汽混合比廓线
Fig. 11. Comparison of atmospheric temperature, water vapor mixing ratio from lidar and sounding balloon. (a) Range-squared-corrected signal (RSCS); (b) temperature profiles; (c) water vapor mixing ratio profiles

图 12. 激光雷达数据反演到的大气压力廓线及相对应的误差廓线。(a)大气压力廓线;(b)反演误差
Fig. 12. Atmospheric pressure profile retrieved from lidar data and error profile. (a) Atmospheric pressure profile; (b) inversion error profile


表 1拉曼激光雷达系统参数表
Table1. Parameters of Raman lidar system
| |||||||||||||||||||||||||||||||||||||||||||||||||||||||||||||||||||||||||||||||||||||||||||||||||||||
狄慧鸽, 王建宇, 赵煊, 韩堩, 文晓难, 张星琦, 王玉峰, 宋跃辉, 华灯鑫. 转动/振动拉曼激光雷达探测大气压力廓线的方法研究[J]. 光学学报, 2020, 40(15): 1501001. Huige Di, Jianyu Wang, Xuan Zhao, Geng Han, Xiaonan Wen, Xingqi Zhang, Yufeng Wang, Yuehui Song, Dengxin Hua. Method for Detecting Atmospheric Pressure Profile Using Rotational and Vibrational Raman Lidar[J]. Acta Optica Sinica, 2020, 40(15): 1501001.


 PDF全文
PDF全文

