Understanding the effects of radiative preheat and self-emission from shock heating on equation of state measurement at 100s of Mbar using spherically converging shock waves in a NIF hohlraum
1 I. INTRODUCTION
Laboratory measurements of matter at high energy density is of great importance in understanding the structure and evolution of astrophysical objects, such as gas-giant planets, brown dwarfs, and highly evolved stars, where extreme pressures can exceed 100 Mbar and reach well into the Gbar range.
Many experiments
In this paper we look at the two sources of radiation heating for unshocked material and the effect this heating has on the interpretation of Hugoniot measurement. In addition to the x-ray self-emission at the shock front, we also examine the role of the target being preheated by the high-energy kilo-electron-volt x-rays from the hohlraum. We show that preheating is not an issue in low-drive NIF experiments that measure data from 40 to 130 Mbar, but that it can effectively heat targets to several electron-volt, placing the experiment on a slightly different Hugoniot for the high-drive Gbar experiments that measure 100s of Mbar. Our calculations estimate that the self-emission from the shock front limits the pressure that can be measured on the Hugoniot to about 400 Mbar, in the case of plastic, even when the experiment can measure data at up to 800 Mbar.
2 II. Gbar EXPERIMENTAL PLATFORM TO MEASURE HUGONIOT EOS DATA
The Gbar experimental platform is described in more detail in Refs.
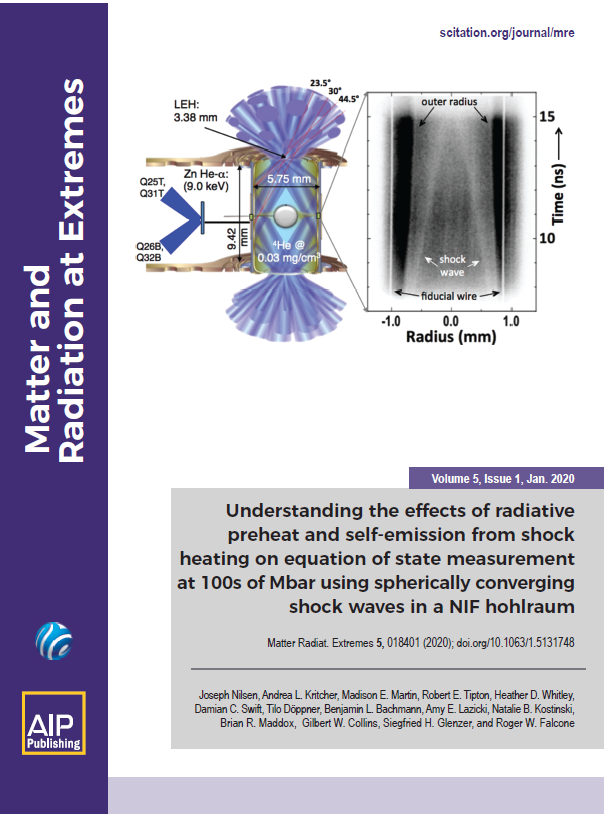
 Schematic of the solid spherical CH target with Ge-doped GDP ablator used in the Gbar experiments. (b) Schematic of the experimental setup. Solid spherical target of CH is shock compressed using a hohlraum radiation drive, then backlit with ∼9 keV Zn He-α x-rays to generate a time-resolved (“streaked”) 1D image of the shock compression vs time. (c) Radiograph for the 9-keV x-ray backlighter vs time and radius, showing the shock wave converging to the central hot-spot. The vertical axis covers 8 ns and the horizontal axis covers a diameter of 0.2 cm. Details of the experiment are in Ref. 5.")
Fig. 1. (a) Schematic of the solid spherical CH target with Ge-doped GDP ablator used in the Gbar experiments. (b) Schematic of the experimental setup. Solid spherical target of CH is shock compressed using a hohlraum radiation drive, then backlit with ∼9 keV Zn He-α x-rays to generate a time-resolved (“streaked”) 1D image of the shock compression vs time. (c) Radiograph for the 9-keV x-ray backlighter vs time and radius, showing the shock wave converging to the central hot-spot. The vertical axis covers 8 ns and the horizontal axis covers a diameter of 0.2 cm. Details of the experiment are in Ref. 5 .
The experiments used a standard NIC scale 5.75 mm hohlraum (diameter = 5.75 mm, height = 9.42 mm) with a 0.03 mg/cc 4He gas fill and 3.375 mm diameter laser entrance hole. The hohlraum was driven by 176, 351-nm laser beams. For the low-drive experiments
3 III. RADIATION HYDRODYNAMIC SIMULATIONS
In this section we present radiation hydrodynamics design simulations to model and understand the EOS measurements using the Gbar platform and the sensitivity of the experiments to radiation preheating and self-emission from the shock front. To simplify the simulations, we changed the material slightly in the modeling to pure polystyrene, CH, at a density of 1.05 g/cc. These simulations were capsule-only simulations that used a frequency-dependent (FDS) radiation source that surrounded the capsule. This drive was derived from integrated hohlraum simulations using a detailed configuration accounting (DCA) atomic physics model.
 comparing the cases for high- (red) and low-drive (blue) Gbar experiments.")
Fig. 2. Simulated radiation temperature vs time inside the radiation cavity (hohlraum) comparing the cases for high- (red) and low-drive (blue) Gbar experiments.
For the low-drive experiment, the simulations predict that the ablation pressure at the boundary of the CH peaks at 41 Mbar at a time of 4.7 ns. The shock continues to travel inwards, slowly increasing as it reaches a radius of 600 μm around 8.85 ns. To understand how to extract Hugoniot data from the simulations we developed a shock-tracking routine that starts at the center of the calculation and looks for the first peak in entropy. This gives us the location of the rising edge of the incoming shock front. We then examine the pressure in adjacent zones and confirm that it does not change by more than 1% from zone to zone, defining this as the location of the shock. We have tried other methods, such as looking for the spatial derivative of the pressure to fall to 1%–3% of its peak value, and have obtained very similar results for the location of the shock front. In

Fig. 3. Pressure at the shock front vs shock radius for low-drive Gbar simulations of a solid CH target. Pressure begins to increase steeply as the shock converges to radii of less than 200 μ m.
Table 1. Pressure at shock front vs time and radius for low-drive Gbar simulation.
|
 and pressure (red) vs the radius of the CH spherical target for the low-drive Gbar simulations at 10.3 and 14.0 ns. At an early time and large radius (solid), the pressure and density peak at the shock front. As the shock converges towards the center (dotted) there is a significant pileup in the density behind the shock.")
Fig. 4. Snapshots of the simulated density (black) and pressure (red) vs the radius of the CH spherical target for the low-drive Gbar simulations at 10.3 and 14.0 ns. At an early time and large radius (solid), the pressure and density peak at the shock front. As the shock converges towards the center (dotted) there is a significant pileup in the density behind the shock.
Reference
Using the shock tracker, we can extract the Hugoniot data from the simulations.

Fig. 5. The solid black line shows pressure vs density for the Hugoniot from the tabular EOS table LEOS 5400. The red curve represents the values of pressure and density extracted from the radiation-hydrodynamic simulations for the low-drive Gbar simulation of a solid CH target. There is excellent agreement, within 0.2%, over the pressure range of 50–130 Mbar.
For a high-drive experiment, the simulations predict that the shock reaches the CH boundary at 3.15 ns, with an ablation pressure of 94 Mbar. The shock continues to travel inwards, beginning to slowly increase, as seen in

Fig. 6. Pressure at the shock front vs shock radius for the high-drive Gbar simulations of a solid CH target. Pressure begins to increase steeply as the shock converges to radii of less than 200 μ m.
Table 2. Pressure at shock front vs time and radius for high-drive Gbar simulation.
|

Fig. 7. The solid black line shows pressure vs density for the Hugoniot from the tabular EOS table LEOS 5400. The dotted lines are the Hugoniot for LEOS 5400, with initial temperatures 1–5 eV, with 1 eV being closest to the solid curve. The red curve represents the values of pressure and density extracted from the radiation-hydrodynamic simulations for the high-drive Gbar simulation of a solid CH target. The simulation initially lies on a preheated Hugoniot between 3 and 4 eV.
To understand the effects of preheating in high-drive experiments we performed a calculation using an equivalent black-body radiation source that had no Au M-shell in the detailed frequency-dependent spectrum. Using the fraction of radiation above 1.9 keV as a metric for M-shell radiation, our frequency-dependent source has 10.4% of radiation above 1.9 keV, while the equivalent black-body source only has 4.9%. While this reduces preheating, it does not eliminate it, as indicated by the blue solid curve in

Fig. 8. The solid black line shows pressure vs density for the Hugoniot from tabular EOS table LEOS 5400. The red curve represents the values of pressure and density extracted from the radiation-hydrodynamic simulations using the full FDS source for the high-drive Gbar simulation of a solid CH target. The blue curve uses an equivalent black-body source to drive the CH target, while the green dotted curve uses the full FDS source but zeroes out the opacity in front of the shock to eliminate the effects of preheating and radiative heating from the shock on unshocked material.
To eliminate both the preheating from the hohlraum and the self-emission from the shock front, we ran a simulation, zeroing out the emission and absorption opacity for the unshocked material in front of the shock, as shown by the green dotted curve in
Based on these calculations, for high-drive Gbar experiments using a PAMS target, we would want to limit our Hugoniot data to a pressure of about 400 Mb, even though the experimental data would attain 650 Mb at a minimum radius of 100 μm. These are estimates, and other models give similar results with slightly different estimates of 450 Mbar for the maximum pressure to use for extracting the Hugoniot data.
To illustrate preheating effects, we examine temperature and density lineouts at 5.0 ns, the time of the peak in the laser drive and preheating in the high-drive simulation. The shock pressure is 145 Mbar.

Fig. 9. Snapshots of the simulated electron temperature vs the radius of the CH spherical target for the high-drive Gbar simulations, when the shock reaches a 744-μ m radius at time 5.0 ns. The red curve is the baseline simulation using the full FDS source, while the black curve is the same simulation with the opacity zeroed out in front of the shock to eliminate radiation heating effects. Radiation heating from the preheating heats unshocked material to temperatures of about 4 eV in front of the shock.

Fig. 10. Snapshots of the simulated density vs the radius of the CH spherical target for the high-drive Gbar simulations when the shock reaches a 744-μ m radius at time 5.0 ns. The red curve is the baseline simulation using the full FDS source, while the black curve is the same simulation with the opacity zeroed out in front of the shock to eliminate radiation heating effects. The density is about 2% lower in the preheated case.
To better understand the challenges in this type of experiment and why the simulations drift to low density from the self-emission, we examine lineouts of the temperature, pressure, and density at a time of 8.8 ns in the high-drive simulation.

Fig. 11. Snapshot of the simulated pressure vs the radius of the CH spherical target for the high-drive Gbar simulations when the shock reaches an 89-μ m radius at time 8.8 ns. The red curve is the baseline simulation using the full FDS source, while the black curve is the same simulation with the opacity zeroed out in front of the shock to eliminate radiation heating effects.

Fig. 12. Snapshots of the simulated electron temperature vs the radius of the CH spherical target for the high-drive Gbar simulations when the shock reaches an 89-μ m radius at time 8.8 ns. The red curve is the baseline simulation using the full FDS source, while the black curve is the same simulation with the opacity zeroed out in front of the shock to eliminate radiation heating effects. Radiation heating from the shock heats the unshocked material to temperatures exceeding 50 eV in front of the shock.

Fig. 13. Snapshots of the simulated density vs the radius of the CH spherical target for the high-drive Gbar simulations when the shock reaches an 89-μ m radius at time 8.8 ns. The red curve is the baseline simulation using the full FDS source, while the black curve is the same simulation with the opacity zeroed out in front of the shock to eliminate radiation heating effects. The density has dropped significantly at the shock front due to radiative heating.
4 IV. CONCLUSIONS
For low-drive Gbar EOS experiments using CH targets, simulations show that the shock front lies nicely on the Hugoniot in the pressure range of 40–130 Mbar, and that the effects of radiation preheating and self-emission from the shock front do not have any significant effect on Hugoniot measurements. Simulations give cause for confidence that the shock front for the converging geometry Gbar EOS experiments is indeed on the Hugoniot. The situation is quite different for high-drive Gbar simulations. In these cases high-energy x-rays from the hohlraum preheat unshocked material and cause the experiment to lie on a preheated Hugoniot, with temperatures near 3–4 eV at early times in the shock convergence. As the shock converges towards the center, the self-emission from the shock front begins to heat unshocked material even more and drives the experiment further off the Hugoniot. Using 5% uncertainty in the experimental measurement of density as a benchmark, we estimate that the effects of self-emission begin to become significant above pressures of 400 Mb.
[1]
[2]
[4] . Probing matter at Gbar pressures at the NIF. High Energy Density Phys., 2014, 10: 27-34.
[7] High drive Gbar experiments are in the process of being analyzed and are not yet published
[12] . Thermophysical properties for shock compressed polystyrene. Phys. Plasmas, 2011, 18: 082707.
[18]
[19]
Article Outline
Joseph Nilsen, Andrea L. Kritcher, Madison E. Martin, Robert E. Tipton, Heather D. Whitley, Damian C. Swift, Tilo Döppner, Benjamin L. Bachmann, Amy E. Lazicki, Natalie B. Kostinski, Brian R. Maddox, Gilbert W. Collins, Siegfried H. Glenzer, Roger W. Falcone. Understanding the effects of radiative preheat and self-emission from shock heating on equation of state measurement at 100s of Mbar using spherically converging shock waves in a NIF hohlraum[J]. Matter and Radiation at Extremes, 2020, 5(1): 018401.


 PDF全文
PDF全文
