Chinese Optics Letters, 2016, 14 (4): 040201, Published Online: Aug. 6, 2018
Two-color cesium magneto-optical trap with a ladder-type atomic system  Download: 1042次
Figures & Tables
Fig. 1. (a) Schematic diagram of the laser beam arrangement for the two-color Cs MOT. The values of σ ± x y z I
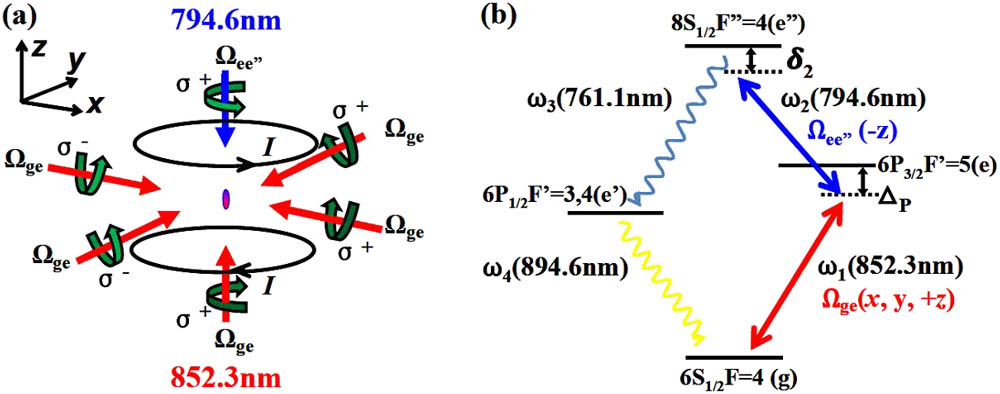
Fig. 2. Peak fluorescence intensity of the trapped atoms versus two-photon frequency detuning δ 2 Δ P = − 10 − 5 MHz ∼ ± 1 MHz δ 2 = − 9 MHz
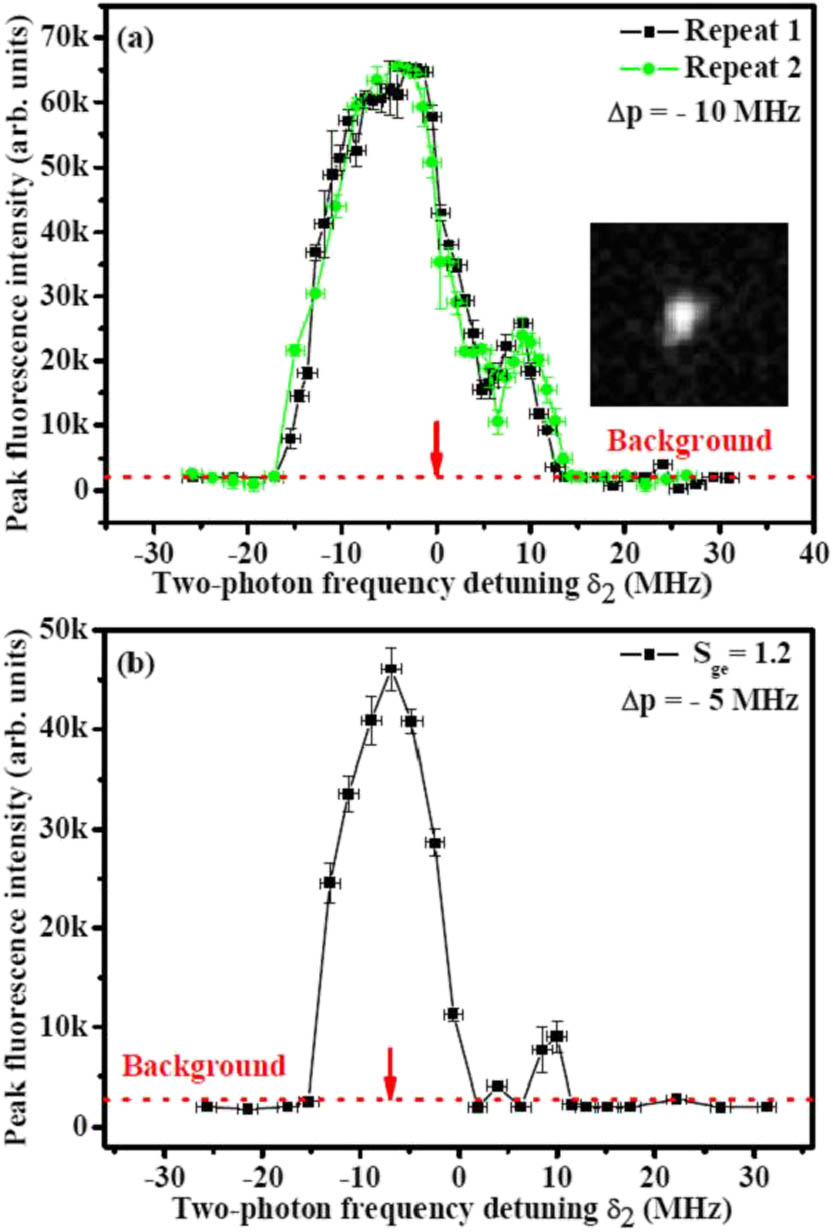
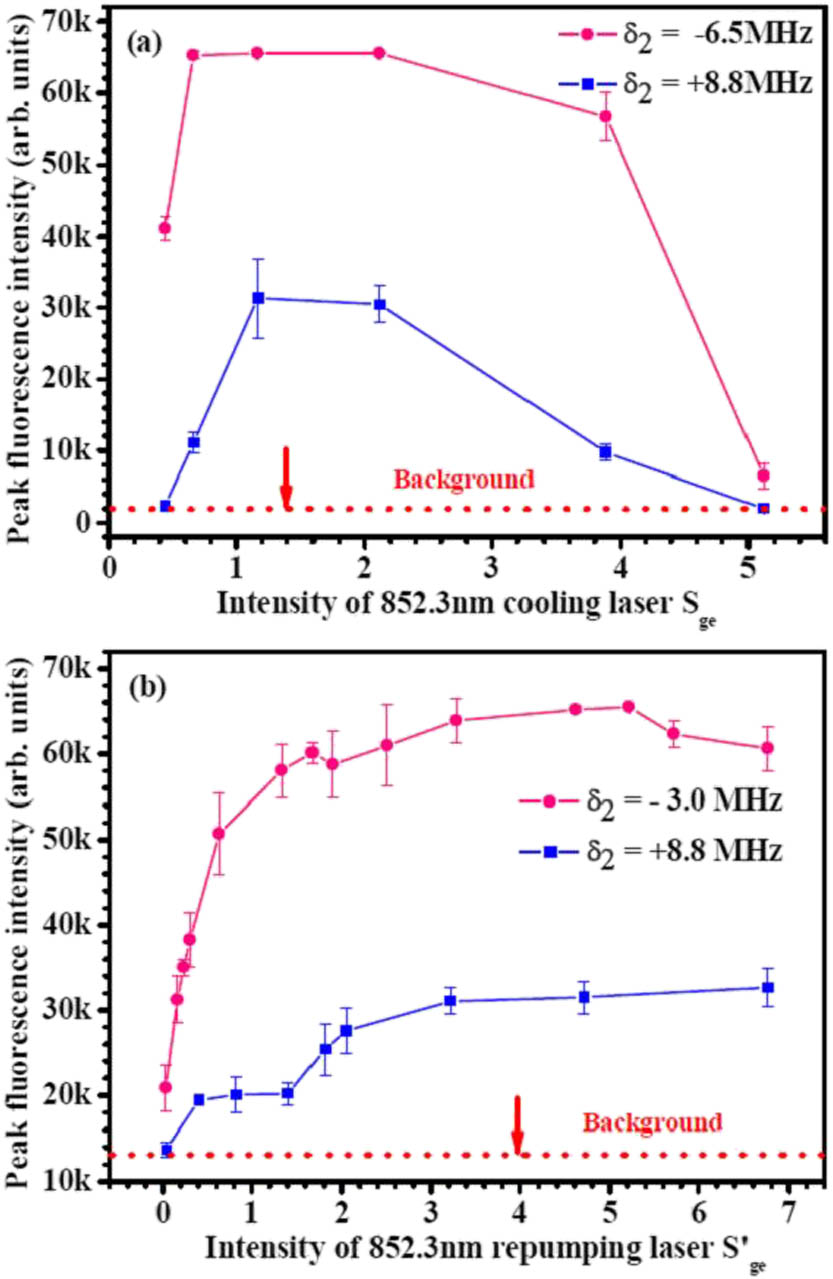
Fig. 3. Peak fluorescence intensity of trapped atoms versus intensity of (a) 852.3 nm cooling laser and (b) repumping laser. The error bars signify the standard deviation of several measurements.
Baodong Yang, Jie Wang, Junmin Wang. Two-color cesium magneto-optical trap with a ladder-type atomic system[J]. Chinese Optics Letters, 2016, 14(4): 040201.


 PDF全文
PDF全文

