High Power Laser Science and Engineering, 2020, 8 (2): 02000e13, Published Online: Apr. 21, 2020
Thermal lens analysis in a diode-pumped 10 Hz 100 mJ Yb:YAG amplifier  Download: 637次
Figures & Tables
Fig. 1. Measured pump profile at the crystal medium plane ($z=l/2$ ) for a pump power of 4 kW, 1 ms.
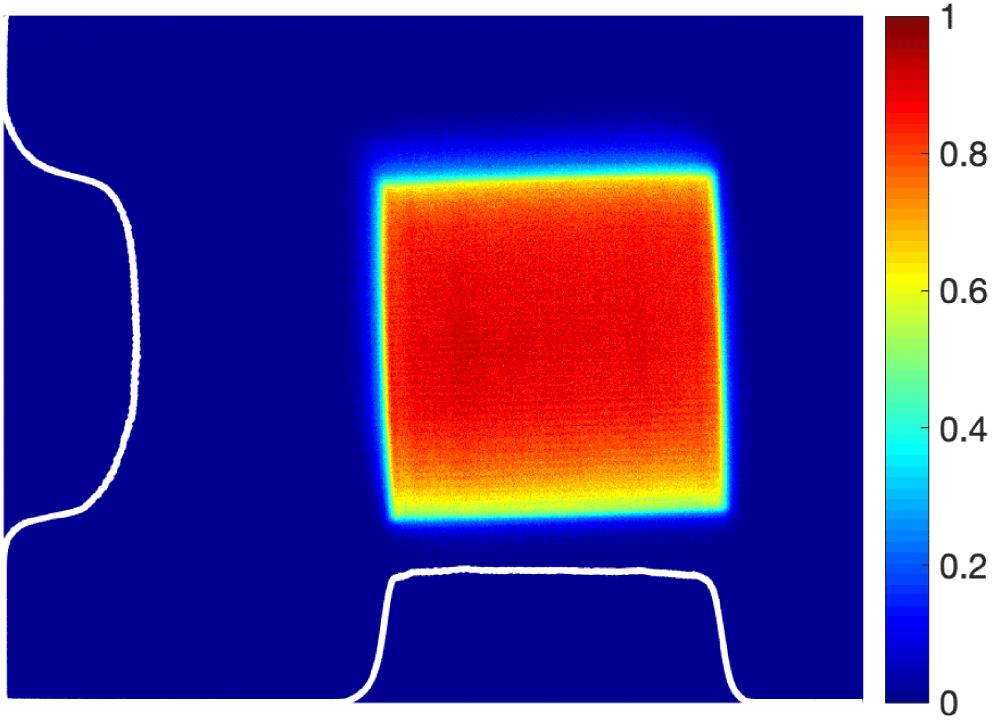
Fig. 2. Temporal evolution of the input face axial temperature ($r=0$ ; $z=0$ ) of a repetitively pumped Yb:YAG crystal. The 1 Hz regime shows a negligible temperature buildup, while for 5 Hz and 10 Hz regimes there is a clear overall temperature offset.

Fig. 3. Temporal evolution of the $z=0$ radial temperature distribution for a 1 Hz repetition rate pump. The time window ranges from 0 to 10 s, when the maximum temperature is reached. Color scale in kelvin. A maximum pump power was assumed (4 kW, 1 ms) delivered in a $w_{p}=1.35~\text{mm}$ waist radius, resulting in a temperature difference of 13.6 K between the edge and the center of the gain medium.

Fig. 4. Temporal evolution of the $z=0$ radial temperature distribution at 10 Hz, 1 ms pump pulse. Color scale in kelvin. (a) Time window corresponding to initial evolution (0–1 s), showing a net increase in the peak temperature. (b) Steady state at nearly constant temperature, with periodic fluctuations. Maximum temperature difference between the center and the coolant is 39.4 K.

Fig. 5. Optical path difference versus radial position inside gain medium for 1 Hz and 10 Hz. Quadratic behavior valid for the pumping region ($r). Significant differences shown for the outer region ($w_{p}).


Fig. 7. Performance of the 8-pass amplifier. A maximum output energy of 100 mJ is achieved on a daily basis. The inset shows corresponding spectra for the main stages of the laser setup.

Fig. 8. Wavefront measurements for the probe beam in units of $\unicode[STIX]{x1D706}$ . (a) Input beam. (b) Residual wavefront after removal of the reference wavefront. (c) Example of a measured wavefront.


Table1. Thermo-optical properties of Yb:YAG.
|
Victor Hariton, Celso Paiva Jo?o, Hugo Pires, Mario Galletti, Gon?alo Figueira. Thermal lens analysis in a diode-pumped 10 Hz 100 mJ Yb:YAG amplifier[J]. High Power Laser Science and Engineering, 2020, 8(2): 02000e13.


 PDF全文
PDF全文

