Chinese Optics Letters, 2015, 13 (4): 041403, Published Online: Sep. 21, 2018
Loss of time-delay signature in a ring of three unidirectionally coupled semiconductor lasers  Download: 844次
Figures & Tables
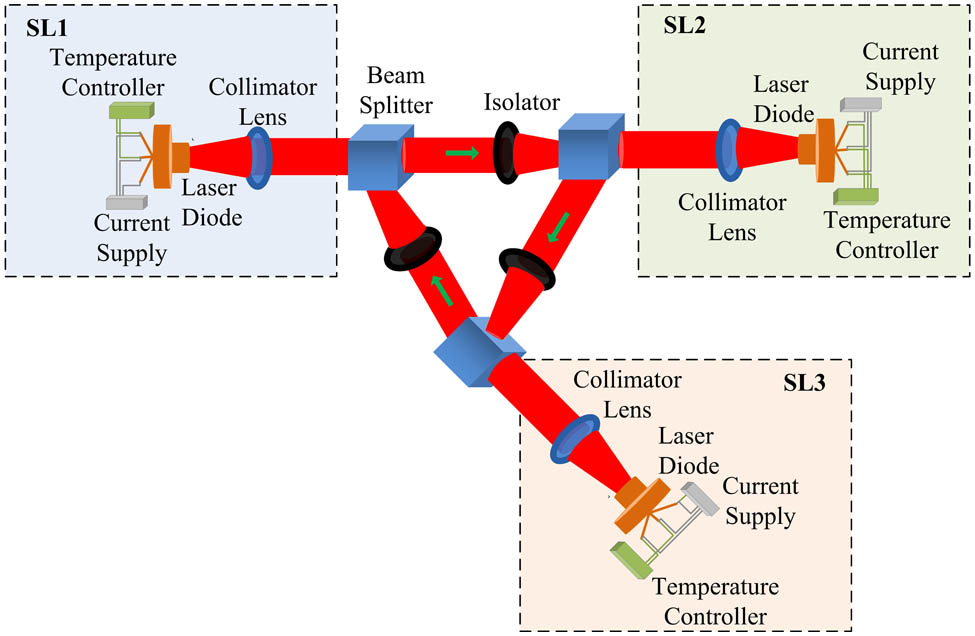
Fig. 2. Intensity time traces (first column), ACF curves (second column), PE (third column). (a1)–(a3) correspond to SL1, (b1)–(b3) correspond to SL2, and (c1)–(c3) correspond to SL3.

Fig. 3. ACF curves evolution (left column) of the intensity time series in the RTUC-SLs when γ ∈ [ 15,150 ] ns − 1 γ = 15 30 80 ns − 1

Fig. 4. The evolution of the ACF curves (left column) of the phase time series in a RTUC-SLs when γ ∈ [ 15,150 ] ns − 1 γ = 15 30 80 ns − 1

Fig. 5. The ACF peak versus γ | E ( t ) | 2 ϕ ( t ) = Arg [ E ( t ) ] Re [ E ( t ) ] Im [ E ( t ) ]


Lei Yang, Wei Pan, Lianshan Yan, Bin Luo, Penghua Mu, Nianqiang Li. Loss of time-delay signature in a ring of three unidirectionally coupled semiconductor lasers[J]. Chinese Optics Letters, 2015, 13(4): 041403.


 PDF全文
PDF全文

