Chinese Optics Letters, 2019, 17 (1): 010602, Published Online: Jan. 17, 2019
Doping radius effects on an erbium-doped fiber amplifier  Download: 545次
Figures & Tables
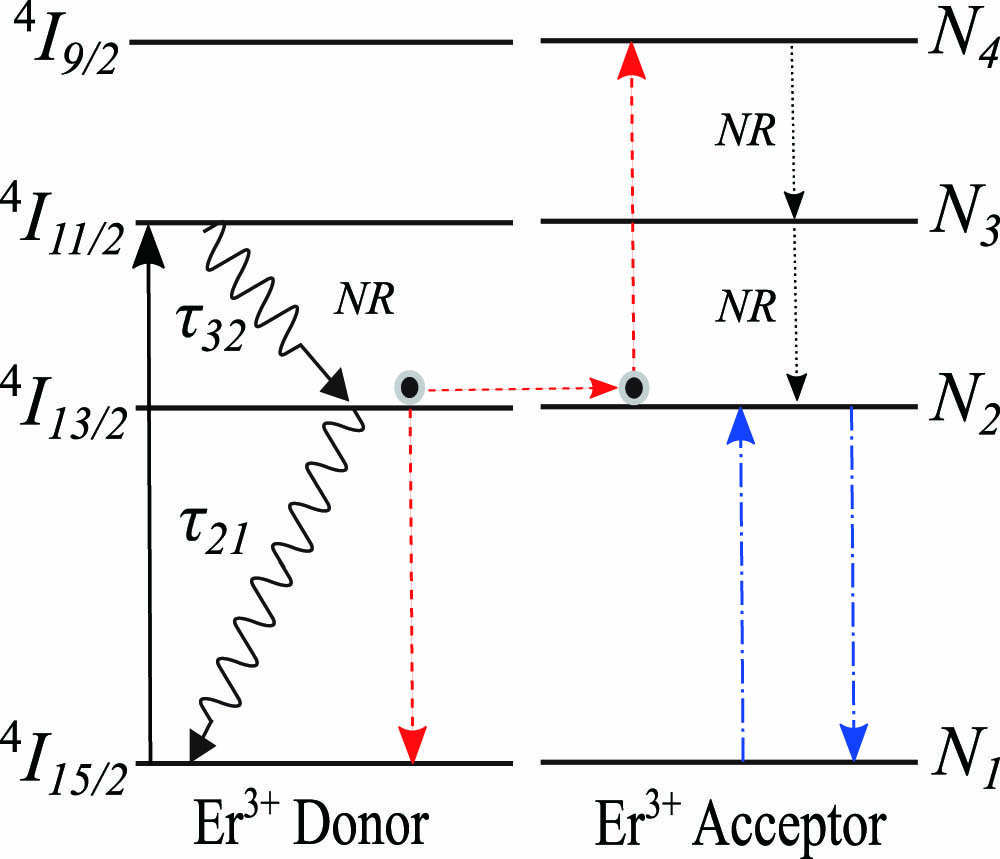
Fig. 1. Energy-level diagram of Er 3 +


Md. Ziaul Amin, Khurram Karim Qureshi, Md. Mahbub Hossain. Doping radius effects on an erbium-doped fiber amplifier[J]. Chinese Optics Letters, 2019, 17(1): 010602.


 PDF全文
PDF全文

