Chinese Optics Letters, 2015, 13 (4): 040402, Published Online: Sep. 21, 2018
Light source system for high-precision flat-field correction and the calibration of an array detector  Download: 1195次
Figures & Tables
Fig. 1. Optical schematic of the calibration source system. The cavity, which is made of a highly reflective material, is filled with a scattering medium.
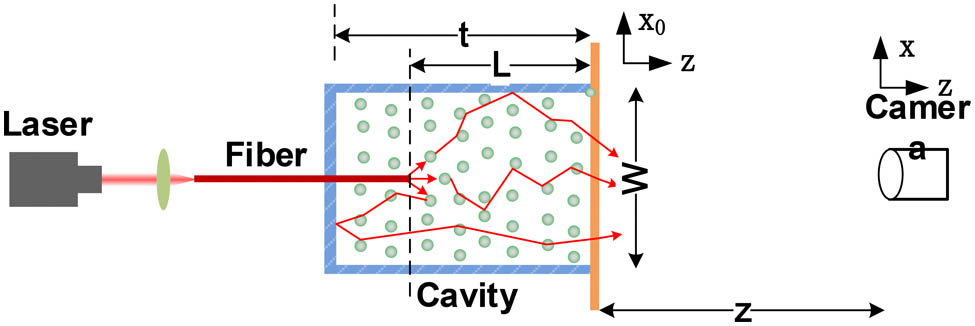
Fig. 2. Values of transmittance (solid line), cavity absorption (dashed line) and medium absorption (dashed–dotted line) as predicted by the Monte Carlo simulation at varying cavity widths. Each curve corresponds to (a) different cavity reflectivities R = 0.90 L = 0.5 cm l * = 100 μm l * = 50 R = 0.98 L L / l * = const

Fig. 3. Values of transmittance (solid line), cavity absorption (dashed line), and medium absorption (dashed–dotted line) versus the cavity length t R = 0.90 l * = 100 μm l * = 25 μm L = 5 mm W = 3 cm

Fig. 4. Flatness of the far field for different extended source sizes W z


Fugui Yang, Qiushi Wang, Ming Li. Light source system for high-precision flat-field correction and the calibration of an array detector[J]. Chinese Optics Letters, 2015, 13(4): 040402.


 PDF全文
PDF全文

