Photonics Research, 2019, 7 (4): 04000464, Published Online: Apr. 11, 2019  

Non-Hermitian degeneracies of internal–external mode pairs in dielectric microdisks

Author Affiliations
1 Institut für Physik, Otto-von-Guericke-Universit?t Magdeburg, Postfach 4120, D-39016 Magdeburg, Germany
2 Institut für Physik, Technische Universit?t Ilmenau, D-98693 Ilmenau, Germany
Abstract
Open quantum and wave systems can exhibit non-Hermitian degeneracies called exceptional points, where both the eigenvalues and the corresponding eigenstates coalesce. Previously, such exceptional points have been investigated in dielectric microcavities in terms of optical modes which are well confined inside the cavity. However, beside these so-called “internal modes” with a relatively high quality factor, there exists another kind of mode called “external modes,” which have a large decay rate and almost zero intensity inside the cavity. In the present paper, we demonstrate the physical significance of the external modes via the occurrence of exceptional points of internal–external mode pairs for transverse electric polarization. Our numerical studies show that these exceptional points can be achieved by either a boundary deformation of the microdisk or by introducing absorption into a circular cavity.

1. INTRODUCTION

Openness is a generic property of realistic quantum and wave systems. Hence, their dynamics is in general described by a non-Hermitian Hamiltonian with complex eigenvalues. An interesting feature of this non-Hermitian physics is the exceptional point (EP) in parameter space where both the eigenvalues (complex frequencies) and the corresponding eigenstates (modes) coalesce [13" target="_self" style="display: inline;">–3]. So far, EPs have been studied both theoretically and experimentally in various research fields such as hydrogen atoms [4], photonic lattices [5], microlasers [6,7], microwave resonators [810" target="_self" style="display: inline;">–10], and optical microcavities [1114" target="_self" style="display: inline;">14]. One of the fascinating applications of EPs is an enhancement of the sensitivity of sensors [1519" target="_self" style="display: inline;">19].

Optical microdisk cavities are ideal model systems to study non-Hermitian physics [20]. In recent years, it was demonstrated that EPs in microcavities can be caused by several mechanisms, e.g., by boundary deformations [12,2124" target="_self" style="display: inline;">24] or external perturbations like nanoscatterers or nanofiber tips [11,13,25]. However, in these studies, the involved modes are always so-called internal modes whose intensity is well confined inside the cavity, resulting in a small decay rate, i.e., a large Q-factor. In the language of formal quantum mechanics, they are called Feshbach resonances [2628" target="_self" style="display: inline;">–28].

Along with the internal modes, there is another class of optical modes known as “external modes,” which have a large decay rate and almost no intensity inside the cavity. The internal and external modes have been classified in previous studies [2830" target="_self" style="display: inline;">–30] according to their behavior in the limit of infinite refractive index n; i.e., in the limit of vanishing openness of the system. In this limit, the external modes remain unbound and are therefore referred to as “shape resonances” [2628]. The internal modes, however, can become bound states with real-valued frequency in this limit.

In spite of the pioneer works proving the interactions between internal and external modes [30], there have been no investigations conceiving the possibility of EPs associated with external modes. Therefore, the aim of this paper is to reveal the existence of such EPs involving internal and external mode pairs. To demonstrate this, we introduce two kinds of systematic perturbations of a circular cavity: (i) a deformation of the cavity’s boundary, and (ii) an absorbing material.

The paper is organized as follows. In Section 2, the optical modes of the dielectric microdisk cavity are briefly explained. In Section 3, a transition between the strong and weak coupling regime in the circular cavity is analyzed. Section 4 demonstrates EPs through the variation of a deformation parameter. In Section 5, absorption is used to generate EPs in the circular cavity. Section 6 summarizes and concludes the paper.

2. MODES IN THE DIELECTRIC MICRODISK

For the convenience of the reader, we repeat some known facts of optical modes in quasi-two-dimensional microdisks [20]. The damped time-harmonic solutions of Maxwell’s equations in the dielectric microdisk cavity with effective refractive index n and Sommerfeld’s outgoing-wave condition at infinity are the optical modes. On the cavity boundary interfacing the homogeneous refractive index regions, the two different polarization fields, transverse magnetic {TM:  Ez(x,y,t)=Re[ψ(x,y)eiωt]} and transverse electric {TE:  Hz(x,y,t)=Re[ψ(x,y)eiωt]}, with resonant frequency ω, satisfy different boundary conditions; νψ (1/n2νψ) is continuous for TM (TE) polarization, while ψ for both polarizations is continuous across the boundary. Here, Ez  (Hz) is the z-component of the electric (magnetic) field and ν is the normal derivative at a given boundary point.

Through the separation of variables in polar coordinates, the optical modes in the circular cavity with radius R are given by a dimensionless frequency kR=ωR/cC (where c is the speed of light in vacuum), which are the solutions of the radial equation [26] where J, J, H, and H are the Bessel function, its derivative, the Hankel function of the first kind, and its derivative, respectively, and η=n (1/n) for TM (TE) polarization. Note that the obtained modes are specified by an azimuthal mode number m [i.e., the order of Bessel functions in Eq. (1)] and a radial mode number l labeling the solutions of Eq. (1) for fixed m. Note also that the modes given by the solutions of Eq. (1) are doubly degenerated for m0 since they are invariant under the change of m and m.

Figure 1 shows the optical modes as the solution of Eq. (1) for TE polarization with refractive index n=3.14. Among the modes in the figure, the internal and external modes are clearly discerned by the imaginary part of the frequency [see Fig. 1(b)]: while the internal modes have small values of |Im(kR)|<1, the external modes have |Im(kR)|>1. In between these two distinct mode groups, we can observe an additional group of special external modes with |Im(kR)|1 existing only for TE polarization. These modes are attributed to the Brewster angle [31,32], and thus we call them Brewster modes with their frequencies kmBR. A perfect transmittance at this Brewster angle (but see [33] for the curved interface correction) results in robust coupling of internal–external modes [30]. In order to take advantage of this coupling, we focus on the TE polarization in the present paper. We emphasize that the radial mode number l should be treated carefully when discerning internal and external modes; while in the former case, l counts the number of maxima of the mode intensity along the radial direction inside the cavity, and l of the external modes has no corresponding physical interpretation [28]. Thus, whenever we specify the mode numbers (l,m), we refer to internal modes.

Fig. 1. (a) Real and (b) imaginary part of scaled frequency kR of the modes in the microdisk obtained by Eq. (1) for TE polarization with n=3.14, as a function of azimuthal mode number m. Dots (·), crosses (+), and open circles (∘) mark internal modes, external modes, and kmBR corresponding to the Brewster angle, respectively.

下载图片 查看所有图片

3. WEAK AND STRONG COUPLING OF MODES IN CIRCULAR CAVITIES

In this section, we consider a circular cavity with a real-valued refractive index n. For the internal modes, nRe(kmR) is approximately constant. Thus, if n changes, the frequency km needs to shift accordingly. Contrarily, the external modes corresponding to the Brewster angle fulfill the relation Re(kmBR)m1+n2 [26,32]. Hence, the derivatives of the frequencies with respect to n read Equations (2a) and (2b) indicate that Re(kmR) of the internal modes decreases more rapidly than Re(kmBR) as n increases. Hence, Re(kmBR) with a fixed azimuthal mode number m successively degenerates with different values of Re(kmR) having higher values of l. We define the degree of degeneracy in terms of the real part of the frequencies: between the modes with frequencies kmBR and kmIR. The latter of these is defined to be the frequency of the internal mode whose real part is the nearest to the real part of the Brewster mode’s frequency for a fixed m. The degenerate points appear as peaks in Fig. 2 that display the degree of degeneracy as a function of refractive index n and m for several values of radial mode number l.

Fig. 2. Degree of degeneracy of mode pairs Re(kmBR) and Re(kmIR) given by Eq. (3) as a function of azimuthal mode number m and refractive index n in the circular cavity. The arrowed curve separates the weak and strong coupling regimes. Δ1 and the color code are in log scale from (black) min=101 to (white) max=105. The refractive index is sampled with 500 points from n=1.5 to n=4.

下载图片 查看所有图片

It is an interesting fact that even in the circular cavity, signatures of an EP can be observed in the parameter space spanned by the real-valued refractive index and the radial mode number l. However, it is important to mention that this EP cannot be reached exactly because l is a discrete variable. Similar to the studies in Refs. [12,21] on deformed cavities, the EP rather manifests in a narrow transition region between the two different coupling regimes: weak and strong coupling.

The weak and strong coupling regimes are readily appreciable through a toy model of a non-Hermitian Hamiltonian where e1,e2C. Here, we assume vR+ and Re(e1)=Re(e2). The eigenvalues of H are E±=(e1+e2)/2±Γ with Γ=[(e1e2)/2]2+v2. If the coupling is sufficiently weak, 2v<|Im(e1e2)|, the eigenvalues are altered only in their imaginary components as E±=(e1+e2)/2±i|Γ| while, if the coupling is sufficiently strong, 2v>|Im(e1e2)|, only the real parts bifurcate as E±=(e1+e2)/2±|Γ| [34]. The former and latter cases are the weak and strong coupling, respectively. At the border in between these two regimes i.e., Γ=0, either the two eigenvalues or the two corresponding eigenvectors become identical [2]. In other words, an EP is the border between the weak and strong coupling regimes. Note that when the decay rates of the coupled modes are similar, i.e., Im(e1)Im(e2), a small coupling is enough to achieve EPs.

In Fig. 2, we can see a changeover from the high to low values of Eq. (3) roughly around n2, which corresponds to a transition from the weak to the strong coupling regime. This transition is more clearly seen in Fig. 3, exemplifying the mode with a fixed azimuthal mode number m=10, in which the strong coupling pair (i,ii) transits to the weak coupling pair (iii,iv) when n increases. This transition of coupling regimes is identified by the radial mode number l; as depicted by the dotted vertical arrows in Fig. 3, the mode number l of kmIR changes from l=3 to 4 when n is increased.

Fig. 3. (a) Real and (b) imaginary part of kR in the circular cavity as a function of refractive index n with a fixed azimuthal mode number m=10 undergoing strong (i, ii) and weak [(iii, iv) and (v, vi)] coupling between k10BR and k10IR with different radial mode numbers l=3, 4, and 5. Solid-black and dashed-orange curves are k10BR and k10IR, respectively. Solid-blue arrows in (a) and (b) guide the trajectory of kmIR for increasing n. Dotted-blue vertical arrows indicate the change of a radial mode number l of kmIR (frequency of the nearest internal mode to the Brewster mode) from 3 to 4. The right panels show intensities |ψ(x,y)|2 of the modes marked by the same labels as in (a) and (b). The white-quarter circular and sky-blue oscillating curves superimposed on the right panels are the cavity boundaries and |ψ(x,0)|2, respectively.

下载图片 查看所有图片

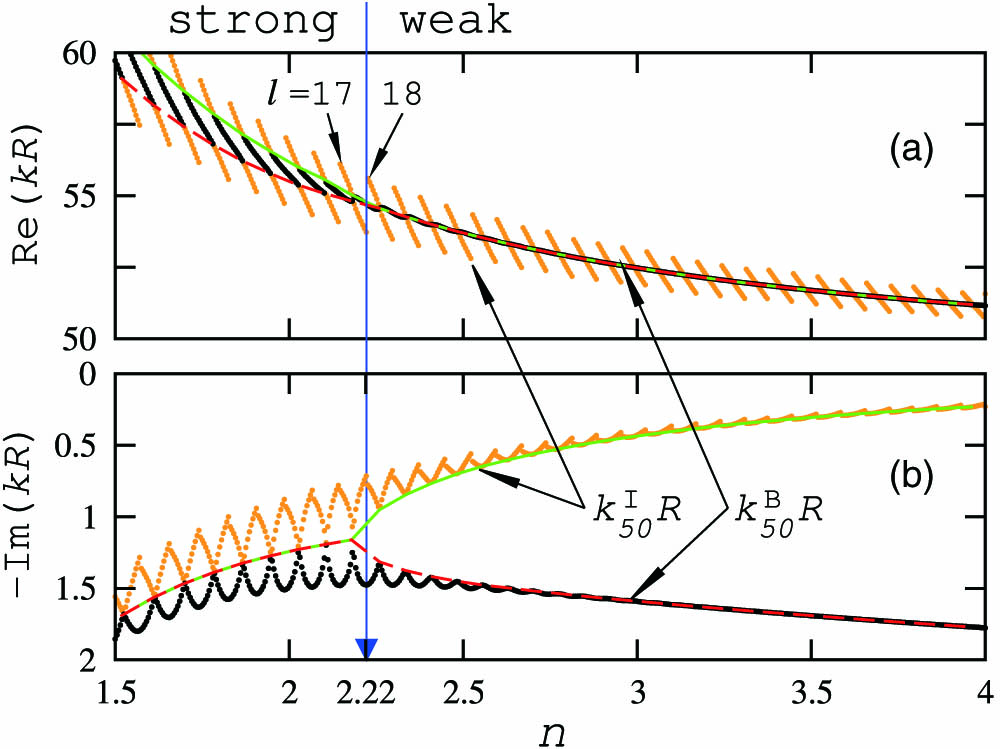
Figure 4 shows the overall structure of kmBR and kmIR as a function of refractive index n for a fixed azimuthal mode number m=50. As predicted by Eqs. (2a) and (2b), Re(k50IR) [e.g., curves l=17, 18 in Fig. 4(a)] decreases more rapidly than Re(k50BR), as shown in Fig. 4(a). Because of this different slope, the radial mode number l of Re(k50IR) increases in turn when n increases: Re(k50IR) with l=17 approaches Re(k50BR) and crosses it as n increases. After the crossing, Re(k50IR) with l=17 moves away from Re(k50BR) while the next Re(k50R) with l=18 approaches Re(k50BR), becoming the new Re(k50IR) as n further increases. This process repeats successively, resulting in many short segmented diagonal curves crossing Re(k50BR) in Fig. 4(a). The transition between the strong and weak coupling becomes more evident when we draw the curve connecting the crossings of either Re(kR) or Im(kR), as shown by the thin-solid-green and thin-dashed-red curves in Fig. 4. Here, the strong coupling with radial mode number l=17 transits to the weak coupling with l=18 at approximately n=2.22, which is the inferred EP of the internal–external mode-coupling pair with azimuthal mode number m=50 in the circular cavity.

Fig. 4. (a) Real and (b) imaginary part of kmBR and kmIR as a function of refractive index n with a fixed azimuthal mode number m=50. The short segmented orange curves with a steeper slope in (a) and upper fluctuating orange curves in (b) belong to k50IR with different radial mode number l. The mode number l increases from left to right. The black curves with the more gentle slope in (a) and the lower fluctuating black curves in (b) belong to k50BR. Two examples l=17 and 18 of the internal mode with frequency k50IR are indicated in (a). Thin solid-green and dashed-red curves connect the values of k50IR and k50BR at which the real or the imaginary part of them crosses. The vertical-blue arrow separates the regions of strong and weak coupling at n2.22.

下载图片 查看所有图片

Up to now, the EPs in the circular cavity, with real-valued refractive index n and radial mode number l, were given in an approximate approach since the transition from weak to strong coupling takes place within the discrete sequences of the local maxima of the degree of degeneracy (see Fig. 2). In the next sections, we obtain EPs by introducing two different kinds of perturbations; boundary deformations and absorption.

4. DEFORMED CAVITY WITH REAL-VALUED REFRACTIVE INDEX

We consider the microflower cavity [35,36] where ε, N, and ρ0(ε)=R(1+ε2/2)1/2 are the dimensionless deformation strength, shape factor, and normalization coefficient fixing the cavity area to πR2, respectively. For ε=0, the cavity is circular with radius R, while for ε0, the cavity boundary has N maxima and N minima along the azimuthal angle θ[0,2π). Figure 5 shows an example of the cavity with ε=0.1 and N=20. For the numerical computation of the modes in this deformed cavity, we use the boundary element method [37].

Since our goal is to efficiently couple the Brewster mode with frequency kmBR and the internal mode with kmIR for the same azimuthal mode number m, we choose the boundary to have all its concave parts at the locations where the mode intensities on the boundary have their maximum values (see, e.g., [35,38]). This can be done by setting N=2m. For example, N=20 corresponds to m=10 in Fig. 5. Under this deformation, the even-symmetric mode [ψ(y)=ψ(y)] for positive deformation parameter (ε>0) is equivalent to the odd-symmetric mode [ψ(y)=ψ(y)] for negative deformation parameter (ε<0). In the present paper, we fix the modes to be even-symmetric so that when ε<0, the Q-factor of the internal modes is spoiled, leading to large values of the decay rate |Im(kR)| that come close to the decay rate of the external modes. This indicates that a tiny coupling might be enough to couple internal and external modes as predicted by Eq. (5).
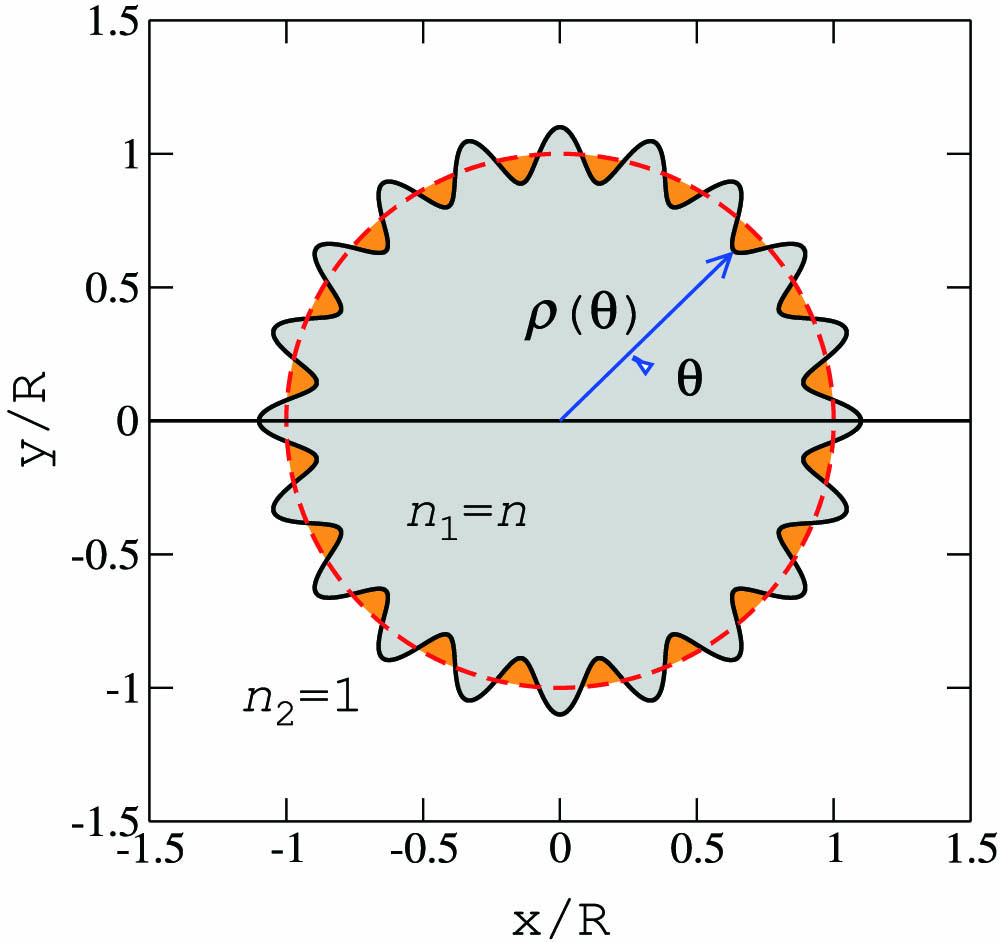
Fig. 5. Illustration of the cavity boundary in Eq. (6) with ε=0.1 and N=20. The gray shaded region bounded by the corrugated black curve depicts the deformed cavity, while the region bounded by the dashed red curve is the undeformed circle (ε=0). n1 and n2 are the refractive indices of the interior and exterior of the cavity, respectively.

下载图片 查看所有图片

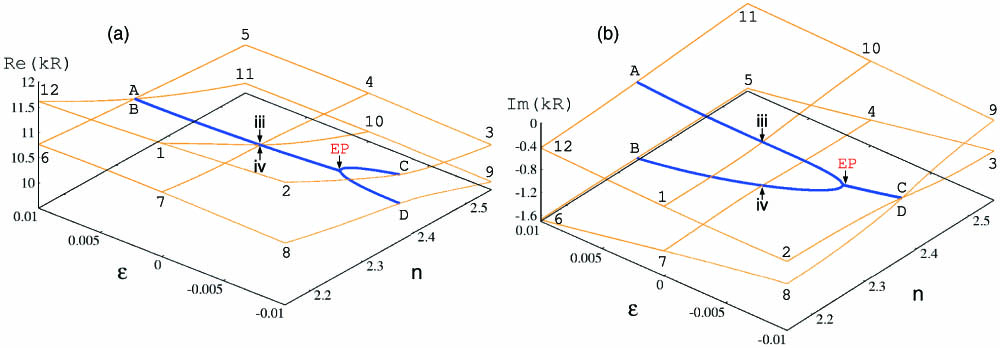
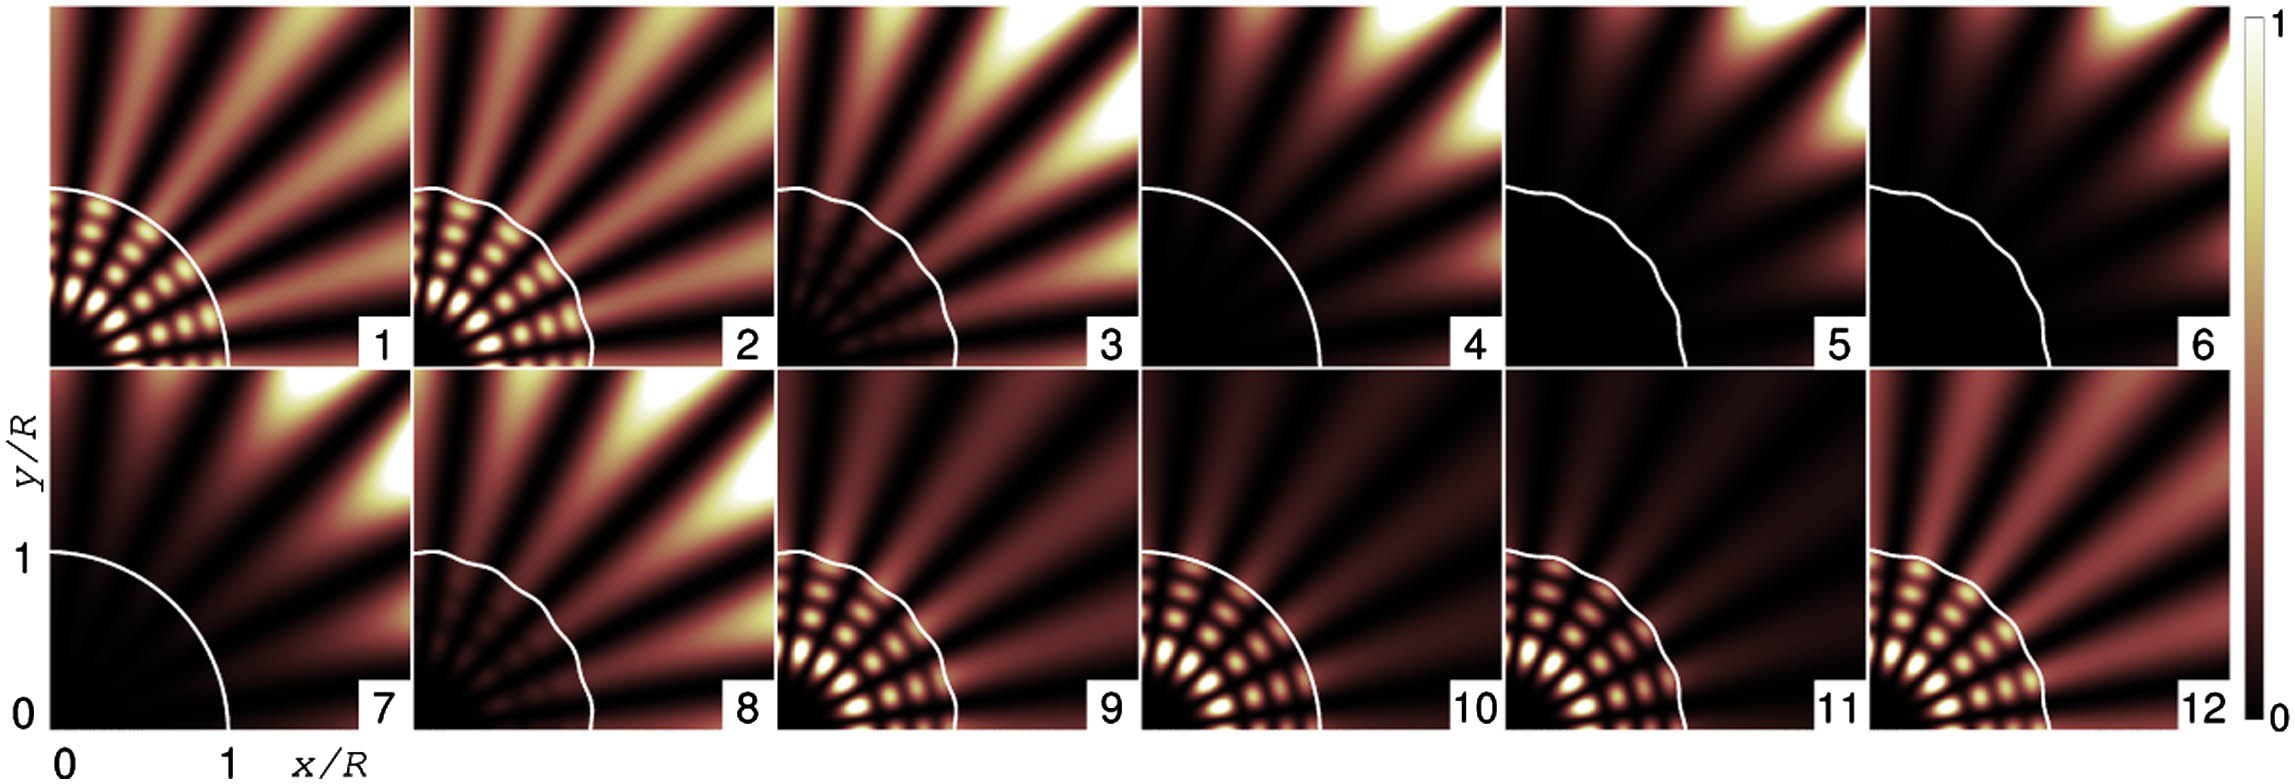
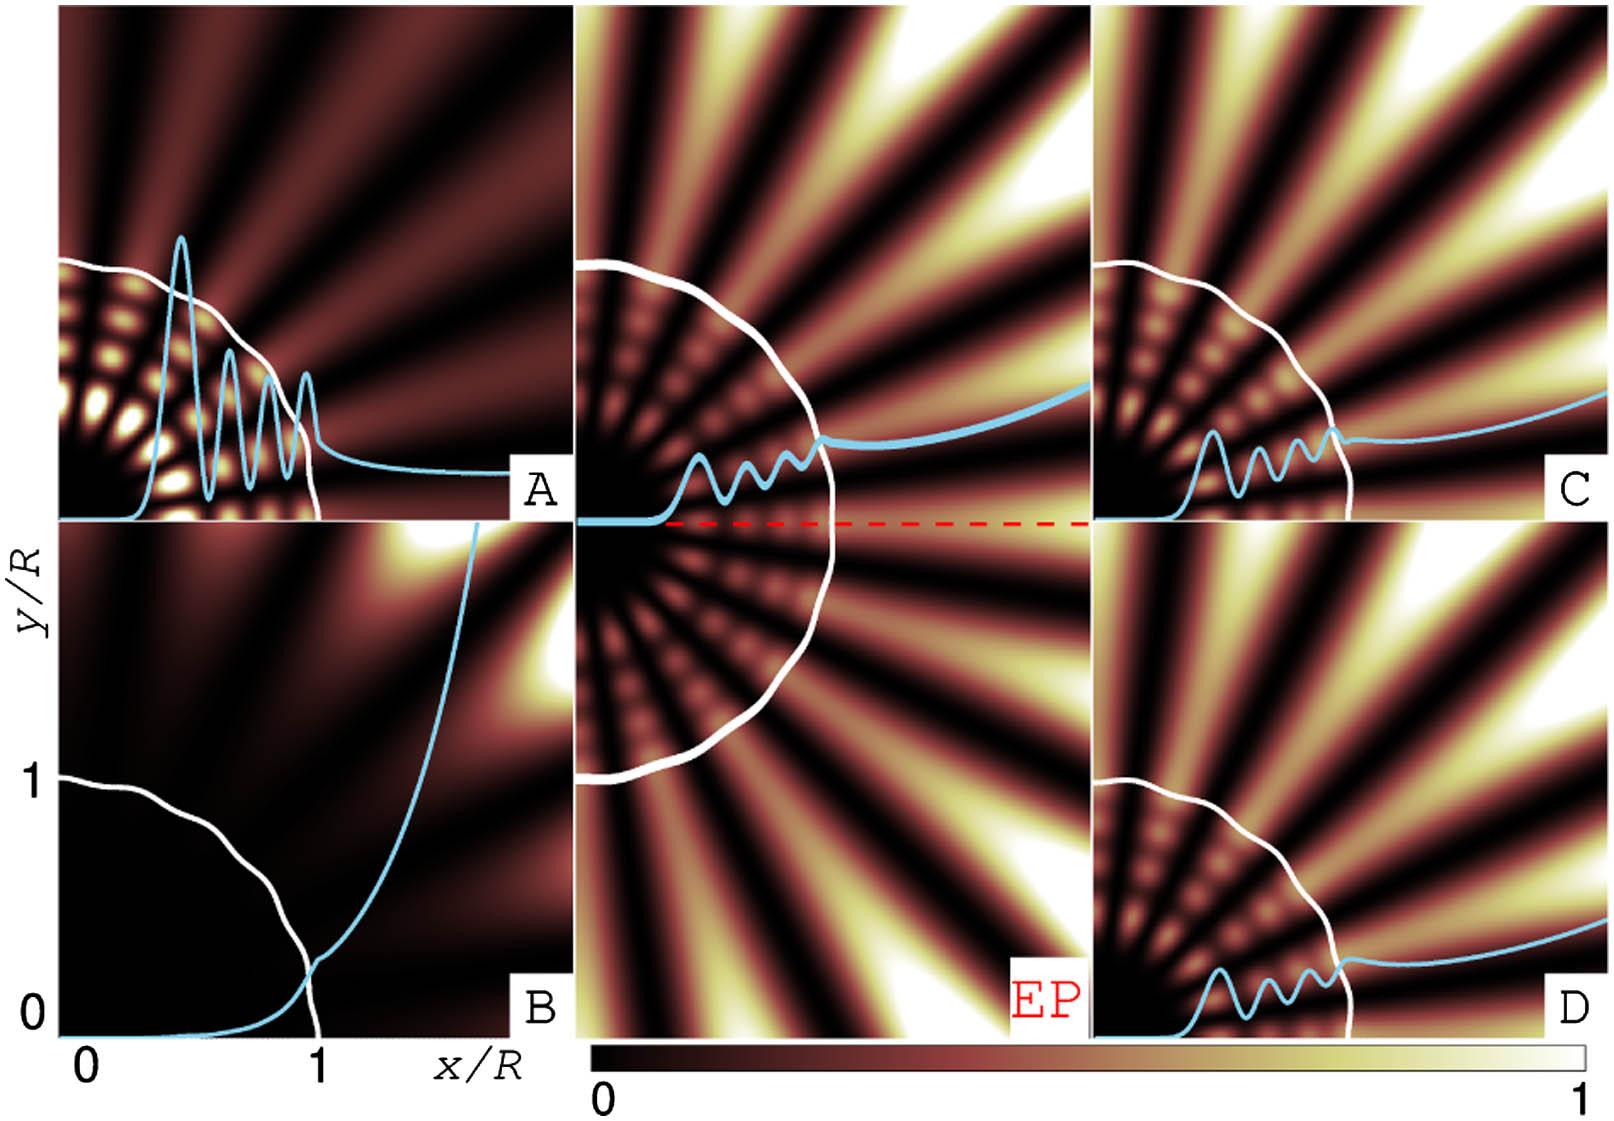
We calculate kmB(n,ε)R and kmI(n,ε)R in the vicinity of the local maximum values of the degree of degeneracy [Eq. (3)]. Figure 6 shows the resulting topology near the EP corresponding to the square-root Riemann-surface characteristic for a second-order EP. Note that at the point (iii,iv) (i.e., in the circular cavity) the modes undergo weak coupling. Figures 7 and 8 show the intensity patterns |ψ|2 for the modes marked by the same labels as in Fig. 6. Following the numbers in the figure explores the trajectory in the parameter space circulating the EP. As is well known, the EP has to be encircled four times in total to recover the original phase of the mode (not shown) [8].

Fig. 6. (a) Real and (b) imaginary part of the frequencies kR of the modes in the microflower cavity as a function of deformation parameter ε and refractive index n with fixed (l,m)=(4,10). Note that ε decreases from left to right. Labels iii and iv are the same as in Fig. 3. Orange curves connecting the points marked by numbers from 1 to 12 show the Riemann surface topology around the EP. Blue curves are the branch-cut in Eq. (7).

下载图片 查看所有图片

Fig. 7. Intensity mode pattern |ψ(x,y)|2 in the microflower cavity corresponding to the marked points in Fig. 6 with the same labels. The white circular and corrugated curves are the cavity boundaries.
下载图片 查看所有图片

Fig. 8. Intensity mode pattern |ψ(x,y)|2 in the microflower cavity corresponding to the marked points in Fig. 6 with the same labels. The white corrugated circular and sky-blue oscillating curves, superimposed on the figures, are the cavity boundaries and |ψ(x,0)|2, respectively. The red dashed horizontal line in the middle panel is the x axis.

下载图片 查看所有图片

In order to ascertain EPs embedded in the Riemann surface in Fig. 6, we first identify the branch-cut [39] curve on which the EP is located. Here, the branch-cut, is a continuation of the degenerated Re(kR) curves in the weak-coupling region and the degenerated Im(kR) curves in the strong-coupling region, which are not a straight line in parameter space. We found that a quadratic relation n=α(εβ)2+γ fits the parameters for the branch-cut curves in our investigations very well. The real-valued constants (α,β,γ) can be obtained by inserting three sampled parameter values (n,ε) of the crossing points in the Riemann surface, e.g., in Fig. 6, (A, B) and (iii, iv) of Re(kR) and (C, D) of Im(kR), into this quadratic relation.

The general existence of the EPs of internal and external modes is exemplified in Fig. 9. The EPs (nm,lEP,εm,lEP)=[α(εm,lEPβ)2+γ,εm,lEP] in the figure are obtained by the constants (α,β,γ)=(172.35,0.0041,2.078), (132.25,0.0067,2.334), and (77.44,0.01,2.42) for the modes (l,m)=(4,12), (4, 10), and (3, 7), respectively. Note that the EP formed from an external–internal mode pair can occur for rather weak boundary deformations, and is accompanied by a large Q-spoiling of the internal mode. This might be advantageous for applications where a particular internal mode needs to be discriminated.
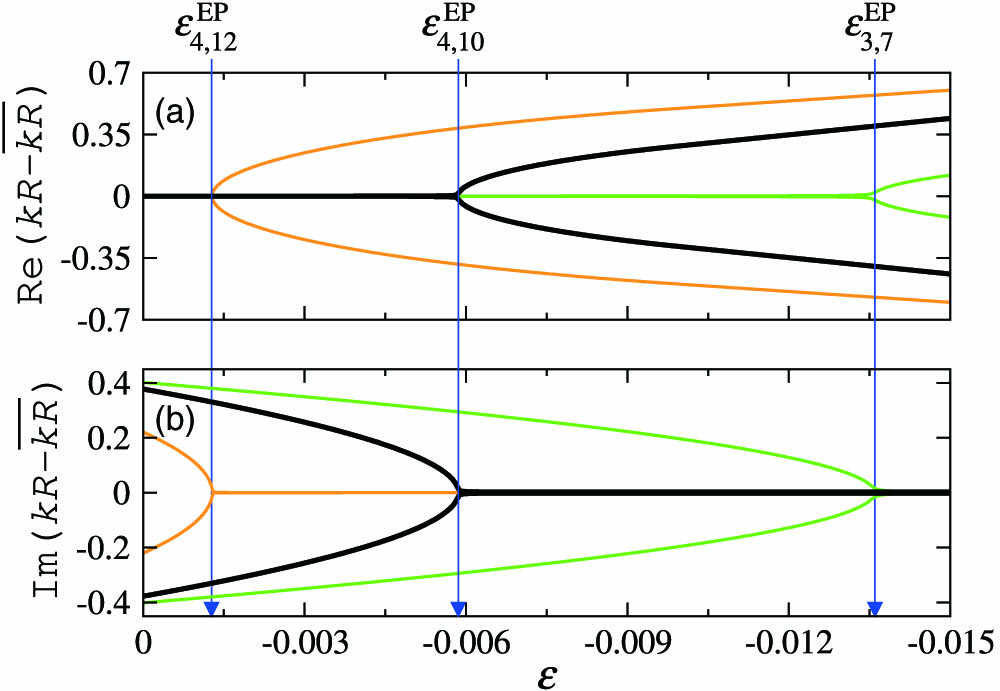
Fig. 9. (a) Real and (b) imaginary part of the frequency relative to kR¯=(kmBR+kmIR)/2 of the selected internal and external modes’ frequencies kR as a function of deformation parameter ε. The EPs marked by vertical arrows are at εl,mEP=0.00127, 0.00582, and 0.0136 for the modes (l,m)=(4,12), (4,10), and (3,7), respectively.

下载图片 查看所有图片

5. CIRCULAR CAVITY WITH COMPLEX-VALUED REFRACTIVE INDEX

In the previous section, internal and external modes are tuned to cause an EP using a deformation of the cavity’s boundary. A crucial effect of such a deformation is the Q-factor spoiling of the internal mode such that it can couple efficiently to the external mode. In this section, we propose an alternative way to couple internal and external modes in a circular cavity: namely, by introducing an imaginary part of the refractive index inside the cavity. Outside of the cavity, the refractive index is still assumed to be 1. Therefore, the imaginary part of nC can be regarded here as a uniform absorption in the cavity contributing to the effective refractive index.

In the following, we explain the scheme to derive an EP using a complex refractive index in detail. We consider as an example the internal mode (l,m)=(4,12) and an external mode with the same m deep in the complex kR plane. Based on this preparation, first, we tune the refractive index along the real axis to n3.116606, where both considered modes have the same real part of kR as kIR=8.8698930.003494i (i1, cross in Fig. 10) and kEXR=8.8698934.393046i (i2, empty circle in Fig. 10), respectively. Note that they are still distinguished by a large difference in Im(kR). Starting from this point, we increase the imaginary part of the refractive index and follow the curve in the complex n-plane, where both modes have the same Re(kR) (see orange solid and blue dashed curves in Fig. 10). At nEP2.506950+1.134904i a point is reached where also Im(kR) of the modes coalesce. This marks the (black dot) EP in Fig. 10. Tracing the modes further along a parameter curve at which the same Im(kR) is shared, we can observe a branching behavior of Re(kR) in Fig. 10. In the vicinity of the EP, the two characteristic Riemann sheets of a complex square root topology are obtained as shown in Figs. 10(c) and 10(d).
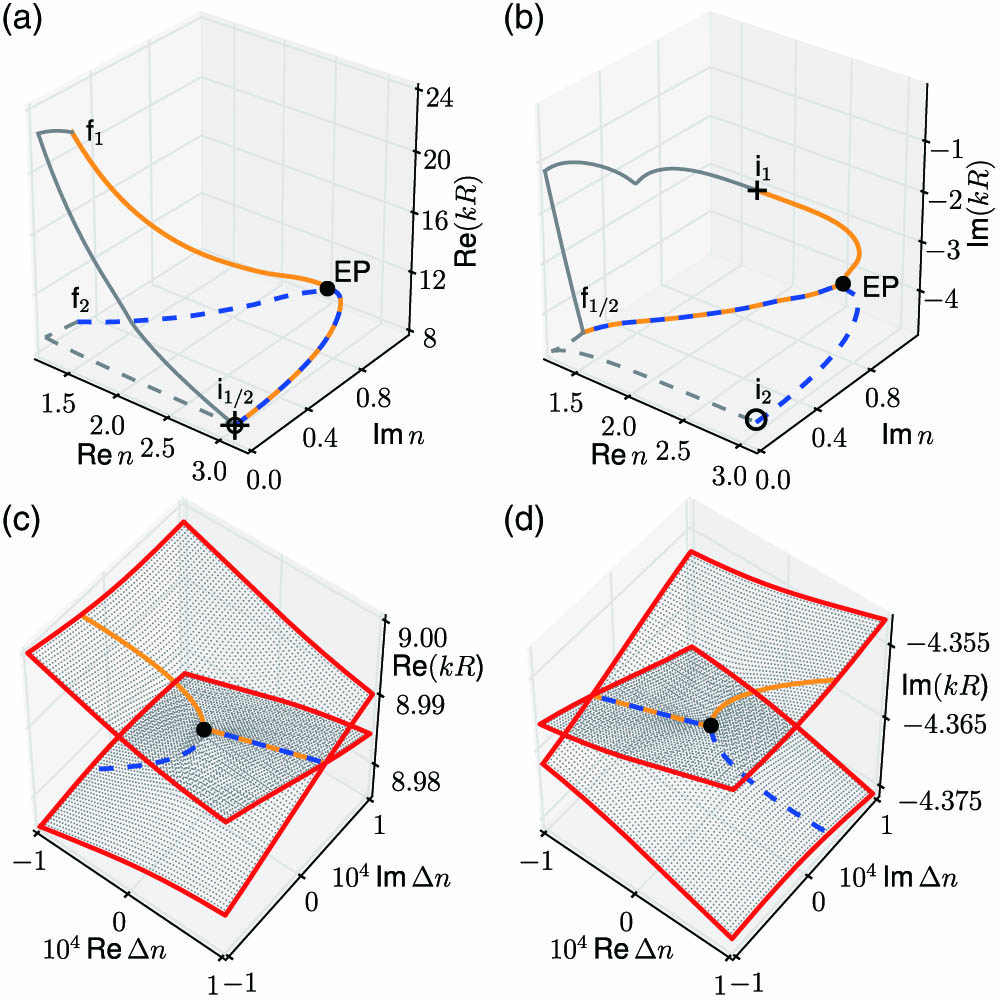
Fig. 10. (a),(c) and (b),(d) show the real and the imaginary parts of kR in the complex n plane, respectively. The (blue and gray) dashed curves belong to kR of the external mode and the (orange and gray) solid curves correspond to the internal mode. In (a) and (b), the cross (empty circle) marks the initial frequency of the internal (external) mode. The EP is marked by a black dot. In (c) and (d), the vicinity of the EP is shown via Δn=nnEP. The outer thick red curve corresponds to a two-fold encircling of the EP. Thin gray dots represent the Riemann sheets of kR.

下载图片 查看所有图片

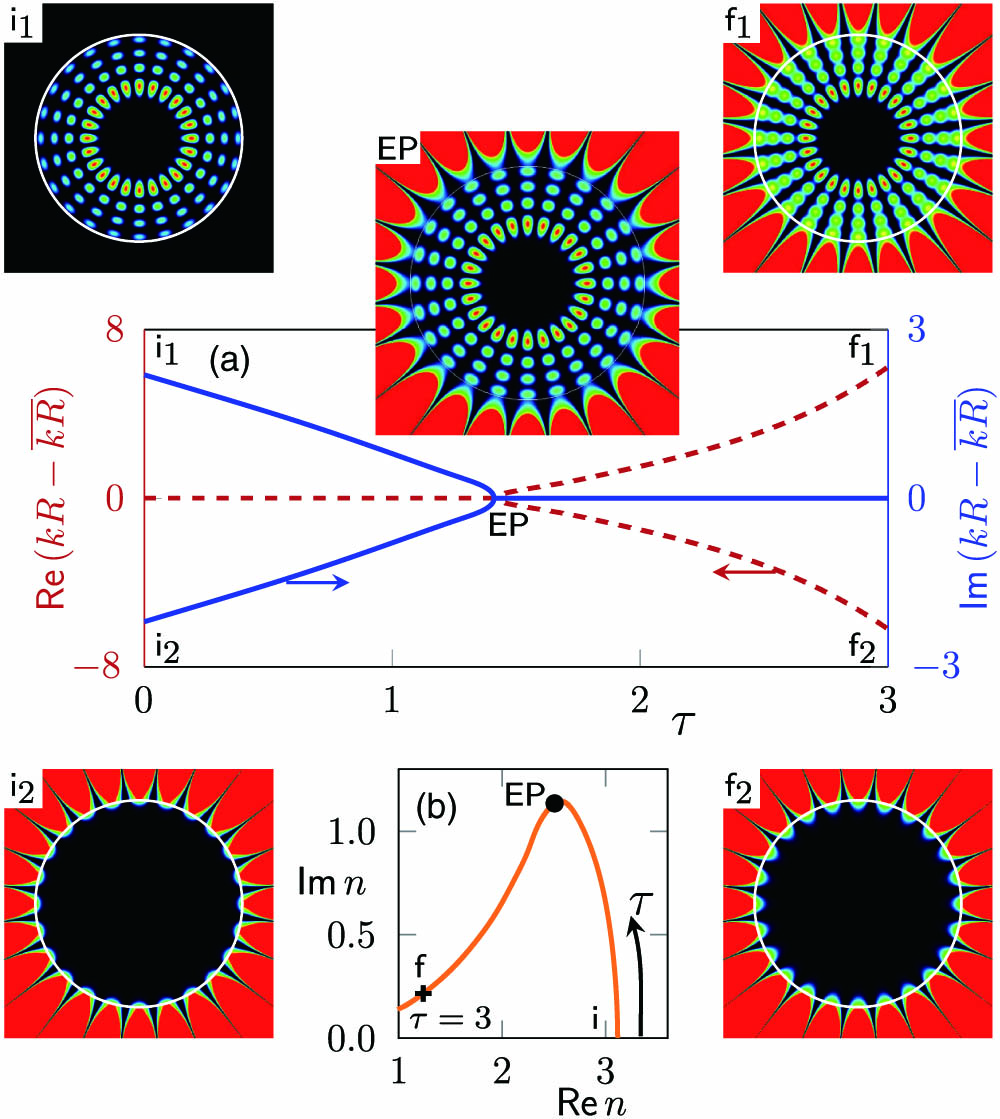
In Fig. 11(a), the difference of kR to the mean kR¯=(kIR+kEXR)/2 is shown along the parameter curve explained previously, which is parameterized by τ as shown in Fig. 11(b). At τ=0 (i.e., real n), the intensity patterns of the internal and external modes (i1 and i2) are clearly distinguishable whereas on the EP, at τ1.411, a single hybrid mode is formed with significant contributions inside as well as outside of the cavity. Further away from the EP, at τ=3, the modes are again clearly distinguishable by their mode patterns (f1 and f2). While one mode (f2 in Fig. 11) is clearly an external mode, the other one (f1 in Fig. 11), at first glance, seems to be a hybrid mode whose pattern is similar to the one at the EP. However, this similarity simply comes from the fact that the mode f1 is inside a cavity with a refractive index close to 1. More precisely, if the mode f1 is traced to a cavity with a real refractive index, it is related to the previous internal mode; see gray curves in Figs. 10(a) and 10(b).

Fig. 11. (a) Real (left/red axis/dashed curves) and imaginary (right/blue axis/solid curves) parts of the wave number kR relative to kR¯=(kIR+kEXR)/2 along the parameter curve in the complex n plane. The parameter curve is shown in (b), where the EP is marked as a thick black dot. τ parameterizes this curve starting at τ=0 for real n. τ=3 is marked as a black cross. The corresponding mode patterns at τ=0 (i), τ=τEP1.411 (EP), and τ=3 (f) are shown. The color map of the intensities ranging from black to red is truncated outside the cavity at twice the maximum value inside the cavity.

下载图片 查看所有图片

The general existence of such EPs for internal–external mode pairs, through the complex refractive index, is confirmed by exemplifying several mode pairs with m=12 in Fig. 12. Interestingly, the EPs and the corresponding parameter curves are quite regular in the complex n plane, and the morphology of the parameter curves is dictated by the external mode; see Figs. 12(b)12(e). If the corresponding external mode is deeper in the complex kR plane, in general, a longer parameter path in the complex n plane is taken to reach the EP [note the different vertical scales in Figs. 12(b)12(e)]. Hence, EPs associated with the first external modes [Fig. 12(e)] should be very close to the real n axis, which explains why they are accessible via weak or moderate boundary deformations as in Section 4.
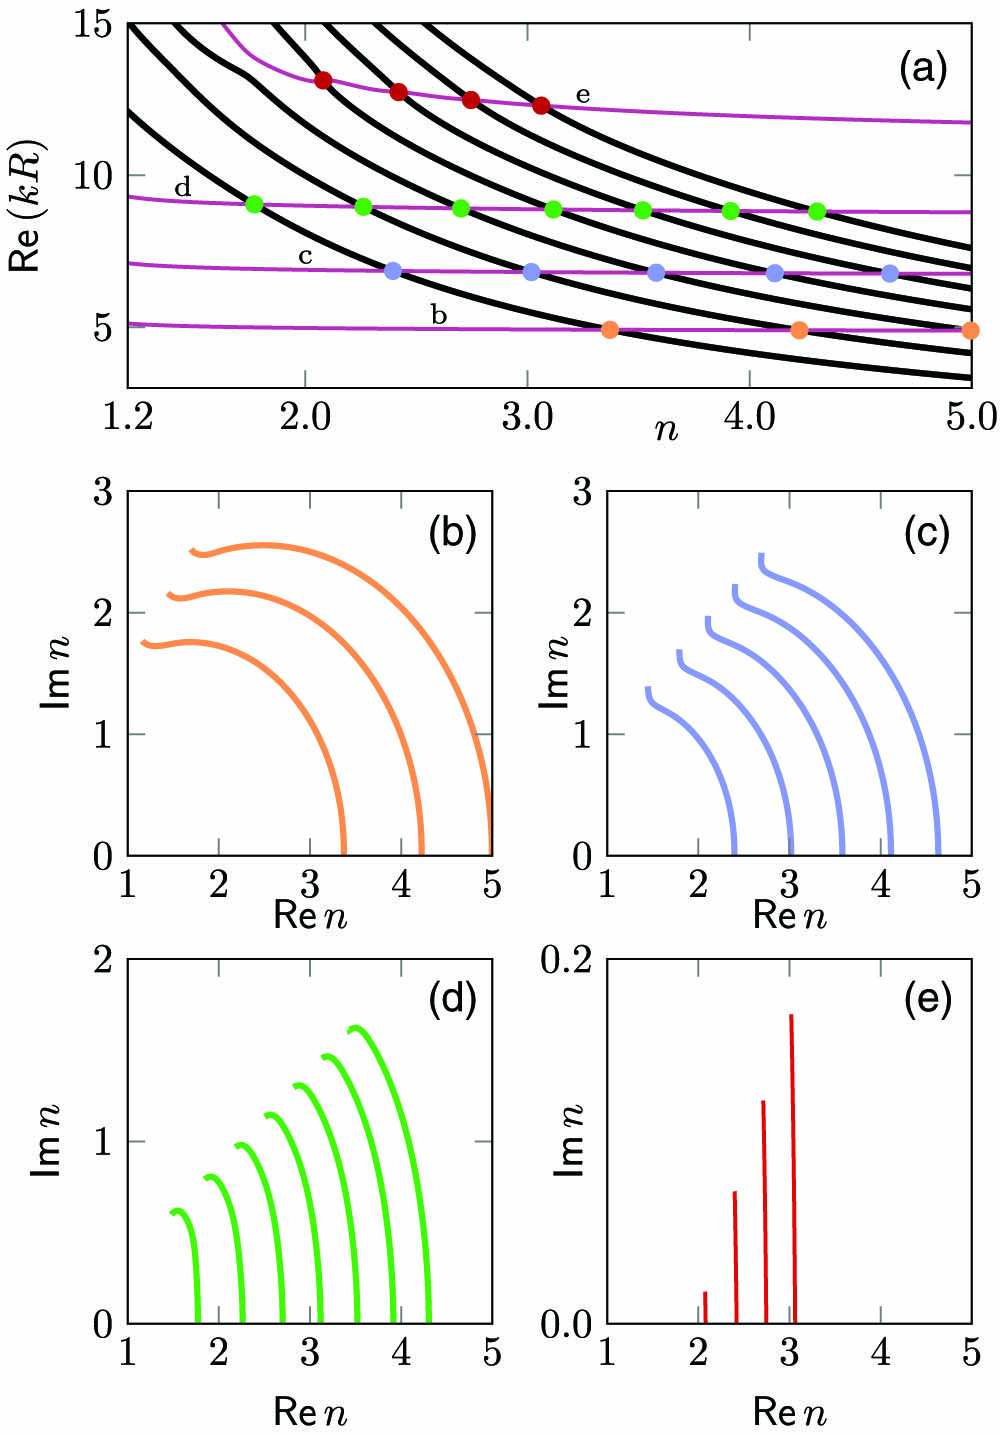
Fig. 12. In (a), Re(kR) is shown for varying real refractive index n for internal (black thick curves) and external (magenta thin curves) modes with m=12 in a circular cavity. In (b)–(e), the paths in the complex n plane are shown for which two modes (one internal and one external) with m=12 have the same Re(kR). The end point of each curve marks an EP. Colored dots in (a) mark the intersections as starting points for the parameter curves in (b)–(e).

下载图片 查看所有图片

In obtaining EPs through the complex-valued refractive index, some remarks are in order. First, the tracing procedure starting from the crossings in the imaginary part of kR to get the EPs is possible only for particular internal–external mode pairs. This is because such intersections in principle occur only for TE polarization (more specifically, only between kmBR and kmIR). Rather, the crossings in the real part of kR between external and internal modes are more likely; see Fig. 12(a). Second, the exact definition of internal and external modes becomes more subtle in the complex refractive index n plane. In the previous studies [28,29], they are often characterized via their behavior for Re(n). However, for complex n, one needs to specify more precisely the path along which this limit is taken.

At first glance, the experimental feasibility to adjust both the real and imaginary parts of the effective refractive index over wide ranges as, e.g., in Figs. 12(b)12(e), seems to be problematic. However, realistic physical cavity systems already suffer unavoidable non-Hermitian processes such as pumping or absorption. As a matter of fact, besides changing the intrinsic material, e.g., nPolymer1.5 or nInGaAsP3.3, large-scale control of the refractive index is available as well as fine-tuning of them statically, e.g., via material compositions [40,41] and adjusted cavity heights [42,43], or dynamically, e.g., via temperature control [44], changes of the environmental gas [45], or pump power control [46]. Moreover, the wavelength dependency of the complex refractive index might be exploited to setup experiments. For example, GaAs has complex refractive index n=3.8300+0.18145i for wavelength λ=0.65  μm and n=2.2730+4.0840i for λ=0.248  μm [40].

6. SUMMARY

We revealed numerically the existence of exceptional points resulting from the coupling of two different kinds of modes, i.e., an internal (Feshbach resonance) and external mode (shape resonance), in an optical microdisk cavity. The external modes have exponentially small contributions inside the cavity and a low Q-factor, whereas the internal modes usually have a high Q-factor representing the trapping of light inside the cavity. In this regard, an exceptional point between such different types of modes is novel and fundamentally different from previous studies on exceptional points in microdisk cavities where pairs of internal modes are considered solely. Signatures of an exceptional point formed by a particular class of external modes related to Brewster’s angle can be seen even in a circular cavity with a real-valued refractive index. However, this exceptional point can be obtained only in an approximate manner by implementing a discrete parameter (the mode number l) and a continuous parameter (the refractive index n). In order to merge an internal and external mode exactly, a second continuous parameter needs to be considered. In the case of external modes related to Brewster’s angle, such a suitable parameter is given by a boundary deformation parameter ε. The exact coalescence of arbitrary internal and external modes has been obtained by introducing absorption inside the circular cavity via a complex refractive index. Thus a two-dimensional parameter space is spanned by [Re(n),Im(n)], which allows us to achieve exceptional points between modes that are positioned at distant points in the complex frequency plane.

7 Acknowledgment

Acknowledgment. C.-H. Y. was financially supported by the DFG (project WI1986/7-1). M. H. and J. K. acknowledge support from DFG under the Emmy Noether Programme. The authors thank J. Kreismann for fruitful discussions.

References

[1] KatoT., Perturbation Theory for Linear Operators (Springer, 1966).

[2] W. D. Heiss. Repulsion of resonance states and exceptional points. Phys. Rev. E, 2000, 61: 929-932.

[3] M. V. Berry. Physics of nonhermitian degeneracies. Czech. J. Phys., 2004, 54: 1039-1047.

[4] H. Cartarius, J. Main, G. Wunner. Exceptional points in atomic spectra. Phys. Rev. Lett., 2007, 99: 173003.

[5] B. Alfassi, O. Peleg, N. Moiseyev, M. Segev. Diverging Rabi oscillations in subwavelength photonic lattices. Phys. Rev. Lett., 2011, 106: 073901.

[6] M. Liertzer, L. Ge, A. Cerjan, A. D. Stone, H. E. Türeci, S. Rotter. Pump-induced exceptional points in lasers. Phys. Rev. Lett., 2012, 108: 173901.

[7] M. Brandstetter, M. Liertzer, C. Deutsch, P. Klang, J. Schöberl, H. E. Türeci, G. Strasser, K. Unterrainer, S. Rotter. Reversing the pump dependence of a laser at an exceptional points. Nat. Commun., 2014, 5: 4034.

[8] C. Dembowski, H.-D. Gräf, H. L. Harney, A. Heine, W. D. Heiss, H. Rehfeld, A. Richter. Experimental observation of the topological structure of exceptional points. Phys. Rev. Lett., 2001, 86: 787-790.

[9] J. Doppler, A. A. Mailybaev, J. Böhm, U. Kuhl, A. Girschik, F. Libisch, T. J. Milburn, P. Rabl, N. Moiseyev, S. Rotter. Dynamically encircling an exceptional point for asymmetric mode switching. Nature, 2016, 537: 76-79.

[10] C. Dembowski, B. Dietz, H.-D. Gräf, H. L. Harney, A. Heine, W. D. Heiss, A. Richter. Observation of a chiral state in a microwave cavity. Phys. Rev. Lett., 2003, 90: 034101.

[11] B. Peng, Ş. K. Özdemir, M. Liertzer, W. Chen, J. Kramer, H. Yilmaz, J. Wiersig, S. Rotter, L. Yang. Chiral modes and directional lasing at exceptional points. Proc. Nat. Acad. Sci. USA, 2016, 113: 6845-6850.

[12] S.-B. Lee, J. Yang, S. Moon, S.-Y. Lee, J.-B. Shim, S. W. Kim, J.-H. Lee, K. An. Observation of an exceptional point in a chaotic optical microcavity. Phys. Rev. Lett., 2009, 103: 134101.

[13] J. Zhu, Ş. K. Özdemir, L. He, L. Yang. Controlled manipulation of mode splitting in an optical microcavity by two Rayleigh scatterers. Opt. Express, 2010, 18: 23535-23543.

[14] S. Richter, T. Michalsky, C. Sturm, B. Rosenow, M. Grundmann, R. Schmidt-Grund. Exceptional points in anisotropic planar microcavities. Phys. Rev. A, 2017, 95: 023836.

[15] N. Zhang, S. Liu, K. Wang, G. Z. L. Meng, N. Yi, S. Xiao, Q. H. Song. Single nanoparticle detection using far-field emission of photonic molecule around an exceptional point. Sci. Rep., 2015, 5: 11912.

[16] J. Wiersig. Enhancing the sensitivity of frequency and energy splitting detection by using exceptional points: application to microcavity sensors for single-particle detection. Phys. Rev. Lett., 2014, 112: 203901.

[17] J. Wiersig. Sensors operating at exceptional points: general theory. Phys. Rev. A, 2016, 93: 033809.

[18] W. Chen, Ş. K. Özdemir, G. Zhao, J. Wiersig, L. Yang. Exceptional points enhance sensing in an optical microcavity. Nature, 2017, 548: 192-196.

[19] H. Hodaei, A. U. Hassan, S. Wittek, H. Garcia-Gracia, R. El-Ganainy, D. N. Christodoulides, M. Khajavikhan. Enhanced sensitivity at higher-order exceptional points. Nature, 2017, 548: 187-191.

[20] H. Cao, J. Wiersig. Dielectric microcavities: model systems for wave chaos and non-Hermitian physics. Rev. Mod. Phys., 2015, 87: 61-111.

[21] J.-W. Ryu, S.-Y. Lee. Quasiscarred modes and their branching behaviour at an exceptional point. Phys. Rev. E, 2011, 83: 015203.

[22] J. Kullig, J. Wiersig. Perturbation theory for asymmetric deformed microdisk cavities. Phys. Rev. A, 2016, 94: 043850.

[23] C.-H. Yi, J. Kullig, J. Wiersig. Pair of exceptional points in a microdisk cavity under an extremely weak deformation. Phys. Rev. Lett., 2018, 120: 093902.

[24] T. Harayama, S. Shinohara. Two-dimensional microcavity lasers. Laser Photon. Rev., 2011, 5: 247-271.

[25] J. Wiersig. Structure of whispering-gallery modes in optical microdisks perturbed by nanoparticles. Phys. Rev. A, 2011, 84: 063828.

[26] R. Dubertrand, E. Bogomolny, N. Djellali, M. Lebental, C. Schmit. Circular dielectric cavity and its deformations. Phys. Rev. A, 2008, 77: 013804.

[27] E. Bogomolny, R. Dubertrand, C. Schmit. Trace formula for dielectric cavities: general properties. Phys. Rev. E, 2008, 78: 056202.

[28] C. P. Dettmann, G. V. Morozov, M. Sieber, H. Waalkens. Internal and external resonances of dielectric disks. Euro. Lett., 2009, 87: 34003.

[29] J. Cho, I. Kim, S. Rim, G.-S. Yim, C.-M. Kim. Outer resonances and effective potential analogy in two-dimensional dielectric cavities. Phys. Lett. A, 2010, 374: 1893-1899.

[30] J. Cho, S. Rim, C.-M. Kim. Dynamics of morphology-dependent resonances by openness in dielectric disks for TE polarization. Phys. Rev. A, 2011, 83: 043810.

[31] FowlesG. R., Introduction to Modern Optics (Courier Corporation, 1975).

[32] E. Bogomolny, R. Dubertrand. Trace formula for dielectric cavities. III. TE modes. Phys. Rev. E, 2012, 86: 026202.

[33] M. Hentschel, H. Schomerus. Fresnel laws at curved dielectric interfaces of microresonators. Phys. Rev. E, 2002, 65: 045603.

[34] Y. Choi, S. Kang, S. Lim, W. Kim, J.-R. Kim, J.-H. Lee, K. An. Quasieigenstate coalescence in an atom-cavity quantum composite. Phys. Rev. Lett., 2010, 104: 153601.

[35] S. V. Boriskina, T. M. Benson, P. D. Sewell, A. I. Nosich. Directional emission, increased free spectral range, and mode Q-factors in 2-D wavelength-scale optical microcavity structures. IEEE J. Sel. Top. Quantum Electron., 2006, 12: 1175-1182.

[36] J. Kullig, J. Wiersig. Q spoiling in deformed optical microdisks due to resonance-assisted tunneling. Phys. Rev. E, 2016, 94: 022202.

[37] J. Wiersig. Boundary element method for resonances in dielectric microcavities. J. Opt. A, 2003, 5: 53-60.

[38] J. Wiersig. Perturbative approach to optical microdisks with a local boundary deformation. Phys. Rev. A, 2012, 85: 063838.

[39] BrownJ. W.ChurchillR. V., Complex Variables and Applications (McGraw-Hill Higher Education, 2009).

[40] D. Aspnes, S. Kelso, R. Logan, R. Bhat. Optical properties of AlxGa1-xAs. J. Appl. Phys., 1986, 60: 754-767.

[41] S. Adachi. Optical dispersion relations for GaP, GaAs, GaSb, InP, InAs, InSb, AlxGa1-xAs, and In1-xGaxAsyPy-1. J. Appl. Phys., 1989, 66: 6030-6040.

[42] S. Bittner, B. Dietz, M. Miski-Oglu, P. O. Iriarte, A. Richter, F. Schäfer. Experimental test of a two-dimensional approximation for dielectric microcavities. Phys. Rev. A, 2009, 80: 023825.

[43] M. Lebental, C. Djellali, N. Arnaud, J. S. Lauret, J. Zyss, R. Dubertrand, C. Schmit, E. Bogomolny. Inferring periodic orbits from spectra of simply shaped microlasers. Phys. Rev. A, 2007, 76: 023830.

[44] M. Benyoucef, J.-B. Shim, J. Wiersig, O. Schmidt. Quality-factor enhancement of supermodes in coupled microdisks. Opt. Lett., 2011, 36: 1317-1319.

[45] F. Vollmer, L. Yang. Review label-free detection with high-Q microcavities: a review of biosensing mechanisms for integrated devices. Nanophotonics, 2012, 1: 267-291.

[46] B. R. Bennett, R. A. Soref, J. A. Del Alamo. Carrier-induced change in refractive index of InP, GaAs and InGaAsP. IEEE J. Quantum Electron., 1990, 26: 113-122.

Chang-Hwan Yi, Julius Kullig, Martina Hentschel, Jan Wiersig. Non-Hermitian degeneracies of internal–external mode pairs in dielectric microdisks[J]. Photonics Research, 2019, 7(4): 04000464.

引用该论文: TXT   |   EndNote

相关论文

加载中...

关于本站 Cookie 的使用提示

中国光学期刊网使用基于 cookie 的技术来更好地为您提供各项服务,点击此处了解我们的隐私策略。 如您需继续使用本网站,请您授权我们使用本地 cookie 来保存部分信息。
全站搜索
您最值得信赖的光电行业旗舰网络服务平台!