Photonics Research, 2018, 6 (3): 03000182, Published Online: Jul. 10, 2018  

Optical trapping of single quantum dots for cavity quantum electrodynamics Download: 610次

Pengfei Zhang 1,3,*Gang Song 1,2,*Li Yu 1
Author Affiliations
1 School of Science, Beijing University of Posts and Telecommunications, Beijing 100876, China
2 e-mail: songgangbupt@163.com
3 e-mail: pfzhang1980@gmail.com
Figures & Tables

Fig. 1. Optical trapping of quantum dots for the study of the strong light–matter interaction. (a) Nanotweezers with double holes in a silver patch. (b) Scattering spectrum of the nano-structure without quantum dots. The spectrum is normalized to its maximum. (c) Electric field distribution in the xy plane located at the top surface of the silver patch. (d) Electric field distribution in the xz plane bisecting the nanostructure. Gray areas indicate the structures.

下载图片 查看原文

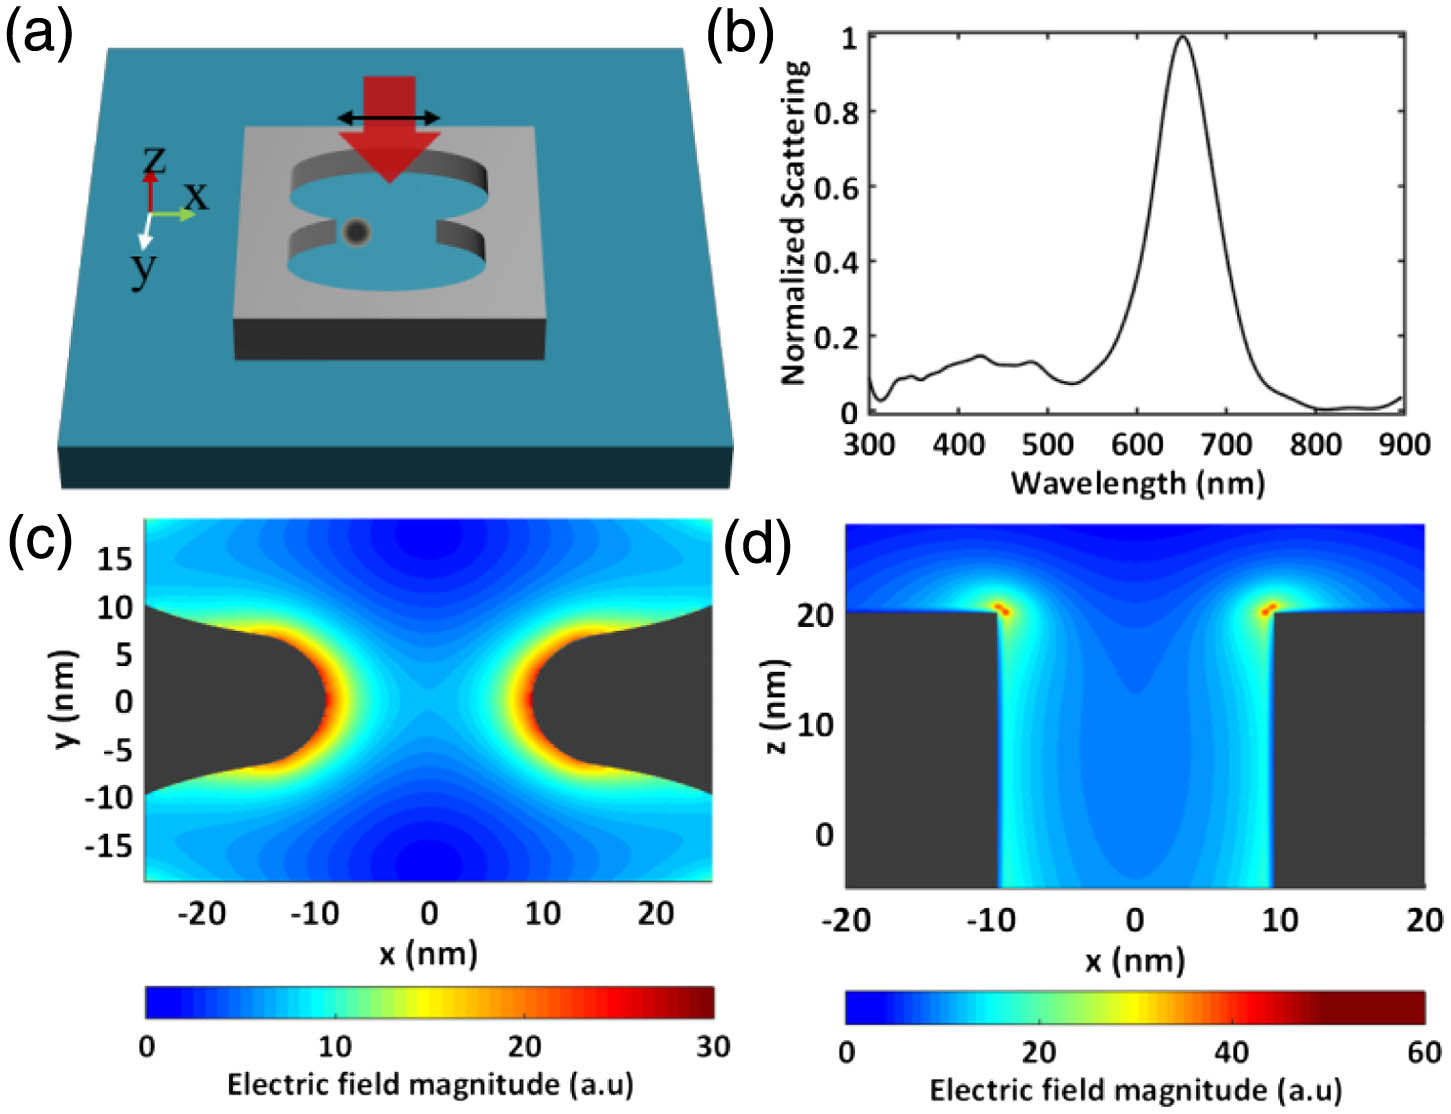
Fig. 2. Optical force generated by the localized surface electromagnetic field. (a) Electrical field distribution of the nanocavity in the xz plane bisecting the structure when a quantum dot is present at one of the tips. (b) Optical force on the quantum dot as a function of trapping laser wavelength. (c) Optical force vector field in the xy plane located at the top surface of the silver patch. (d) Optical force vector field in the xz plane bisecting the structure.

下载图片 查看原文

Fig. 3. Optical force on a quantum dot located at different positions in the cavity. (a) X component of the optical force as a function of the x coordinates of the quantum dot. The y and z coordinates of the quantum dot are fixed at 0 and 19 nm, respectively. (b) Z component of the optical force as a function of the z coordinates of the quantum dot. The x and y coordinates of the quantum dot are fixed at 4.4 and 0 nm, respectively. The solid curves are calculated from the Maxwell’s stress tensor, and the dashed lines are calculated from the electric field intensity gradient of the bare cavity. The intensity of the trapping laser used in the simulation is 1  mW/μm2. The dashed curves are magnified by a magnitude of five orders for display. MST, Maxwell’s stress tensor method; gradient, field intensity gradient method.

下载图片 查看原文

Fig. 4. Scattering spectra of the nanocavity and the trapped quantum dots. (a) Scattering spectrum of the nanotweezers with two quantum dots trapped at the edges of the cavity’s tips. Quantum dots are resonant with the nanocavity. (b) Scattering spectra of the nanotweezers with two trapped quantum dots having various emissions. Spectra are ordered by the detuning energy of the quantum dots from the plasmonic cavity.

下载图片 查看原文

Pengfei Zhang, Gang Song, Li Yu. Optical trapping of single quantum dots for cavity quantum electrodynamics[J]. Photonics Research, 2018, 6(3): 03000182.

引用该论文: TXT   |   EndNote

相关论文

加载中...

关于本站 Cookie 的使用提示

中国光学期刊网使用基于 cookie 的技术来更好地为您提供各项服务,点击此处了解我们的隐私策略。 如您需继续使用本网站,请您授权我们使用本地 cookie 来保存部分信息。
全站搜索
您最值得信赖的光电行业旗舰网络服务平台!