基于组合算法的油类污染物三维荧光光谱分析  下载: 950次
Three-Dimensional Fluorescence Spectra Analysis of Oil Contaminants Based on Algorithm Combination Methodology
华北理工大学电气工程学院, 河北 唐山 063210
图 & 表
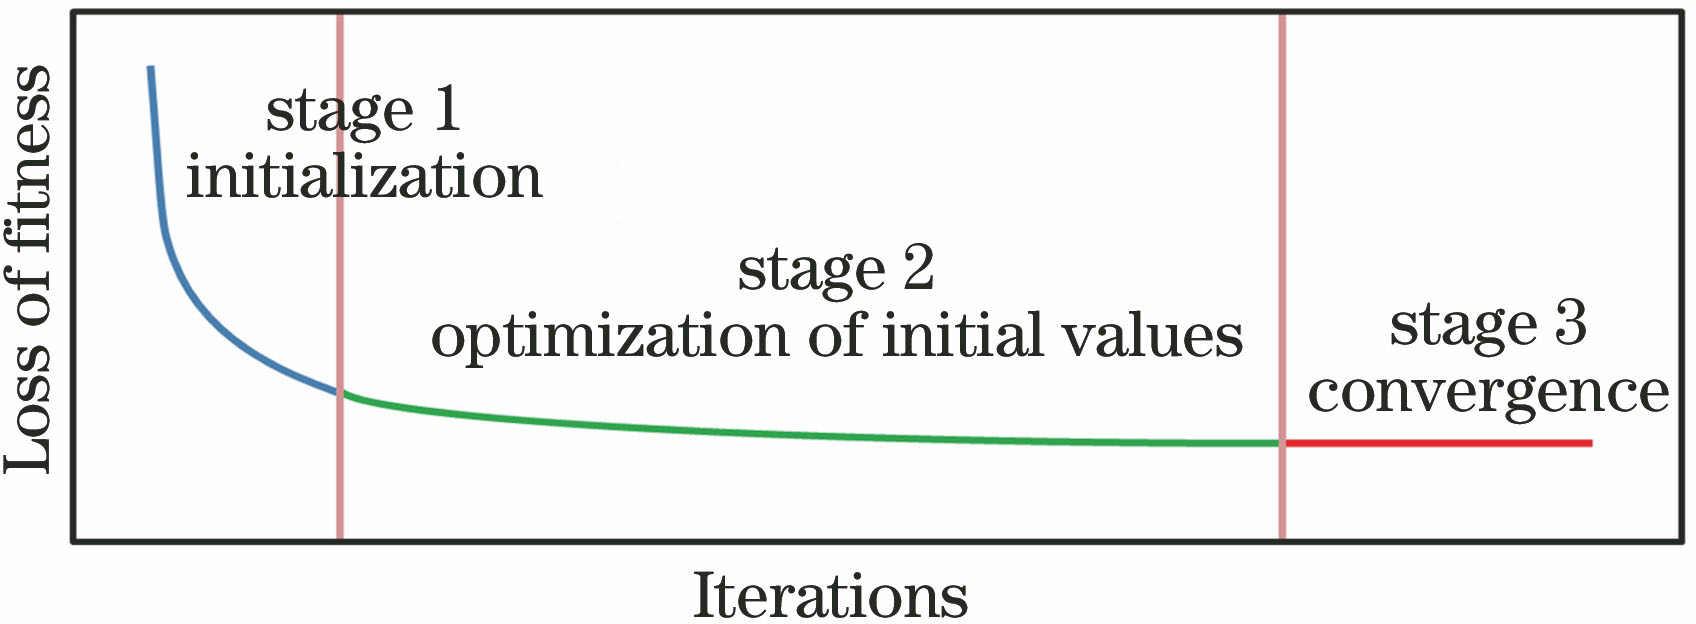
图 1. 损失函数的变化过程
Fig. 1. Change process of loss function
下载图片 查看原文
图 2. ACM的数据分析流程图
Fig. 2. Data analysis flow chart of ACM
下载图片 查看原文
图 3. 基于ACM的三线性分解
Fig. 3. Trilinear decomposition based on ACM
下载图片 查看原文
图 4. 标准溶液未校正的三维荧光光谱和预处理后的三维荧光光谱。(a)(d) 0#柴油;(b)(e) 95#汽油;(c)(f) 普通煤油
Fig. 4. Three-dimensional fluorescence spectra of uncorrected standard solution and after pretreatment. (a) (d) 0# Diesel; (b)(e) 95# gasoline; (c)(f) ordinary kerosene
下载图片 查看原文
图 5. X1的核一致诊断结果及残差平方和分析结果
Fig. 5. X1 nuclear consensus diagnosis results and residual square sum analysis results
下载图片 查看原文
图 6. 柴油、汽油和煤油的(a)(b) ATLD解析光谱与(c)(d) ACM解析光谱
Fig. 6. (a)(b) ATLD analytical spectra and (c)(d) ACM analytical spectra of diesel, gasoline and kerosene
下载图片 查看原文
表 1样品中油类物质的质量浓度
Table1. Concentration of oil in the samplemg/L
| Sample | 0# Diesel | 95# Gasoline | Kerosene | Sample | 0# Diesel | 95# Gasoline | Kerosene |
|---|
| 1 | 1.0 | 5.2 | 2.6 | 9 | 0.9 | 1.2 | 0.8 | | 2 | 0.2 | 4.8 | 2.4 | 10 | 1.0 | 1.0 | 1.0 | | 3 | 1.2 | 3.6 | 1.2 | 11 | 0.3 | 3.5 | 1.3 | | 4 | 0.4 | 3.2 | 1.8 | 12 | 0.4 | 2.8 | 2.0 | | 5 | 2.5 | 2.6 | 3.5 | 13 | 0.5 | 2.2 | 2.6 | | 6 | 0.6 | 2.4 | 5.0 | 14 | 0.6 | 1.7 | 3.3 | | 7 | 5.0 | 1.2 | 4.5 | 15 | 0.7 | 1.4 | 3.9 | | 8 | 0.8 | 1.0 | 2.0 | 16 | 0.8 | 1.0 | 4.5 |
|
查看原文
表 2不同组分数下各算法解析柴油所得结果
Table2. Results obtained by each algorithm for analyzing diesel under different component numbers
| Sample | Actual | N=3 | N=4 | | | | | | |
|---|
| ATLD | | | | | | | SWATLD | PARAFAC | ACM | ATLD | SWATLD | ACM |
|---|
| 11 | 0.3 | 0.28 | 0.28 | 0.29 | 0.29 | 0.28 | 0.28 | 0.29 | | 12 | 0.4 | 0.39 | 0.39 | 0.38 | 0.38 | 0.37 | 0.39 | 0.38 | | 13 | 0.5 | 0.48 | 0.47 | 0.47 | 0.47 | 0.48 | 0.47 | 0.47 | | 14 | 0.6 | 0.56 | 0.58 | 0.59 | 0.59 | 0.56 | 0.58 | 0.59 | | 15 | 0.7 | 0.66 | 0.67 | 0.69 | 0.69 | 0.66 | 0.67 | 0.68 | | 16 | 0.8 | 0.78 | 0.78 | 0.78 | 0.78 | 0.78 | 0.78 | 0.78 | | Average recovery /% | 95.33 | 95.79 | 96.68 | 96.68 | 94.50 | 95.79 | 96.44 |
|
查看原文
表 3不同组分数下各算法解析汽油所得结果
Table3. Results obtained by each algorithm for analyzing gasoline under different component numbers
| Sample | Actual | N=3 | N=4 | | | | | | |
|---|
| ATLD | | | | | | | SWATLD | PARAFAC | ACM | ATLD | SWATLD | ACM |
|---|
| 11 | 3.5 | 3.41 | 3.36 | 3.38 | 3.39 | 3.41 | 3.29 | 3.39 | | 12 | 2.8 | 2.69 | 2.56 | 2.77 | 2.76 | 2.69 | 2.56 | 2.76 | | 13 | 2.2 | 2.08 | 2.08 | 2.10 | 2.16 | 2.08 | 2.08 | 2.16 | | 14 | 1.7 | 1.68 | 1.64 | 1.67 | 1.68 | 1.68 | 1.64 | 1.68 | | 15 | 1.4 | 1.38 | 1.36 | 1.37 | 1.38 | 1.38 | 1.29 | 1.38 | | 16 | 1.0 | 0.94 | 0.94 | 0.95 | 0.96 | 0.94 | 0.94 | 0.96 | | Average recovery /% | 96.57 | 94.93 | 97.01 | 97.83 | 96.57 | 93.76 | 97.83 |
|
查看原文
表 4不同组分数下各算法解析煤油所得结果
Table4. Results obtained by each algorithm for analyzing kerosene under different component numbers
| Sample | Actual | N=3 | N=4 | | | | | | |
|---|
| ATLD | | | | | | | SWATLD | PARAFAC | ACM | ATLD | SWATLD | ACM |
|---|
| 11 | 1.3 | 1.27 | 1.23 | 1.26 | 1.24 | 1.27 | 1.23 | 1.24 | | 12 | 2.0 | 1.87 | 1.96 | 1.97 | 1.95 | 1.86 | 1.94 | 1.95 | | 13 | 2.6 | 2.56 | 2.54 | 2.55 | 2.55 | 2.56 | 2.54 | 2.55 | | 14 | 3.3 | 3.27 | 3.23 | 3.28 | 3.26 | 3.26 | 3.23 | 3.26 | | 15 | 3.9 | 3.74 | 3.71 | 3.75 | 3.77 | 3.74 | 3.71 | 3.77 | | 16 | 4.5 | 4.34 | 4.34 | 4.32 | 4.33 | 4.34 | 4.32 | 4.33 | | Average recovery /% | 96.85 | 96.63 | 97.51 | 97.11 | 96.72 | 96.39 | 97.11 |
|
查看原文
陈至坤, 黄微, 程朋飞, 沈小伟, 王福斌. 基于组合算法的油类污染物三维荧光光谱分析[J]. 激光与光电子学进展, 2019, 56(3): 033002. Zhikun Chen, Wei Huang, Pengfei Cheng, Xiaowei Shen, Fubin Wang. Three-Dimensional Fluorescence Spectra Analysis of Oil Contaminants Based on Algorithm Combination Methodology[J]. Laser & Optoelectronics Progress, 2019, 56(3): 033002.


 PDF全文
PDF全文

