Photonics Research, 2020, 8 (10): 10001573, Published Online: Sep. 15, 2020  

Strong optical force of a molecule enabled by the plasmonic nanogap hot spot in a tip-enhanced Raman spectroscopy system Download: 633次

Author Affiliations
School of Physics and Optoelectronics, South China University of Technology, Guangzhou 510641, China
Abstract
Tip-enhanced Raman spectroscopy (TERS) offers a powerful means to enhance the Raman scattering signal of a molecule as the localized surface plasmonic resonance will induce a significant local electric field enhancement in the nanoscale hot spot located within the nanogap of the TERS system. In this work, we theoretically show that this nanoscale hot spot can also serve as powerful optical tweezers to tightly trap a molecule. We calculate and analyze the local electric field and field gradient distribution of this nanogap plasmon hot spot. Due to the highly localized electric field, a three-dimensional optical trap can form at the hot spot. Moreover, the optical energy density and optical force acting on a molecule can be greatly enhanced to a level far exceeding the conventional single laser beam optical tweezers. Calculations show that for a single H2TBPP organic molecule, which is modeled as a spherical molecule with a radius of rm=1 nm, a dielectric coefficient ε=3, and a polarizability α=4.5×10-38 C·m2/V, the stiffness of the hot-spot trap can reach a high value of about 2 pN/[(W/cm2)·m] and 40 pN/[(W/cm2)·m] in the direction perpendicular and parallel to the TERS tip axis, which is far larger than the stiffness of single-beam tweezers, 0.4 pN/[(W/cm2)·m]. This hard-stiffness will enable the molecules to be stably captured in the plasmon hot spot. Our results indicate that TERS can become a promising tool of optical tweezers for trapping a microscopic object like molecules while implementing Raman spectroscopic imaging and analysis at the same time.

1. INTRODUCTION

Light carries energy and momentum besides electromagnetic field. Therefore, light–matter interaction naturally brings about mechanical effects, among which the optical force occurring due to the exchange of momentum between light and matter is a prominent example. Optical force has been extensively explored in the optical tweezers system for capturing microscopic objects such as cells, micrometer beads, and nanoparticles. Since Ashkin first demonstrated the concept of negative light pressure due to the gradient force [1], the single-beam optical tweezers, which use a microscopic object to tightly focus a single laser beam, have become an extremely important tool in diversified fields of atomic spectroscopy, cell biology, and nano-biophotonics [26" target="_self" style="display: inline;">6]. During the past several decades, the concepts, schemes, and technologies of optical tweezers have evolved gradually. For instance, many researchers have employed a structured laser beam to develop the multiple-beam optical tweezers and widely used them in cell manipulation, sorting, and related measurements [7]. Unfortunately, the size of the focus spot generated in these single-beam and multiple-beam far-field optical tweezers is limited by the diffraction limit of light so that only micrometer-scale particles can be captured while positioning of nanoscale objects remains difficult [8,9].

Recently, many studies have combined optical tweezers and the concepts and techniques of near-field optics and nanophotonics, and successfully pushed optical tweezers into the nanoscale region. These near-field optical tweezers make the stable trapping of nanometer-size objects in the 10–100 nm range no longer a great challenge [1013" target="_self" style="display: inline;">13]. As a prominent example, plasmonic tweezers, which are based on surface plasmon polaritons excited in metallic nanostructures, have been shown to exhibit a greatly enhanced trapping force for both dielectric and metallic particles in the vicinity of metallic nanostructures [1419" target="_self" style="display: inline;">19]. This type of near-field optical tweezers provides a potential means for trapping and manipulating metallic particles with 10–100 nm size. In particular, Yuan and co-workers confirmed for the first time by theory and experiment that the total force generated in the near-field plasmonic tweezers is not the result of a stronger gradient force dominating an opposing scattering force but instead of a dominant gradient force assisted by a weak scattering force acting in the same direction [20].

In the above plasmonic optical tweezers, the hot spot, with greatly enhanced optical field intensity in a nanoscale spatial region with a size far smaller than the wavelength of light, plays an important role in achieving the unique features of optical force. It is generally recognized that the plasmonic nanogap in the tip-enhanced Raman scattering (TERS) system, which is formed by a metallic tip (with a nanoscale curvature at the apex) sitting on a metallic thin film with controllable nanometer-size gap, provides a very unique hot spot [2123" target="_self" style="display: inline;">–23]. In fact, Dong and co-workers have used this TERS system under the ultra-vacuum and ultra-low temperature conditions to demonstrate a Raman imaging spatial resolution below 1 nm [24]. When a suitable excitation laser light is incident, the metal nanogap generates a truly nanoscale hot spot due to the collective action of the lightning rod effect and localized surface plasmon resonance (LSPR) effect. Also by using a similar system with nanoscale confined light, Lee and co-workers visualized the image of molecular vibration normal modes and atomically parsed the intramolecular charges and currents driven by these vibrations [25]. These results clearly indicate that the nanoscale localized light offered by the plasmonic nanogap in the state-of-the-art TERS system can bring about fruitful light–matter interaction physics. It is expected that beyond molecular fluorescence, Raman scattering, and molecular vibration, there should still exist many physical phenomena remaining to be discovered.

In this work, we theoretically explore the mechanical effect of this nanoscale localized hot spot acting upon the molecule embedded within the nanogap of the TERS system. We carry out a systematical numerical analysis based on a three-dimensional finite-difference time-domain (3D FDTD) calculation against the optical field distribution of this nanogap plasmonic hot spot, not only the field intensity but also the field gradient. Then we calculate the resulting gradient force upon the molecule by Eq. (4). From these numerical results and theoretical analyses, we can deeply explore the unique optical force properties of this plasmon hot spot and look into the perspective of using it as a powerful means of optical tweezers.

2. RESULTS AND DISCUSSION

The geometry model of a typical TERS system as studied in this work is illustrated in Fig. 1(a), which consists of a single-crystal silver conical tip sitting above a single-crystal silver film separated by a nanogap of height h. The coordinate is set such that the z-axis is parallel to the vertical direction (namely the TERS tip axis direction) with the metal substrate surface located at z=0, while the xy plane is the horizontal plane with the tip axis passing through the coordinate origin (x=y=0). A molecule is located right at the nanogap center and is excited by an incline incident laser light. Of course, in our simulation of optical force, we can set the molecule at any position within the nanogap. The radius of curvature of the tip is 6.25 nm, the nanogap height is 2 nm, and the incident light is a p-polarized 532 nm laser with an inclination angle of 60 deg from the z-axis. As the incident light contains an electric field component in the z direction, it excites the nanogap plasmon mode between the tip and the substrate.

Fig. 1. (a) Schematic diagram for a typical TERS system involving a molecule immersed within a mode that is excited by an incident p-polarized laser. (b) Schematic diagram showing the molecule affected by the gradient force coming from the highly localized and enhanced electric field hot spot within the nanogap.

下载图片 查看所有图片

To solve the optical force exerted on the molecule, the first step is to calculate the optical field around the molecule within the nanogap under the excitation of the incident laser, which is set to have an amplitude of |E0|=1V/m. We used the 3D FDTD approach to numerically solve the optical field. In our 3D FDTD simulations, a cubic simulation region with the size of 60  nm×60  nm×40  nm was used throughout all calculations. Perfectly matched layers boundary conditions were used on all boundaries of simulation region to avoid disturbance of the boundary reflection. In order to accurately simulate the 2 nm tip–substrate distance, the minimum uniform mesh size was set to 0.2 nm. The optical constant for silver was taken from Ref. [26]. The 3D FDTD approach allows us to determine precisely the 3D optical electric field distribution, including its intensity and vectorial direction, within and around the nanogap, where the molecule is located.

The next step is to determine the mechanical response, namely, the optical force of the molecule against the optical field within which it is immersed. In our work, the excited molecule was modeled using an electric dipole with a dielectric constant of 3, which is close to the value of the solid material made from the aggregation of these molecules as building block. Now we need to first estimate the linear polarizability of the molecule. We first consider a single H2TBPP organic molecule, which was systematically studied in Ref. [24]. This molecule exhibits a disk-like geometry, has a diameter of 2  nm and thickness of 0.5  nm. In this work, we assume that it could be modeled as a spherical molecule with a radius of rm=1  nm and a dielectric coefficient ε=3. The linear molecular polarizability α of this molecule could be predicted by the Clausius–Mossotti relationship and write The result is α=4.5×1038  C·m2/V [23].

Generally, if the molecule size is much smaller than the laser wavelength (with radius less than λ/10), we assume that the external electric field does not vary within the molecule. Therefore, the molecules are often regarded as point electric dipoles to account for their optical and mechanical responses [2729" target="_self" style="display: inline;">–29]. In this means, each chemical bond of a molecule can be viewed as an equivalent electric dipole, which can be described by an equivalent electric dipole moment p. The sum of the electric dipole moments of all chemical bonds in the molecule constitutes the overall electric dipole moment of the entire molecule. In a non-uniform electric field, when p is parallel with E, the forces acting on the positive and negative electric charges of the electric field are all along the same straight line. Suppose the straight line where the dipole is located is along the x-axis, the field strength in the center of the dipole is E0, and the dipole moment length is l; then the field strengths at the positive and negative charges are The electric field force upon the dipole is The electric field gradient force Fg upon the electric dipole with principal moment p is then written as If the molecule involves a series of dipole pi within its occupied space, the overall force is just the superposition of all these individual forces, which is written as Fg=i(pi·)Ei. In our current work, we only consider the model where the molecular mechanical response to optical field is described by only an overall electric dipole as related with the molecular polarizability given by Eq. (1), namely, p=αE. Then Eq. (4) can be expressed as (from Eq. (2.18) in Ref. [30]) On the other hand, besides the gradient force, there might exist the scattering force induced by the scattering of light by the dipole and the associate momentum exchange between light and molecule. The scattering force is given by (from Eq. (2) in Ref. [22]) where Cscat is the scattering cross section as expressed as Here S is the time-averaged Poynting vector of light, and k=2πn0/λ is the wavenumber in the surrounding medium with refractive index n0. Inserting the linear molecular polarizability α=4.5×1038  C·m2/V and S into Eqs. (6) and (7), we can find Fscat1050  pN/mW. Thus, in this system the scattering force is very small compared with the gradient force so that it can be ignored.

Having clarified the major contribution of gradient force upon the molecule, it is then straightforward to proceed to evaluate the optical force from the nanogap plasmon hot spot numerically and theoretically. In our simulations, we have solved the electric field distribution E and then calculated the optical force upon the molecule by using Eqs. (1) and (5).

For a dielectric particle, the gradient force essentially depends on the local electric field distribution (in particular the field gradient) and the charge density distribution (in particular the effective dipole moment) induced in the particle. In TERS, the key contribution to the optical force is the highly localized field of hot spot associated with the strong LSPR with the plasmonic nanogap. Remarkably, this hot spot has a full width at half-maximum (FWHM) that is far smaller than the wavelength of light and readily reaches the nanometer scale regime. Compared with the diffraction-limited focusing of a Gaussian beam in ordinary single-beam microscopic-objective optical tweezers, the much sharper focusing of the plasmonic wave should be able to produce a stronger gradient force.

It is worthwhile to make a comparison with the more common and popular single-beam tweezers. As shown in Fig. 2(a), a single Gaussian beam with the same amplitude |E0|=1V/m passing through the microscopic-objective lens (pupil radius=5  mm, NA=0.7) forms a focus spot. We assume that the transmission efficiency of this optical tweezers system is 0.1 in practice. This focus spot provides an intensity gradient force to capture particles. It is well known that the equilibrium position of this far-field optical trap against the molecule is right at the center of the focus spot. We calculate the gradient force of the molecule and show in Fig. 2(b) the gradient force in the xy plane of the focus spot. The results show that the gradient force components in the x-axis direction and y-axis direction are both about 108  pN/(W/cm2), while the z-axis direction component is almost zero. Here, the optical power has been normalized to the incident optical power density. In theory, this amount of optical force is sufficient to capture molecules at the focus spot. However, the focus spot size of the far-field objective lens (about a wavelength of 600  nm) is 2–3 orders of magnitude larger compared to the H2TBPP molecule (2  nm in size and 0.5  nm in thickness). It is then impossible for a molecule to be tightly trapped at a specific region in the range of the focus spot. In practice, the focus spot can trap thousands of molecules randomly located within the 3D focus spot of classical optical tweezers instead of a single molecule. Therefore, it is necessary to find an advanced system to achieve precise capture of a single molecule.

Fig. 2. (a) Schematic diagram of classical optical tweezers formed by a tightly focused Gaussian laser beam trapping a molecule. (b) Calculated optical gradient forces component in the x-axis, y-axis, and z-axis directions in the xy plane of the focus point.

下载图片 查看所有图片

It has been well established that for optical tweezers, in principle a tiny focus spot of the trapping beam is necessary for providing a sufficient strength of gradient force to capture a molecule. For this reason, we turn to the TERS system for solution because the very tiny hot spot of local electric field enhanced by LSPR in the plasmonic nanogap should provide a much stronger gradient field. We study the distribution of gradient force and calculate the accurate value to provide a reliable analysis on whether the hot spot can trap the molecule.

In previous studies of TERS systems, the materials of the tip and substrate are generally gold or silver materials. Which material is better for studying optical forces in a TERS system? We know that the gradient force is related to the strength of the electric field. Thus we study the xy plane (z=1  nm) and xz plane electromagnetic field distribution of silver and gold as the tip and substrate under the same conditions as shown in Figs. 3(a)–3(d). Comparing Figs. 3(a) and 3(c), the xy plane electric field intensity of an Ag tip on an Ag substrate is 3 times that of an Au tip on an Au substrate under the same conditions. Comparing Figs. 3(b) and 3(d), the xz plane electric field intensity distribution is almost the same. This result shows that a stronger electromagnetic field distribution can be obtained in the radial direction with an Ag tip on an Ag substrate. Similarly, in this gap, the curvature of the tip also has a great influence on the distribution of the electromagnetic field. Therefore, we increase the radius of curvature of the tip by 4 times, and the result is shown in Figs. 3(e) and 3(f). By comparing the xy plane electromagnetic field distribution in Figs. 3(a) and 3(e), the larger the curvature, the more the electromagnetic field distribution diverges, which restricts the capture of smaller particles. Therefore, we use an Ag tip (with the curvature radius of 6.25 nm) as the structural parameter of the system.
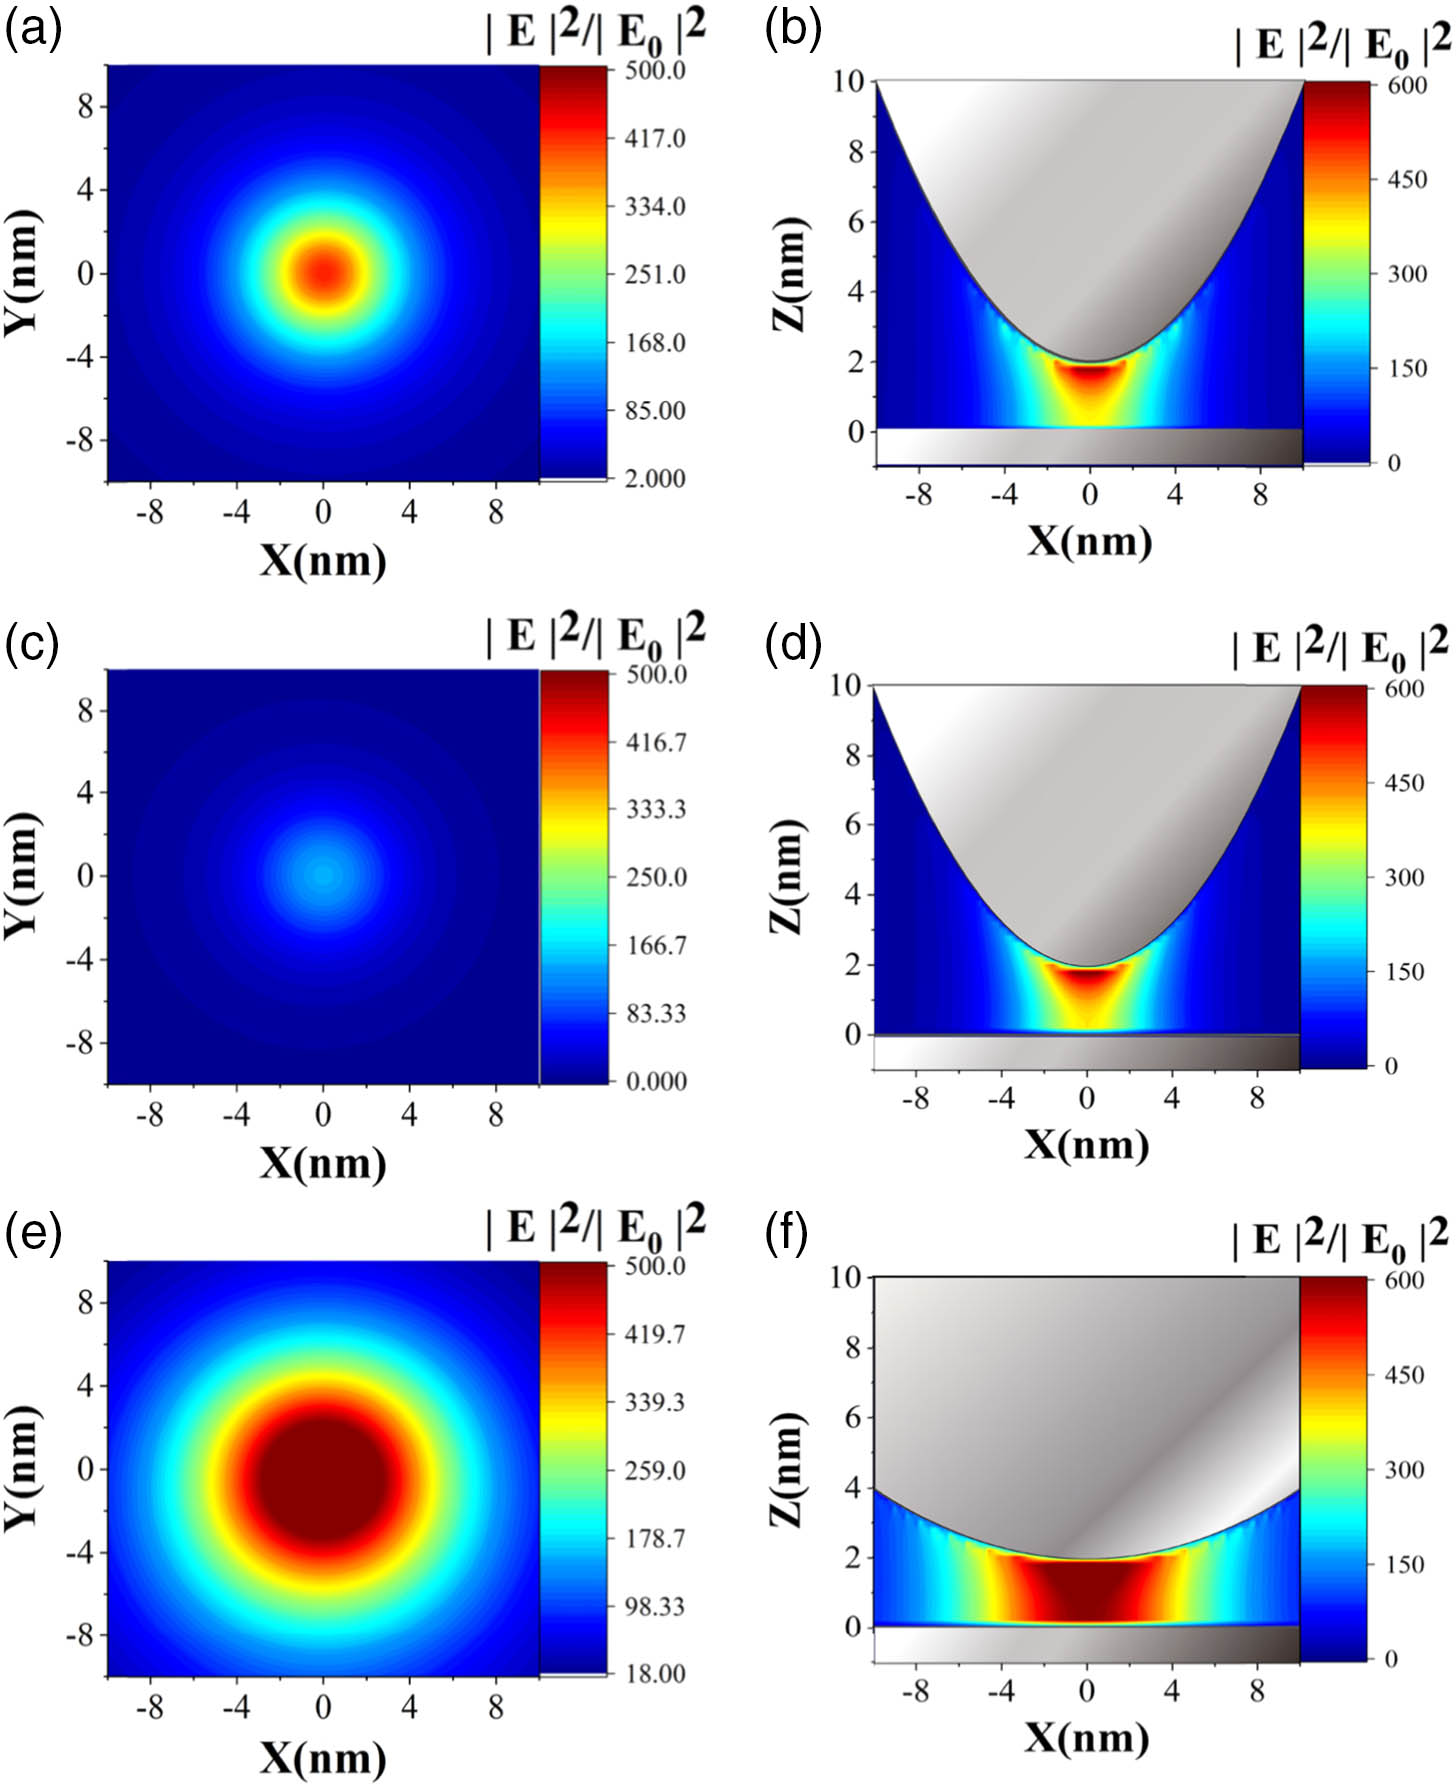
Fig. 3. (a), (b) The xy plane (z=1  nm) and xz plane electromagnetic field distribution of an Ag tip (curvature radius of 6.25 nm). (c), (d) The xy plane (z=1  nm) and xz plane electromagnetic field distribution of an Au tip (curvature radius of 6.25 nm). (e), (f) The xy plane (z=1  nm) and xz plane electromagnetic field distribution of an Ag tip (curvature radius of 25 nm).

下载图片 查看所有图片

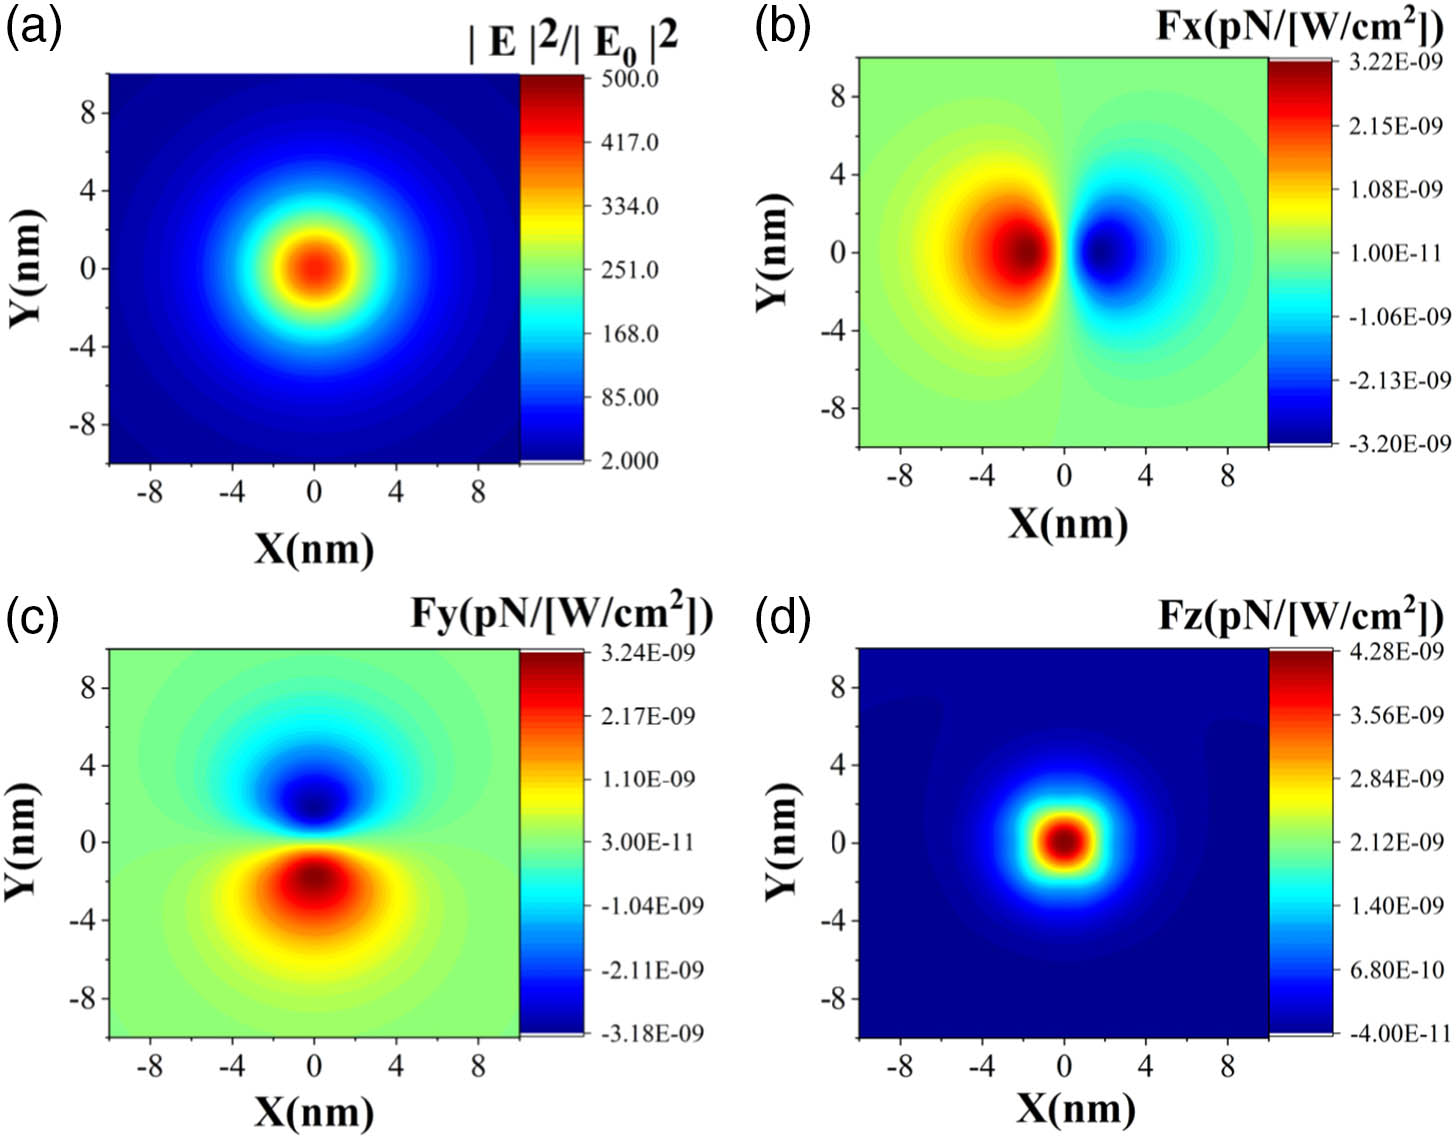
Since the incident light contains an electric field component in the z-axis direction, it can excite the nanogap mode between the tip and the substrate. We use the 3D FDTD method to calculate the local electric field intensity. The normalized optical intensity of the local field against the incident light intensity (with amplitude |E0|=1V/m) within the xy plane passing the nanogap center, namely, z=1  nm, is displayed in Fig. 4(a). We can find that this nanogap mode has an FWHM of about 5 nm, which is almost comparable with the size of a single molecule. In addition, a significant enhancement of local field intensity is observed. Then we place the molecule in various positions of this xy plane and analyze the distribution of the three vectorial components of gradient force upon the molecule. The distribution of the gradient force along the x-axis direction Fx is shown in Fig. 4(b). The light intensity at the center is the largest and the gradient force is directed to the center of the hot spot. Thus, the force distribution in the x-axis direction Fx is a restoring force directed to the center. The distribution of gradient force along the y-axis direction Fy is displayed in Fig. 4(c), which clearly shows that Fx and Fy are almost symmetrically distributed. This symmetry can largely be attributed to the circular symmetry of the geometric configuration of TERS, although the incident light has linear p polarization and has an inclination incident angle, which would make the light–plasmon interacting system no longer be in strict rotational symmetry. In addition, there is a potential well at the center to stabilize the captured molecule. From Fig. 4(d), it can be seen that the optical gradient force along the z-axis direction can reach about 109  pN/(W/cm2) at the center of the hot spot, which is large enough to capture the molecule. In addition, due to the tiny hot-spot size (<10  nm), this optical force allows tight capture of a molecule precisely within a specific site in space.

Fig. 4. Electric field and gradient force distribution in the xy plane located 1 nm below the Ag tip. (a) Electric field intensity distribution. Optical gradient force distribution for (b) x-axis, (c) y-axis, and (d) z-axis components.

下载图片 查看所有图片

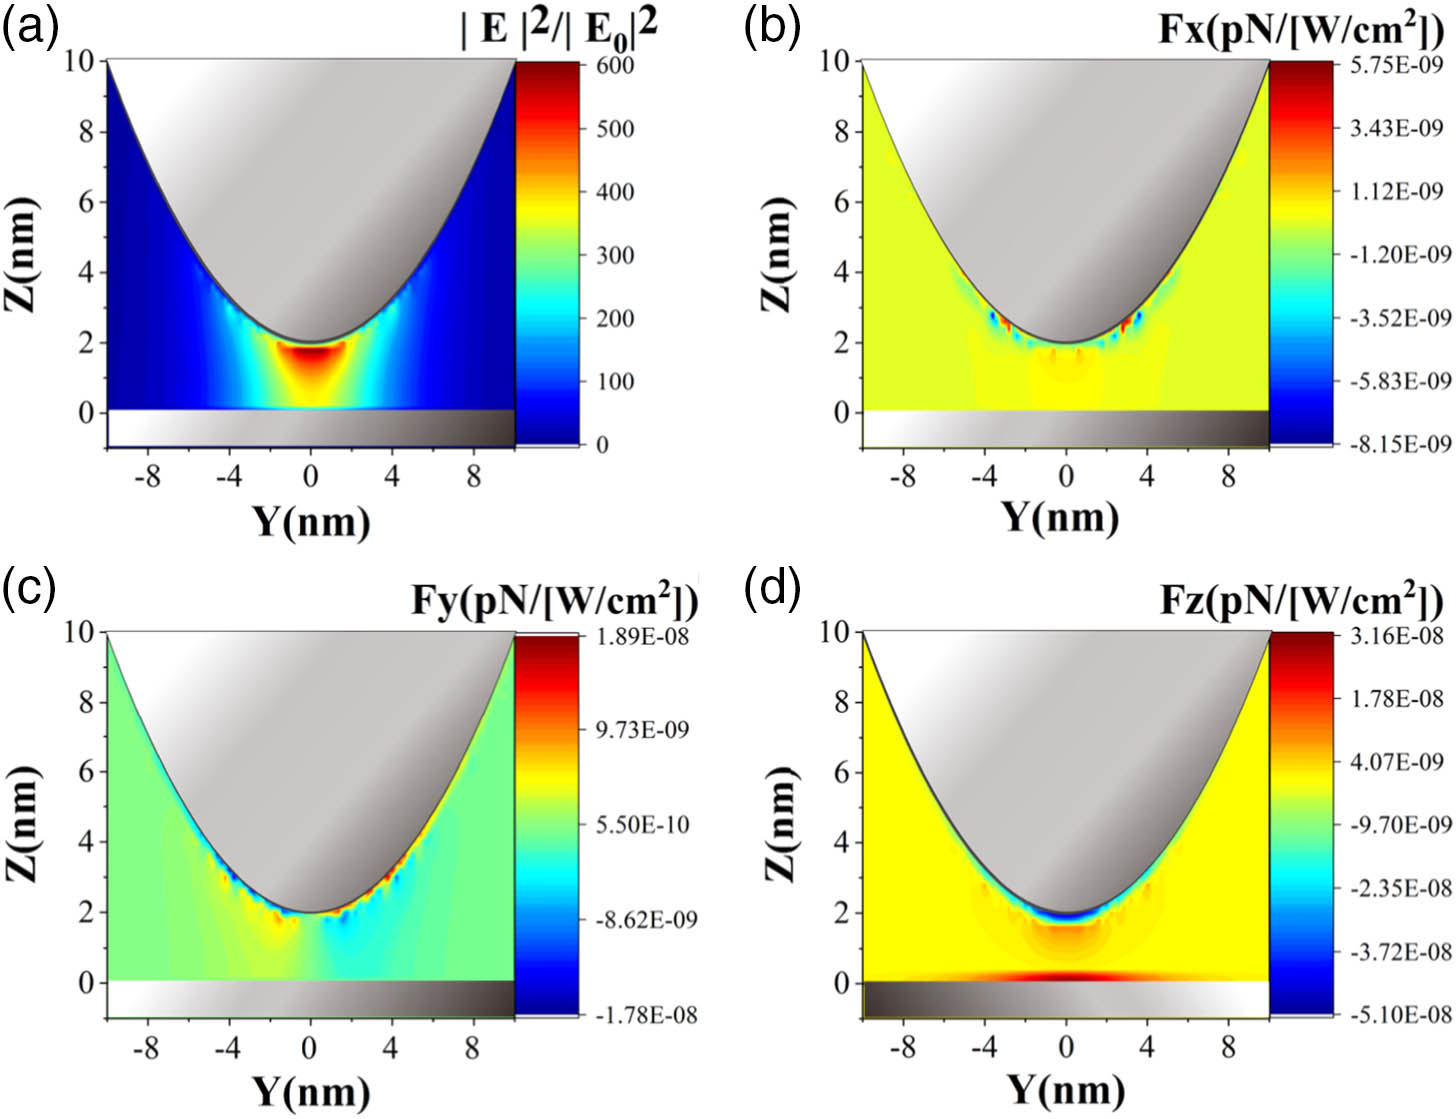
According to the above calculation results, the force of a single molecule in the nanogap plasmonic hot spot of the TERS system is similar to the situation of single laser beam optical tweezers. Yet, whether the molecule can be stably captured to the center of this hot spot depends on the longitudinal force and the radial force. The radial force traps the molecule toward the center of the nanogap, as shown in Fig. 4. How about the longitudinal force? For this purpose, we study the distribution of the longitudinal field and force distribution within the xz and yz planes, and the results are displayed in Figs. 5 and 6, respectively. We can see from these two figures that the electric field intensity distribution is basically the same in the xz and yz planes. Obviously, in either the xz plane or yz plane the radial gradient force at the center of the hot spot is zero. Therefore, the molecule will stabilize at the center of the hot spot and thus we can consider this hot-spot center as a stable capture point.
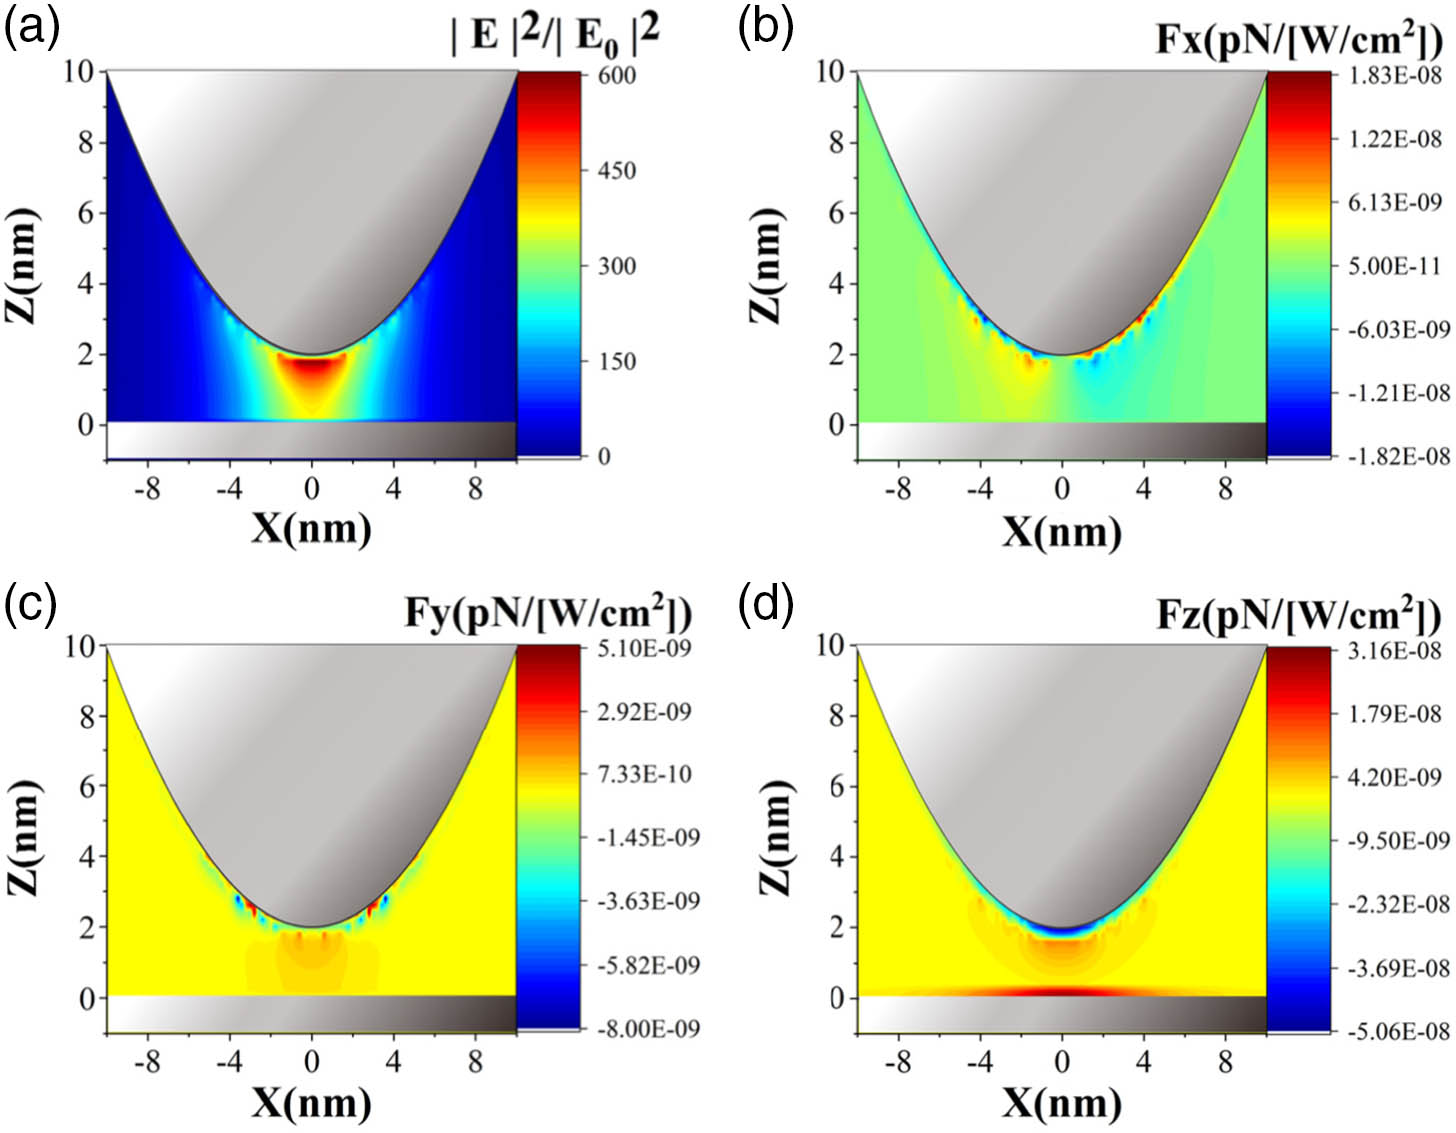
Fig. 5. xz plane field and gradient force distribution of the TERS system. (a) Electric field intensity distribution. Optical gradient force distribution for (b) x-axis, (c) y-axis, and (d) z-axis components.

下载图片 查看所有图片

Fig. 6. yz plane field and gradient force distribution of the TERS system. (a) Electric field intensity distribution. Optical gradient force distribution for (b) x-axis, (c) y-axis, and (d) z-axis components.

下载图片 查看所有图片

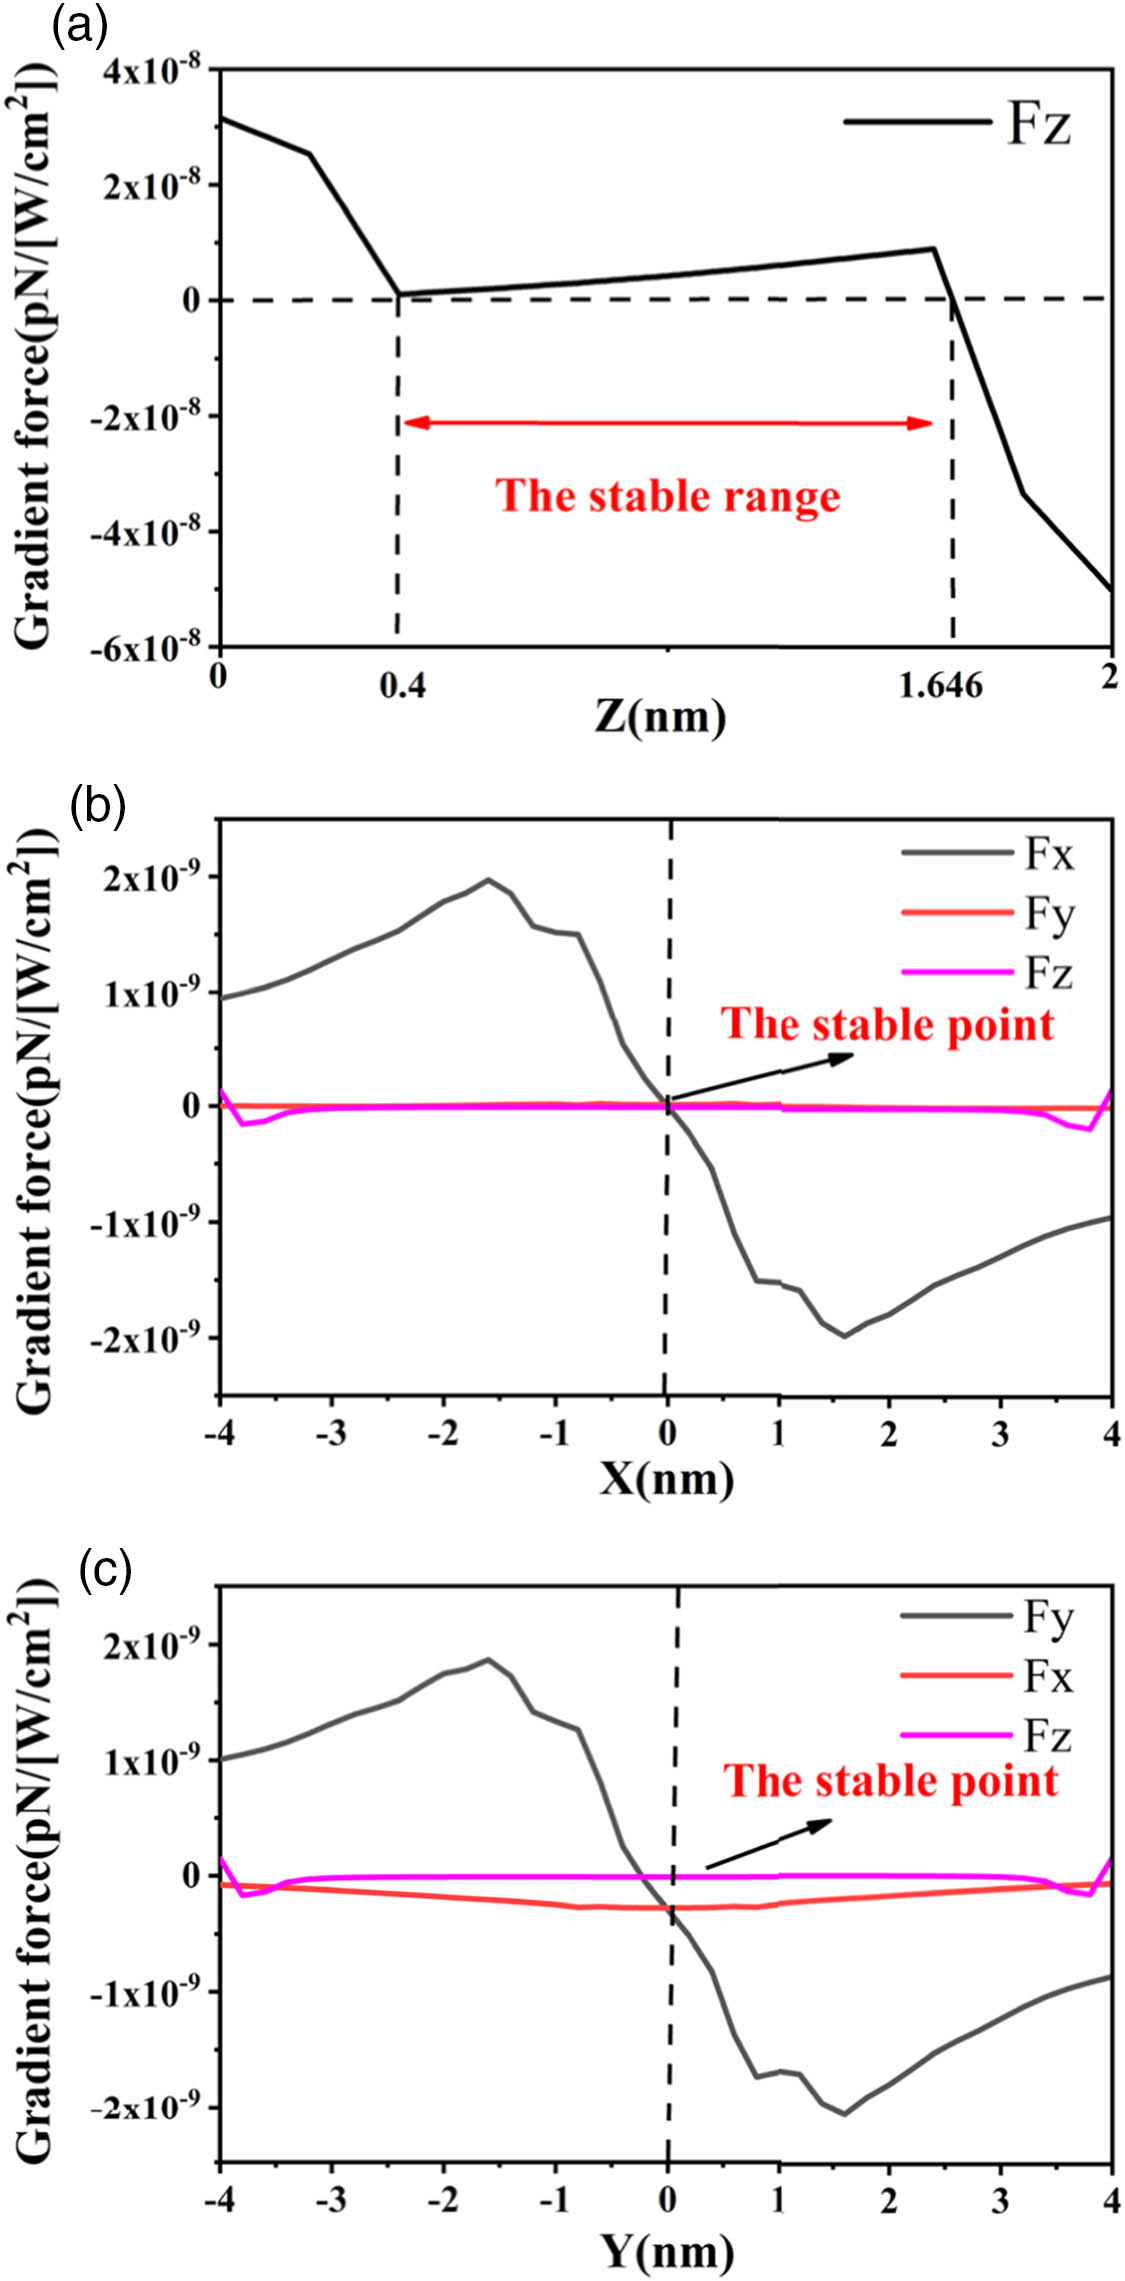
As shown in Figs. 5(d) and 6(d), the longitudinal force distribution (i.e., the z-axis force component Fz) of the molecule in the nanogap is greatly enhanced because the electromagnetic field is strongly enhanced at the tip and the silver substrate by exciting the nanogap plasmon. Figure 7(a) shows the longitudinal gradient force upon a single H2TBPP organic molecule in different positions in the z-axis direction. Note that z=0  nm represents the position of the metal substrate surface, while z=2  nm represents the position of the tip bottom surface. From the one-dimensional (1D) force curve we can find that the molecule is subject to a positive gradient force (namely, a force pushing the molecule up) when it is located near the silver substrate. On the other hand, when the molecule is located close to the tip bottom surface, it is subject to a negative force pulling it down. In addition, the optical force is very small (but not strictly zero) in the middle region of the nanogap (ranging between 0.4 and 1.65 nm).

Fig. 7. (a) One-dimensional distribution of the gradient force of the molecule along the z direction of the hot spot. One-dimensional gradient force distribution in the (b) x and (c) y directions of the hot-spot center (z=1.65  nm).

下载图片 查看所有图片

As a result, we believe that there exists a stable region of optical trapping in the longitudinal force of the molecule in this gap, rather than a single stable point in the usual situation of optical tweezers, as shown in Figs. 7(b) and 7(c) in the radial direction. As shown in Fig. 7(a), the longitudinal gradient force from z=0.4  nm to z=1.65  nm is several times smaller than the force from z=0  nm to z=0.4  nm and from z=1.65  nm to z=2  nm. It can be seen that the molecule can still be trapped in the middle region of the nanogap in the longitudinal direction. Furthermore, although in our simulations we have assumed the H2TBPP molecule is a point molecule with a certain polarizability, the 1  nm size of this stable optical trapping region is large enough to accommodate the H2TBPP molecule, which has a thickness of 0.5  nm.

To see whether this stable optical trapping region is a stable 3D optical trap for the molecule to be tightly captured, we examine the gradient force distribution in the xy plane intersecting with a point (z=1.65) in this longitudinal stable region. In particular, we display the 1D gradient force curve along the x-axis and y-axis, which is the radial force, in Figs. 7(b) and 7(c), respectively. This means that the x=y=0 point is the stable capture point of the molecule in the xy plane. When the molecule is located to the left of the stable capture point, the force is positive, and the axial force pushes it toward the stable capture point. On the other hand, when the particle is located to the right of the stable capture point, the force is negative, and the axial force pulls it back to the stable capture point. The gradient force curve clearly exhibits the characteristic of the restoring force in the conventional single laser beam optical tweezers, where the particle deviating from the stable trapping point will automatically return back to the pointing center and thus be bound to the focal spot of the laser beam. Summarizing Figs. 7(a)–7(c), it can be said that the cylindrical region centering at the point x=y=0 in the radial dimension, and ranging from z=0.4  nm to z=1.65  nm in the longitudinal dimension, is the stable capturing area in 3D space. This region represents the center of this nanoscale hot-spot-induced 3D optical trap that can capture the molecule. It can also be seen from Figs. 7(b) and 7(c) that when the molecule moves away from the trap center along the x-axis direction, there exists a very small residual y-axis optical force component in addition to the dominant x-axis restoring force component, whereas when the molecule moves away from the trap center along the y-axis direction, the residual x-axis force component is larger, but still much smaller than the dominant y-axis restoring force component. These features further confirm that the nanoscale hot spot does offer a 3D optical trap that can trap the molecule in 3D space.

We proceed to examine the quantity of the hot-spot optical trap in reference to the conventional single-beam optical tweezers, which can be well described by the optical trap stiffness. The optical trap stiffness, defined by the amount of change in the optical trap force right at the center of the optical trap against a unit distance of deviation, is an important parameter for describing the stability of the optical trap. We find the stiffness of single-beam tweezers is about 0.4  pN/[(W/cm2)·m] (the horizontal plane), as calculated from Fig. 2(b). Meanwhile, we calculate from Fig. 7 the stiffness of the TERS system and find that the radial stiffness of the hot-spot trap in the horizontal plane reaches a high value of about 2  pN/[(W/cm2)·m] (the horizontal plane), while the longitudinal average (z=0 to z=2  nm) stiffness of the hot-spot trap along the vertical axis direction reaches an even higher value of about 40  pN/[(W/cm2)·m]. Such values of stiffness are far larger than that of the conventional single-beam optical tweezers in the horizontal plane. The primary reason for this contrast is that the conventional optical tweezers have only a micrometer-scale focus spot and thus much less steep trapping potential. Thus, compared with the conventional single-beam optical tweezers, the TERS has a greater ability to tightly trap a molecule in a tiny space region at the vicinity of its tip via the formation of a nanoscale hot spot.

Note that in our above calculations, we have taken a point-dipole model, where the molecule is modeled as a point dipole without geometric size but only with a certain size of electric polarizability. We proceed to consider a much smaller molecule, such as a CH4 (with the radius of 0.2 nm) molecule placed in this 2 nm nanogap to study the longitudinal force. The point-dipole model becomes more accurate for this small molecule. Figure 8(a) (for tip curvature radius of 6.25 nm) and Fig. 8(b) (for tip curvature radius of 25 nm) show the longitudinal gradient force upon the molecule in different positions in the z-axis direction. The results show that the size of the molecule will not affect the stable area but will affect the strength of the molecule gradient force. The smaller the molecule, the weaker the gradient force. Meanwhile, the stable area will be slightly affected by the radius of curvature of the tip in the longitudinal direction. The reason is that the difference in the radius of curvature of the Ag tip will change the electromagnetic field distribution of the hot spot. As shown in Fig. 8(b), the longitudinal stability region of the tip with a radius of curvature of 25 nm is ranging from z=0.4  nm to z=1.61  nm.
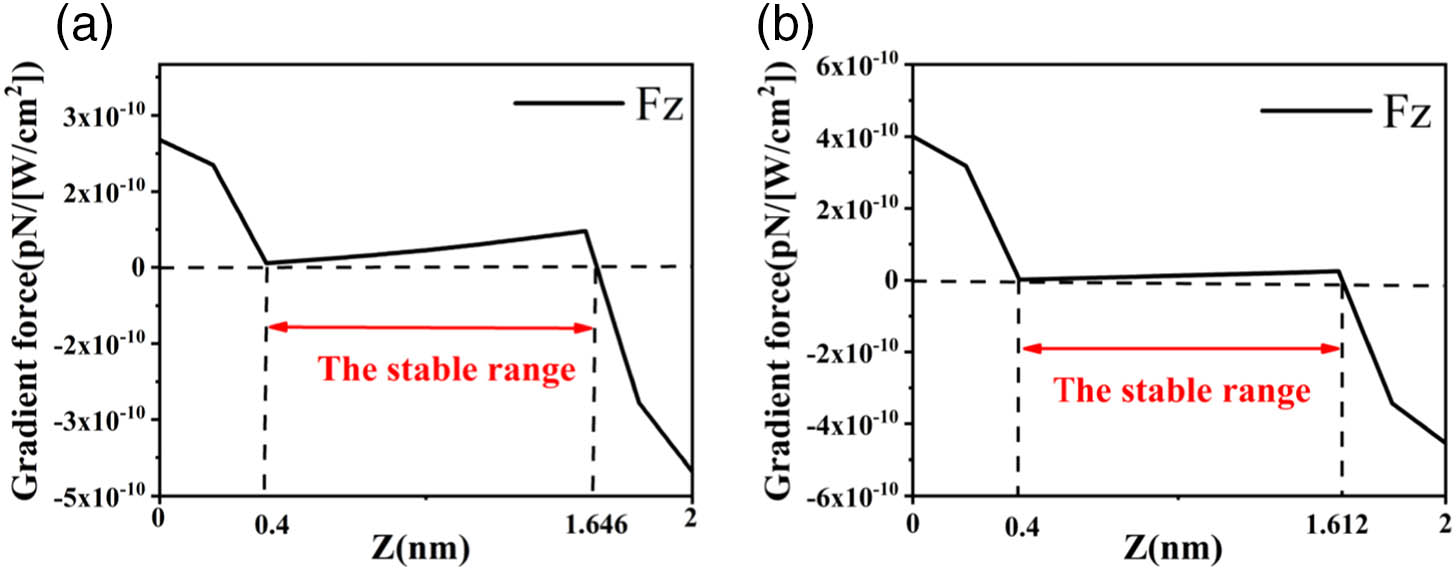
Fig. 8. One-dimensional distribution of the gradient force of a CH4 molecule along the z directions of the hot spot; (a) curvature radius of 6.25 nm, (b) curvature radius of 25 nm.

下载图片 查看所有图片

3. CONCLUSIONS

In summary, we have theoretically studied and analyzed the optical force of a molecule embedded within the nanoscale hot spot of the TERS system. Usually, this system is dominantly used as a powerful means to enhance, detect, and image the Raman scattering signal of a molecule. The localized surface plasmonic resonance within the nanogap between the TERS tip and substrate will induce a significant local electric field enhancement in the nanoscale hot spot. The major purpose of this work is to explore other physical effects that might be involved with this nanoscale hot spot in addition to the well-established Raman scattering of the molecule. The optical force comes into this scope of physical insight and landscape of physical picture.

For this purpose, we have systematically investigated the local electric field and field gradient of the nanogap plasmon hot spot in 3D space within and around the nanogap via 3D FDTD simulations, and made a careful analysis over their overall distribution pattern, from which the optical gradient force upon the molecule can be calculated and analyzed. We have found that, due to the highly localized electric field, a true 3D optical trap can form at the hot spot, which allows the molecule to be trapped in the hot spot. Moreover, the optical energy density and optical force acting on a molecule can be greatly enhanced to a level far exceeding the conventional single laser beam optical tweezers. Our calculation results have shown that the stiffness of the hot-spot trap can reach a high value of about 2  pN/[(W/cm2)·m] (the horizontal plane) and 40  pN/[(W/cm2)·m] (the vertical axis direction), which is far larger than the stiffness of single-beam tweezers, 0.4  pN/[(W/cm2)·m] (the horizontal plane). This hard-stiffness will enable the molecules to be stably captured in the plasmon hot spot. Our results indicate that TERS can become a promising tool of optical tweezers for trapping a microscopic object like molecules and doing Raman spectroscopic imaging and analysis at the same time. In addition, we expect the current work can open up a new avenue to deeply explore the multiphysics processes and effects that can exist and act simultaneously in the unique nanoscale hot spot offered by the TERS plasmonic nanogap. In some means, the well-established fluorescence and Raman scattering processes, the relatively less studied Rayleigh scattering process, and the optical force effect studied in this work are just some examples. This suggests that one can explore, examine, and analyze more deeply and systematically various optical, electronic, chemical, and mechanical processes and effects acting upon a molecule located within such a plasmonic nanogap. The results surely will greatly expand and deepen our understanding, knowledge, and insight on light–matter interaction at nanoscale and even atomic scale in these plasmonic nanostructures.

References

[1] A. Ashkin, J. M. Dziedzic, J. E. Bjorkholm, S. Chu. Observation of a single-beam gradient force optical trap for dielectric particles. Opt. Lett., 1986, 11: 288-290.

[2] M. L. Juan, M. Righini, R. Quidant. Plasmon nano-optical tweezers. Nat. Photonics, 2011, 5: 349-356.

[3] D. G. Grier. A revolution in optical manipulation. Nature, 2003, 424: 810-816.

[4] V. Garcés-Chávez, D. McGloin, H. Melville, W. Sibbett, K. Dholakia. Simultaneous micromanipulation in multiple planes using a self-reconstructing light beam. Nature, 2002, 419: 145-147.

[5] L. Jing, L. Zhiyuan. Controlled mechanical motions of microparticles in optical tweezers. Micromachines, 2018, 9: 232.

[6] H. L. Guo, Z. Y. Li. Optical tweezers technique and its applications. Sci. China Phys. Mech. Astron., 2013, 56: 2351-2360.

[7] A. Ashkin. History of optical trapping and manipulation of small-neutral particle, atoms, and molecules. IEEE J. Sel. Top. Quantum Electron., 2000, 6: 841-856.

[8] BornM.WolfE., Principles of Optics (Pergamon, 1975).

[9] D. G. Grier. A revolution in optical manipulation. Nature, 2003, 424: 810-816.

[10] F. Svedberg, Z. Li, H. Xu, M. Käll. Creating hot nanoparticle pairs for surface-enhanced Raman spectroscopy through optical manipulation. Nano Lett., 2006, 6: 2639-2641.

[11] S. Rao, S. Raj, S. Balint, C. B. Fons, S. Campoy, M. Llagostera, D. Petrov. Single DNA molecule detection in an optical trap using surface-enhanced Raman scattering. Appl. Phys. Lett., 2010, 96: 213701.

[12] G. Volpe, R. Quidant, G. Badenes, D. Petrov. Surface plasmon radiation forces. Phys. Rev. Lett., 2006, 96: 238101.

[13] M. Righini, A. S. Zelenina, C. Girard, R. Quidant. Parallel and selective trapping in a patterned plasmonic landscape. Nat. Phys., 2007, 3: 477-480.

[14] M. Righini, G. Volpe, C. Girard, D. Petrov, R. Quidant. Surface plasmon optical tweezers: tunable optical manipulation in the femtonewton range. Phys. Rev. Lett., 2008, 100: 186804.

[15] R. Quidant, C. Girard. Surface-plasmon-based optical manipulation. Laser Photonics Rev., 2008, 2: 47-57.

[16] K. Wang, E. Schonbrun, K. B. Crozier. Propulsion of gold nanoparticles with surface plasmon polaritons: evidence of enhanced optical force from near-field coupling between gold particle and gold film. Nano Lett., 2009, 9: 2623-2629.

[17] W. Zhang, L. Huang, C. Santschi, O. J. F. Martin. Trapping and sensing 10 nm metal nanoparticles using plasmonic dipole antennas. Nano Lett., 2010, 10: 1006-1011.

[18] M. L. Juan, M. Righini, R. Quidant. Plasmon nano-optical tweezers. Nat. Photonics, 2011, 5: 349-356.

[19] B. J. Roxworthy, K. D. Ko, A. Kumar, K. H. Fung, E. K. Chow, G. L. Liu, N. X. Fang, K. C. Toussaint. Application of plasmonic Bowtie nanoantenna arrays for optical trapping, stacking, and sorting. Nano Lett., 2012, 12: 796-801.

[20] C. Min, Z. Shen, J. Shen, Y. Zhang, H. Fang, G. Yuan, L. Du, S. Zhu, T. Lei, X. Yuan. Focused plasmonic trapping of metallic particles. Nat. Commun., 2013, 4: 2891.

[21] Z. Y. Li. Mesoscopic and microscopic strategies for engineering plasmon-enhanced Raman scattering. Adv. Opt. Mater., 2018, 6: 1701097.

[22] J. F. Li, J. Liu, X. M. Tian, Z. Y. Li. Plasmonic particles with unique optical interaction and mechanical motion properties. Part. Part. Syst. Charact., 2017, 34: 1600380.

[23] C. Zhang, B. Q. Chen, Z. Y. Li. Optical origin of subnanometer resolution in tip-enhanced raman mapping. J. Phys. Chem. C, 2015, 119: 11858-11871.

[24] R. Zhang, Y. Zhang, Z. C. Dong, S. Jiang, C. Zhang, L. G. Chen, L. Zhang, Y. Liao, J. Aizpurua, Y. Luo, J. L. Yang, J. G. Hou. Sub-nm chemical mapping of a single molecule by plasmon enhanced Raman scattering. Nature, 2013, 498: 82-86.

[25] L. Joonhee, K. T. Crampton, N. Tallarida, V. A. Apkarian. Visualizing vibrational normal modes of a single molecule with atomically confined light. Nature, 2019, 568: 78-82.

[26] P. B. Johnson, R. W. Christy. Optical constants of the noble metals. Phys. Rev. B, 1972, 6: 4370-4379.

[27] J. P. Barton, D. R. Alexander, S. A. Schaub. Internal and near‐surface electromagnetic fields for a spherical particle irradiated by a focused laser beam. J. Appl. Phys., 1988, 64: 1632-1639.

[28] J. P. Barton, D. R. Alexander, S. A. Schaub. Theoretical determination of net radiation force and torque for a spherical particle illuminated by a focused laser beam. J. Appl. Phys., 1989, 66: 4594-4602.

[29] Y. Harada, T. Asakura. Radiation forces on a dielectric sphere in the Rayleigh scattering regime. Opt. Commun., 1996, 124: 529-541.

[30] J. P. Gordon. Radiation forces and momenta in dielectric media. Phys. Rev. A, 1973, 8: 14-21.

Li Long, Jianfeng Chen, Huakang Yu, Zhi-Yuan Li. Strong optical force of a molecule enabled by the plasmonic nanogap hot spot in a tip-enhanced Raman spectroscopy system[J]. Photonics Research, 2020, 8(10): 10001573.


引用该论文: TXT   |   EndNote

相关论文

加载中...

关于本站 Cookie 的使用提示

中国光学期刊网使用基于 cookie 的技术来更好地为您提供各项服务,点击此处了解我们的隐私策略。 如您需继续使用本网站,请您授权我们使用本地 cookie 来保存部分信息。
全站搜索
您最值得信赖的光电行业旗舰网络服务平台!