High Power Laser Science and Engineering, 2016, 4 (3): 03000e22, Published Online: Nov. 7, 2016
Probing the ultrafast dynamics in nanomaterial complex systems by femtosecond transient absorption spectroscopy  Download: 973次
Figures & Tables
Fig. 1. Schematic illustration of the three, major contributions (i.e., GSB, SE, and ESA) to a typical ${\it\Delta}A$ spectrum (at a certain time delay ${\it\tau}$ between the pump and the probe), as marked in the left panel[14], where the profile labeled ‘Sum’ (thickened solid line) represents the realistic ‘overlapping’ ${\it\Delta}A$ spectrum visualized by the spectrometer. The right panel depicts the corresponding, three processes monitored in a time-resolved pump–probe configuration (with a WLC probe, typically).
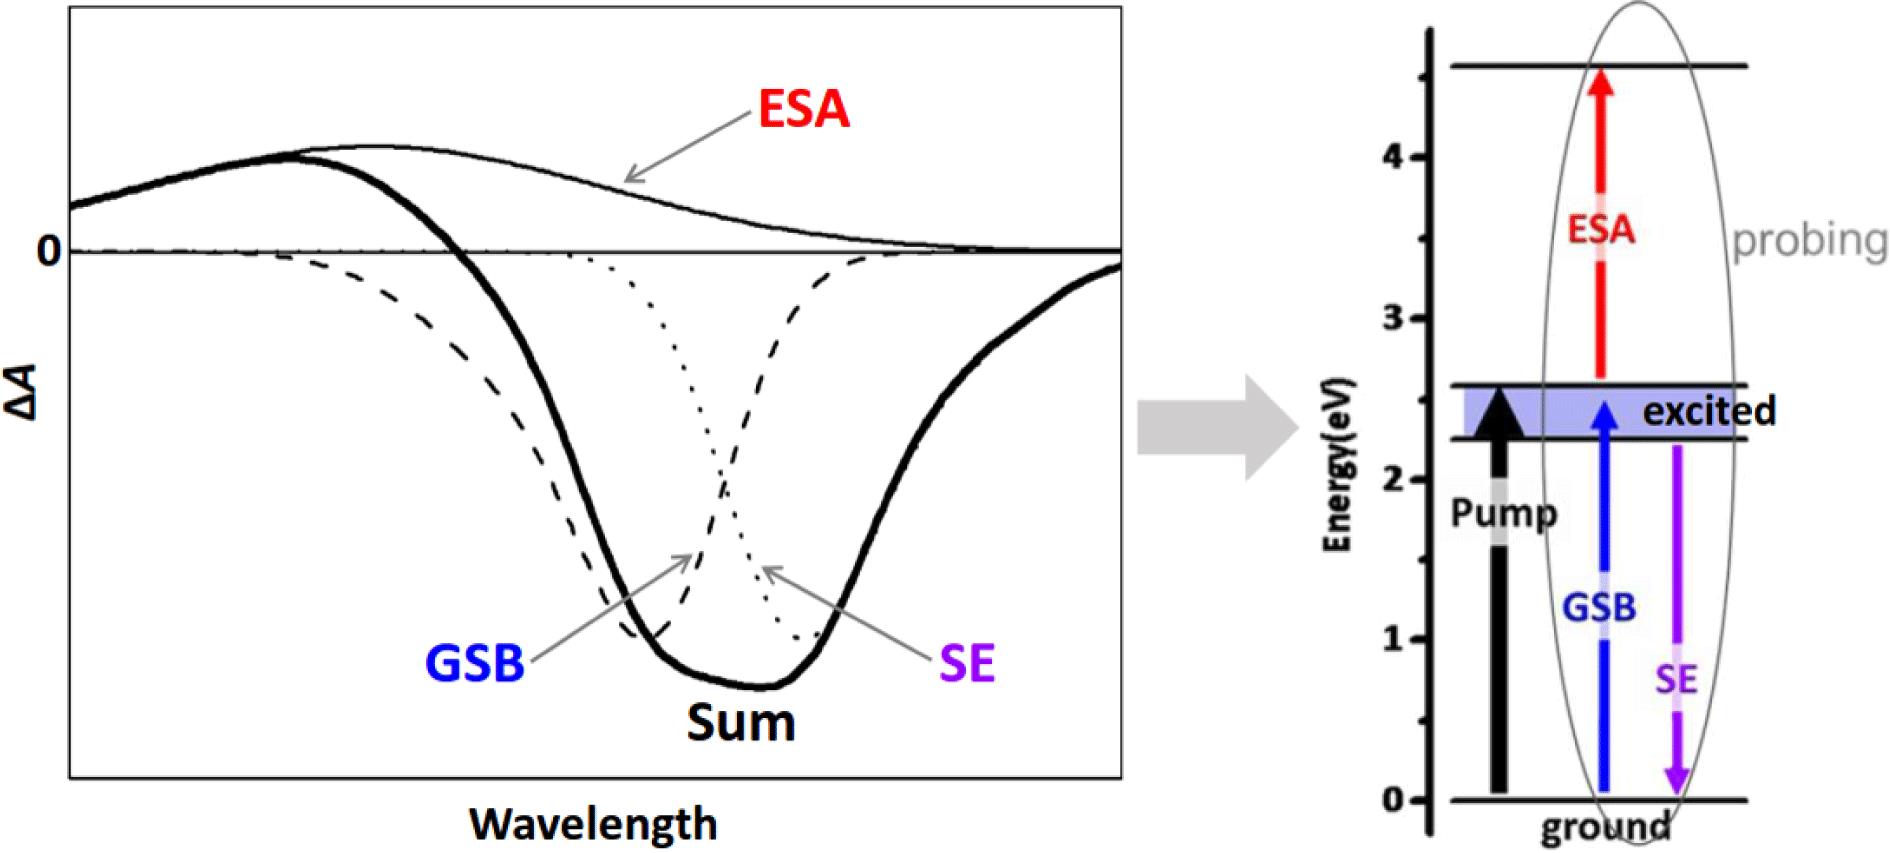
Fig. 2. (a) Schematic optical layout of a typical ultrafast TA setup that features a tunable pump (delivered by a femtosecond optical parametric amplifier) and a broadband WLC probe (generated by focusing a small portion of the Ti:sapphire regenerative amplifier output in a transparent nonlinear crystal). (b) The CDP ExciPro femtosecond pump–probe system that operates in our ultrafast spectroscopy laboratory at USTC[15].

Fig. 3. (a) ${\it\Delta}A({\it\lambda},{\it\tau})$ spectra recorded on the highly oxidized, as-synthesized GO ($\text{C}/\text{O}\approx 2.7/1$ ) samples using a 570-nm pump and a WLC probe (490–530 nm for blue-shifted probing and 630–770 nm for red-shifted probing). (b) Schematic illustration of the band structure of the graphene–ORD model as well as the VB-hole blockade effect responsible for the type-I graphene-like dynamics observed in the blue-shifted probing regime. (c) A typical type-I kinetic trace extracted from the line cutting at 520 nm in (a). (d) A representative kinetic trace observed in pristine graphene[23] for comparison with (c). All the figures are adapted from Ref. [20].

Fig. 4. (a) Schematic of the three-dimensional network of PCN-222 that features large channels running through the $c$ -axis. (b) The amount of $\text{HCOO}^{-}$ produced as a function of the time of Visible-light irradiation over (i) PCN-222, (ii) H2TCPP, (iii) no PCN-222, (iv) no TEOA, and (v) no CO2. A Xe lamp was filtered to produce light in 420–800 nm. (c) ${\it\Delta}A$ spectra of PCN-222 recorded at different probe delays (pump at 500 nm). (d) A representative ${\it\Delta}A$ kinetic trace of PCN-222 probed at 430 nm. (e) Schematic illustration of the photoexcited dynamics involved in H2TCPP (left) and PCN-222 (right). All the figures are adapted from Ref. [26].

Fig. 5. (a) Schematic illustration of the synthesized Cu3(BTC)2@TiO2 core–shell structure. (b) Production yields of CH4 and H2 from CO2 using Cu3(BTC)2@TiO2 as photocatalysts under the UV irradiation for 4 h, in reference to bare TiO2 and bare Cu3(BTC)2. All the samples were carefully pretreated to remove any carbon contaminants. (c) Representative ${\it\Delta}A$ kinetic traces for bare TiO2, bare Cu3(BTC)2, and Cu3(BTC)2@TiO2, probed at 450, 600, and 600 nm, respectively (pump at 350 nm). (d) Schematic illustration of the mechanisms involving the interface states-related electron transfer and relaxation dynamics. All the figures are adapted from Ref. [28].

Fig. 6. (a) Production yield of gluconic acid (in 2 h) versus the UV-light incident power using Pd–TiO2 as catalysts (in reference to Pd nanocubes and bare TiO2), showing a ${\it\Lambda}$ -shaped relationship. (b) Representative ${\it\Delta}A$ kinetic traces (left: 0–2 ns, right: 0–30 ps; probe at 520 nm) recorded with a 480-nm pump. (c) Schematic illustration of the mechanisms involving the electron transfer and relaxation dynamics under the 480-nm photoexcitation. (d) Representative ${\it\Delta}A$ kinetic traces (left: 0–2 ns, right: 0–30 ps; probe at 520 nm) recorded with a 350-nm pump. (e) Schematic illustration of the mechanisms involving the electron transfer and relaxation dynamics under the 350-nm photoexcitation. All the figures are adapted from Ref. [30].

Fig. 7. (a) Schematic illustration of molecular co-catalysis strategy for accelerating hole transfer. Homogeneous molecular co-catalysts use reversible redox couple and highly active free radical reactions to promote hole transfer, unlike the conventional, supported heterogeneous co-catalysts that are constrained by finite contact areas between co-catalysts and reactants. (b) Photocatalytic activity on the K4Nb6O17 nanosheet catalysts with different molar ratio of TFA/K4Nb6O17. Reaction conditions: 50 mg catalyst, 200 mL 20 vol% methanol aqueous solution, and a specific amount of TFA, under irradiation of a 300-W Xe lamp. Representative ${\it\Delta}A$ kinetics probed at 500 nm (pump at 300 nm) for K4Nb6O17 in (c) the absence and (d) the presence of TFA. (e) Steady-state and (f) time-resolved PL spectra (excitation at 315 nm; emission at 430 nm) for both K4Nb6O17 and K4Nb6O17–TFA. (g) Schematic illustration of the charge separation mechanisms involving the electron/hole defect states-related dynamics. All the figures are adapted from Ref. [32].

Qun Zhang, Yi Luo. Probing the ultrafast dynamics in nanomaterial complex systems by femtosecond transient absorption spectroscopy[J]. High Power Laser Science and Engineering, 2016, 4(3): 03000e22.


 PDF全文
PDF全文

