2.8 μm增益开关Er∶ZBLAN光纤激光器的数值模拟  下载: 941次
Numerical Simulation of 2.8 μm Gain-Switched Er∶ZBLAN Fiber Laser
1 西北核技术研究所激光与物质相互作用国家重点实验室, 陕西 西安 710024
2 中国科学院西安光学精密机械研究所瞬态光学与光子技术国家重点实验室, 陕西 西安 710119
3 西安交通大学电子与信息工程学院陕西省信息光子技术重点实验室, 陕西 西安 710049
图 & 表
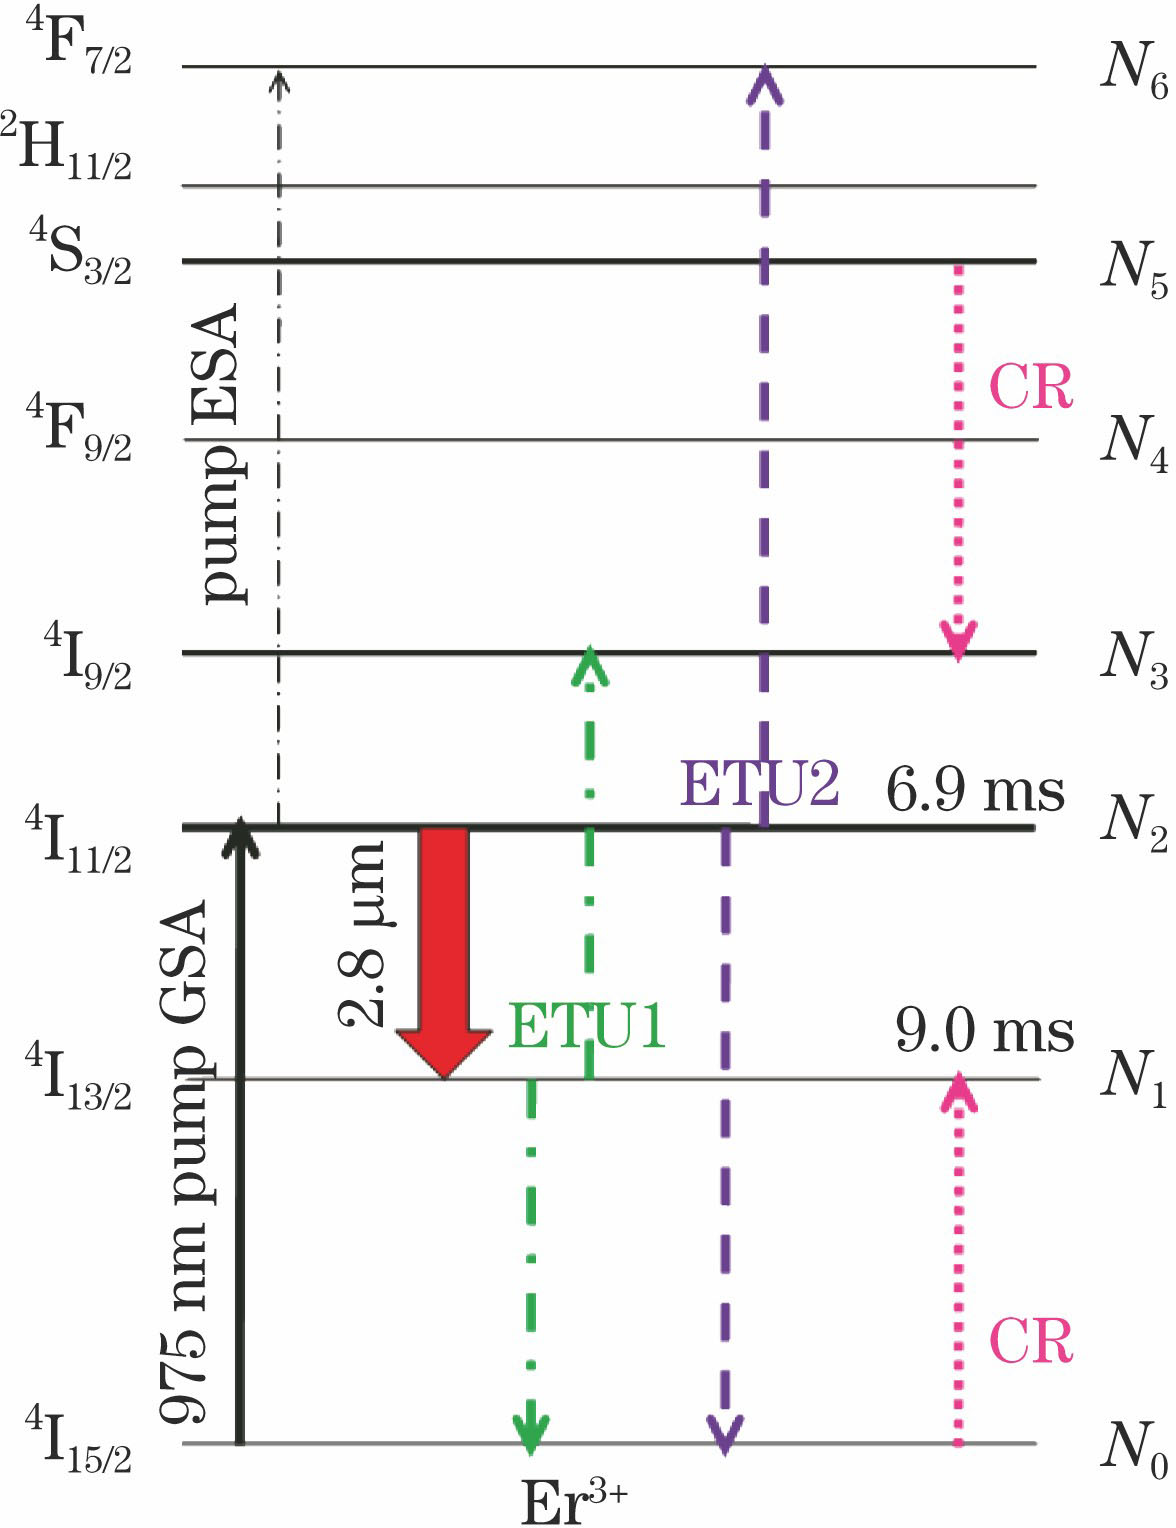
图 1. 2.8 μm Er3+∶ZBLAN光纤激光器能级结构图
Fig. 1. Diagram of energy levels relevant to 2.8 μm Er3+∶ZBLAN fiber laser
下载图片 查看原文
图 2. 稳定脉冲形成过程
Fig. 2. Process of stable pulse generation
下载图片 查看原文
图 3. 单周期内各能级粒子数和抽运光、信号光功率随时间的变化过程
Fig. 3. Variations in particle number of each energy level, pump power, and output power with time in one period
下载图片 查看原文
图 4. 单周期内抽运光、信号光功率随位置和时间的变化。(a) Ps-forward; (b) Ps-backward; (c) Pp-forward; (d) Pp-backward
Fig. 4. Pump power and signal power as functions of position and time in one period. (a) Ps-forward; (b) Ps-backward; (c) Pp-forward; (d) Pp-backward
下载图片 查看原文
图 5. 不同耦合率时激光脉冲形态。(a) ROC=0.04; (b) ROC=0.28; (c) ROC=0.4; (d) ROC=0.72
Fig. 5. Pulse shapes taken under different coupling efficiencies. (a) ROC=0.04; (b) ROC=0.28; (c) ROC=0.4; (d) ROC=0.72
下载图片 查看原文
图 6. 耦合率对激光器输出特性的影响。(a)输出功率;(b)脉宽、峰值功率、脉冲能量
Fig. 6. Effect of coupling efficiency on output characteristics of lasers. (a) output power; (b) pulse width, peak power, and pulse energy
下载图片 查看原文
图 7. 不同抽运功率时的输出激光脉冲形态。(a)~(f)为本文计算结果;(g)~(i)为文献[
15]报道的实验结果
Fig. 7. Shapes of output pulses with different pump power. (a)-(f) Calculated results in this paper; (g)-(i) experimental results from Ref. [15]
下载图片 查看原文
表 1Er3+离子光谱常数[18]
Table1. Spectroscopic constants of Er3+[18]
| Parameter | Value |
|---|
| /ms | 9.0 | | /ms | 6.9 | | /μs | 10 | | /μs | 120 | | /μs | 570 | | /μs | 5 | | β10 | 1 | | β21, β20 | 0.37, 0.63 | | β32, β31, β30 | 0.99, 0,0.001 | | β43, β42, β41, β40 | 0.85, 0.006, 0.004, 0.14 | | β54, β53, β52, β51, β50 | 0.34, 0.012, 0.015, 0.18, 0.44 | | β65 | 0.99 |
|
查看原文
表 2可变光谱参数和光纤参数[22-23]
Table2. Variable spectroscopic parameters and fiber parameters
| Parameter | Value |
|---|
| /m | 975×10-9 | | /m | 2.8×10⁻⁶ | | /m2 | 2.1×10⁻²⁵ | | /m2 | 1.1×10⁻²⁵ | | 0.16 | | b1 | 0.1 | | α /m-1 | 0.041 | | /m-3 | 9.6×1026(mole fraction: 6%) | 11.2×1026(mole fraction: 7%) | | /m2 | 4.2×10⁻²⁵ | 3.0×10⁻²⁵ | | /(m3·s-1) | 1.0×10⁻²⁴ | 1.28×10⁻²⁴ | | /(m3·s-1) | 0.3×10⁻²⁴ | 0.36×10⁻²⁴ | | /(m3·s-1) | 0.5×10⁻²⁴ | 0.54×10⁻²⁴ |
|
查看原文
表 3本文计算结果与已报道实验和建模计算结果对比
Table3. Simulated results in this paper compared with previous experimental and theoretical results
| Parameter | Experiment in Ref. [22] | Model 1 in Ref. [18] | Model 1 in this paper | Experiment in Ref. [23] | Model 2 in Ref. [18] | Model 2 in this paper |
|---|
| Slope efficiency /% | 24.2 | 27.8 | 26.5 | 24 | 23.4 | 23.2 | | Threshold /W | 0.9 | 0.95 | 1.02 | ~0.3 | 0.24 | 0.35 | | Note: Model 1 was built with the parameters in Ref. [22]; model 2 was built with the parameters in Ref. [23]. |
|
查看原文
栾昆鹏, 沈炎龙, 陶蒙蒙, 朱峰, 黄超, 谌鸿伟, 易爱平. 2.8 μm增益开关Er∶ZBLAN光纤激光器的数值模拟[J]. 光学学报, 2019, 39(7): 0714001. Kunpeng Luan, Yanlong Shen, Mengmeng Tao, Feng Zhu, Chao Huang, Hongwei Chen, Aiping Yi. Numerical Simulation of 2.8 μm Gain-Switched Er∶ZBLAN Fiber Laser[J]. Acta Optica Sinica, 2019, 39(7): 0714001.


 PDF全文
PDF全文

