Imaging process and signal-to-noise ratio improvement of enhanced self-heterodyne synthetic aperture imaging ladar  Download: 816次
1 Key Laboratory of Space Laser Communication and Detection Technology, Shanghai Institute of Optics and Fine Mechanics, Chinese Academy of Science, Shanghai 201800, China
2 University of Chinese Academy of Sciences, Beijing 100049, China
Figures & Tables
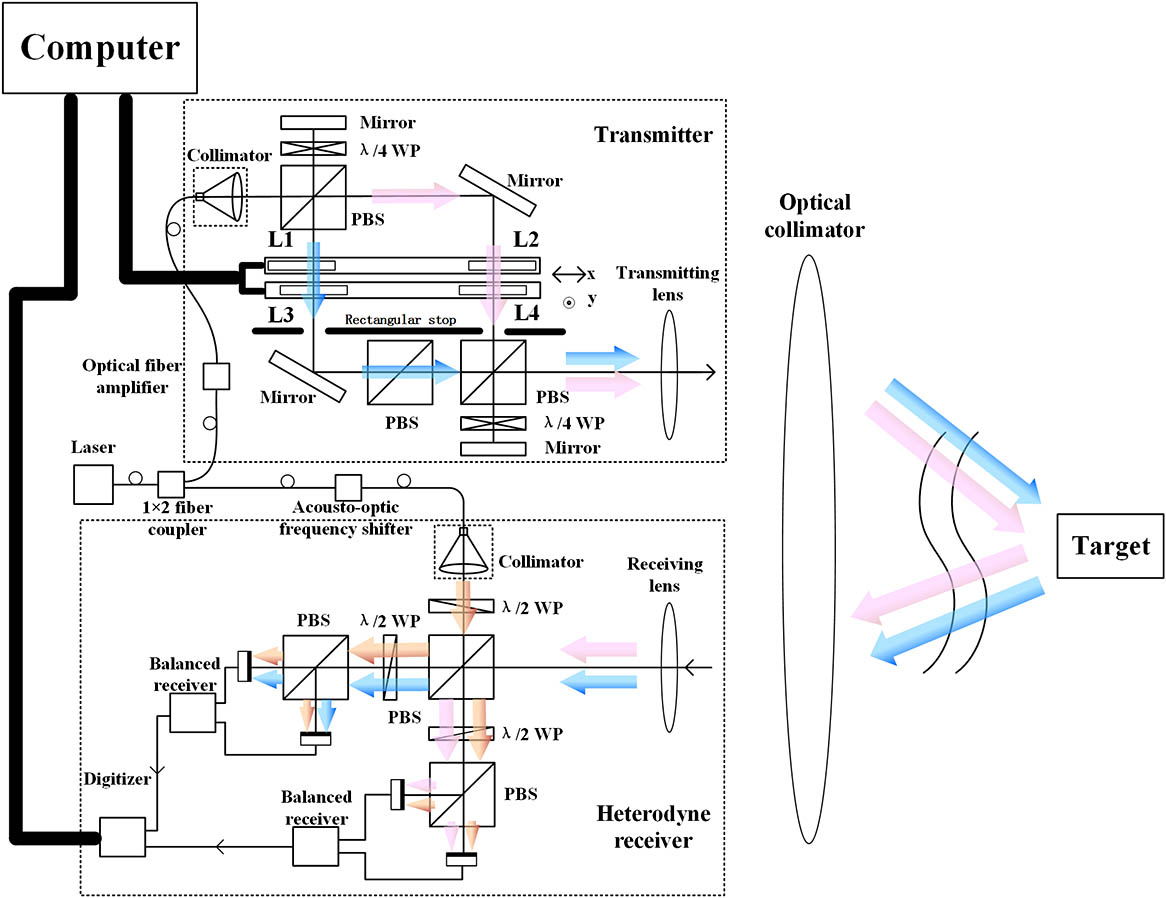
Fig. 1. Structure of the enhanced self-heterodyne SAIL system. PBS: polarizing beam splitter; WP: wave plate.
下载图片 查看原文
Fig. 2. Configuration to translate the wavefront using cylindrical lenses; x means the cylindrical lenses L1 and L2 are moving in the direction orthogonal to the direction of travel, y means the cylindrical lenses L3 and L4 are moving in the travel direction.
下载图片 查看原文
Fig. 3. (a) Magnitude and (b) phase distributions of the focused image in the orthogonal direction of travel and (c) a 2D image focused subsequently in the travel direction for a point target. The distribution of the final image is (d) in orthogonal direction and (e) in the travel direction for a point target.
下载图片 查看原文
Fig. 4. (a), (b), and (c) are the final images for a point target at output power of 15 mW, 2 mW, and 750 μW of the optical fiber amplifier. (d), (e), and (f) are the distribution of the final image in the travel direction for a point target at the output powers of 15 mW, 2 mW, and 750 μW of the optical fiber amplifier.
下载图片 查看原文
Fig. 5. Self-heterodyne receiver in the down-looking SAIL.
下载图片 查看原文
Fig. 6. (a), (b), and (c) are the final images for a point target in the down-looking SAIL at the output powers of 15 mW, 2 mW, and 750 μW of the optical fiber amplifier. (d), (e), and (f) are final images in the travel direction for a point target in the down-looking SAIL at the output powers of 15 mW, 2 mW, and 750 μW of the optical fiber amplifier.
下载图片 查看原文
Table1. SNR of Point Target Final Image in Enhanced Self-heterodyne SAIL System
| Output power of the optical fiber amplifier | Intensity of point target | Intensity of noise | |
|---|
| 15 mW | 11271 | 91 | 124 | | 2 mW | 1641 | 15 | 109 | | 750 μW | 364 | 6 | 61 |
|
查看原文
Table2. SNR of Point Target Final Image in Down-looking SAIL
| Output power of the optical fiber amplifier | Intensity of point target | Intensity of noise | |
|---|
| 15 mW | 375.28 | 3.87 | 97 | | 2 mW | 61.59 | 2.37 | 26 | | 750 μW | 15.5 | 2.46 | 6 |
|
查看原文
Guo Zhang, Jianfeng Sun, Yu Zhou, Zhiyong Lu, Guangyuan Li, Guangyu Cai, Mengmeng Xu, Bo Zhang, Chenzhe Lao, Hongyu He, Liren Liu. Imaging process and signal-to-noise ratio improvement of enhanced self-heterodyne synthetic aperture imaging ladar[J]. Chinese Optics Letters, 2017, 15(10): 102801.


 PDF全文
PDF全文

