中国激光, 2019, 46 (1): 0104005, 网络出版: 2019-01-27
基于旋转差值核估计的激光雷达点云建筑物边缘提取  下载: 795次
Building Edge Extraction from LiDAR Point Cloud Based on Rotational Difference Kernel Estimation
图 & 表
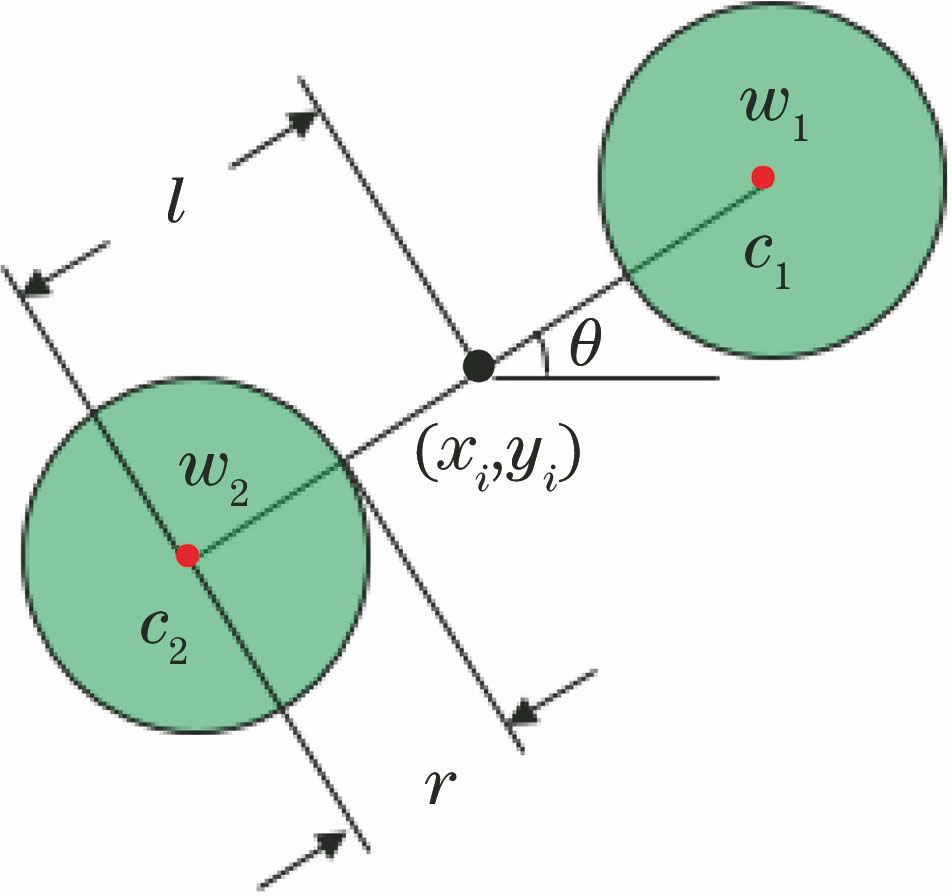
图 2. 正好取得与没有取得MRDKE(xi,yi,θ*)时的对称窗口示意图
Fig. 2. Schematic of symmetric windows of MRDKE(xi,yi,θ*) obtained and not obtained

图 3. 测试数据的LiDAR点云与光学影像。(a)测试数据的LiDAR点云;(b)测试数据的光学影像
Fig. 3. LiDAR point cloud data and optical image for test data. (a) LiDAR point cloud for test data; (b) optical image for test data

图 4. 测试点云数据中不同区域的数据点对应的对称窗口连线方向及MRDKE(xi,yi,θ*)和σi(θ*)大小。(a)连线方向与MRDKE(xi,yi,θ*)大小;(b)连线方向与σi(θ*)大小
Fig. 4. Directions of symmetrical window connection corresponding to the data points in different regions in the test LiDAR point cloud data and the magnitude of MRDKE(xi, yi, θ*) and σi(θ*). (a) Connection directions and the magnitude of MRDKE(xi, yi, θ*); (b) connection directions and the magnitude of σi(θ*)

图 5. 数据点i和窗口的移动示意图。(a) θ*=0且l=2r时的对称窗口;(b)数据点i经过建筑物与地面交界
Fig. 5. Diagram of movement of data point i and windows. (a) Symmetric windows with θ*=0 and l=2r; (b) data point i through the boundary between building and ground

图 6. MRDKE(xi, yi, θ*)与σi(θ*)的变化趋势。(a) MRDKE(xi, yi, θ*);(b) σi(θ*)
Fig. 6. Change trend of MRDKE(xi, yi, θ*) and σi(θ*). (a) MRDKE(xi, yi, θ*); (b) σi(θ*)

图 7. 与图6中MRDKE(xi, yi, θ*)与σi(θ*)的变化趋势对应的整体点云示意图。(a)与图6(a)中宽度为2(l-r)且MRDKE(xi, yi, θ*)较大的一段红线相对应;(b1)与图6(b)中宽度为2(l-r)且σi(θ*)较小的一段红线相对应; (b2)与图6(b)中两个凸起的峰的顶端相对应
Fig. 7. Schematic of overall point cloud corresponding to the change trend of MRDKE(xi, yi, θ*) and σi(θ*) in Fig. 6. (a) Corresponding to a red line with a width of 2(l-r) and a larger MRDKE(xi, yi, θ*) in Fig. 6(a); (b1) corresponding to a red line with a width of 2(l-r) and a smaller σi(θ*) in Fig. 6(b); (b2) Corresponding to the top of the two raised peak in Fig. 6(b)

图 8. 数据点i穿过树木的示意图及对应的σi(θ#)的变化趋势。(a)数据点i在树木处;(b)数据点i穿过树木;(c) σi(θ#)的变化趋势
Fig. 8. Diagrammatic sketch of data point i passing through the tree and the change trend of σi(θ#).(a) Data point i at tree; (b) data point i passing through tree; (c) change trend of σi(θ#)

图 9. 数据点i穿过建筑物与地面交界的示意图及穿过该交界时σi(θ#)的变化趋势。(a) θ*=0且l=r时的对称窗口;(b)数据点i经过建筑物与地面交界的过程示意图;(c)σi(θ#)的变化趋势
Fig. 9. Diagrammatic sketch of data point i through the boundary between building and ground and the corresponding change trend to σi(θ#). (a) Symmetric windows when θ*=0 and l=r; (b) schematic of the process of data point i through the boundary between building and ground; (c) change trend of σi(θ#)

图 10. l=r时,不同区域的数据点对应的对称窗口连线方向及σi(θ#)大小
Fig. 10. Directions of symmetric window connection and magnitude of σi(θ#) corresponding to the data points in different regions when l=r

图 11. 阈值处理后的点集范围。(a) T1和T2;(b) T3
Fig. 11. Range of point sets after threshold procession. (a) T1 and T2; (b) T3

图 12. 滤除树木的过程示意图。(a)树木点的三维显示;(b)树木点的二维显示;(c)高程直方图;(d)处理后的树木点二维显示
Fig. 12. Diagram of the process of filtering trees. (a) Three dimensional version of tree points; (b) two dimensional version of tree points; (c) elevation histogram; (d) two dimensional version of treated tree points

图 13. 测试数据的σi(θ*)与σi(θ#)的直方图与阈值。(a) σi(θ*)的直方图;(b)图13(a)的局部放大;(c) σi(θ#)的直方图;(d)图13(c)的局部放大
Fig. 13. Histograms and thresholds of σi(θ*) and σi(θ#). (a) Histogram of σi(θ*); (b) local magnification of Fig.13(a); (c) histogram of σi(θ#); (d) local magnification of Fig.13(c)

图 14. 建筑物与地面交界的提取过程。(a) MRDKE(xi, yi, θ*)量级分布图;(b) MRDKE(xi, yi, θ*)及θ*所构成的矢量场;(c) σi(θ*)量级分布图;(d)σi(θ*)及θ*所构成的矢量场;(e)提取出的建筑物与地面交界
Fig. 14. Extraction process of the boundaries between buildings and ground. (a) Magnitude distribution of MRDKE(xi, yi, θ*); (b) vector field consisting of MRDKE(xi, yi, θ*) and θ*; (c) magnitude distribution of σi(θ*); (d) vector field consisting of σi(θ*) and θ*; (e) the extracted boundaries between buildings and ground

图 15. 树木及建筑物和地面交界的提取过程示意图。(a) σi(θ#)量级分布图;(b) σi(θ#)及θ#所构成的矢量场;(c)提取出的树木及建筑物和地面交界
Fig. 15. Schematic of the extraction process of trees and the boundaries between buildings and ground. (a) Magnitude distribution of σi(θ#); (b) vector field consisting of σi(θ#) and θ#; (c) trees and buildings and the boundaries between ground

图 16. 建筑物边缘的提取过程。(a)点集O;(b)点集Of;(c) Of的规则块划分;(d)点集Ph;(e)建筑物边缘
Fig. 16. Extraction process of building edges. (a) Point set O; (b) point set Of; (c) regular block partition of Of; (d) point set Ph; (e) building edges

图 17. 居民区点云数据及其对应的光学影像。(a)~(d)点云数据;(a1)~(d1)与点云数据对应的光学影像
Fig. 17. Point cloud data of residential areas and corresponding optical images. (a)-(d) Point cloud data; (a1)-(d1) optical images corresponding to the point cloud data

图 18. 第一个到第4个实验数据对应的A、B、Of、Ph。(a1)~(d1) A;(a2)~(d2) B;(a3)~(d3) Of;(a4)~(d4) Ph
Fig. 18. A、B、Of、Ph for first to fourth experimental data. (a1)-(d1) A; (a2)-(d2) B; (a3)-(d3) Of; (a4)-(d4) Ph

图 19. 所提算法的提取结果。(a)数据一;(b)数据二;(c)数据三;(d)数据四
Fig. 19. Extraction results based on proposed algorithm. (a) Data 1; (b) data 2; (c) data 3; (d) data 4

图 20. 对比算法的提取结果。(a1)~(d1) Terrasolid软件;(a2)~(d2)文献[ 19]中的方法;(a3)~(d3)文献[ 20]中的方法
Fig. 20. Extraction results based on compared methods. (a1)-(d1) Terrasolid software; (a2)-(d2) the method in Ref. [19]; (a3)-(d3) the method in Ref. [20]

图 21. 所提算法的叠加结果。(a)数据一;(b)数据二;(c)数据三;(d)数据四
Fig. 21. Superposition results of proposed algorithm. (a) Data 1; (b) data 2; (c) data 3; (d) data 4


表 1定量评价结果
Table1. Quantitative evaluation results
|
王岱良, 李玉. 基于旋转差值核估计的激光雷达点云建筑物边缘提取[J]. 中国激光, 2019, 46(1): 0104005. Wang Dailiang, Li Yu. Building Edge Extraction from LiDAR Point Cloud Based on Rotational Difference Kernel Estimation[J]. Chinese Journal of Lasers, 2019, 46(1): 0104005.


 PDF全文
PDF全文

