High Power Laser Science and Engineering, 2018, 6 (3): 03000e43, Published Online: Aug. 28, 2018
Experimental platform for the investigation of magnetized-reverse-shock dynamics in the context of POLAR  Download: 605次
Figures & Tables
Fig. 1. Experimental setup at LULI2000. (a) Main target and obstacle assembly. (b) Target holder showing the main target and a  V wire which is positioned 3 cm below to create the X-ray source. (c) The target holder is then inserted inside the coil from the bottom. Schematic illustration of the different terminology used in the paper. (d) After the shock breakout, a plasma flow is launched from the main target rear side. When the plasma propagates between both targets, we refer to (e) the accreting plasma flow and finally (f) the reverse-shock region.
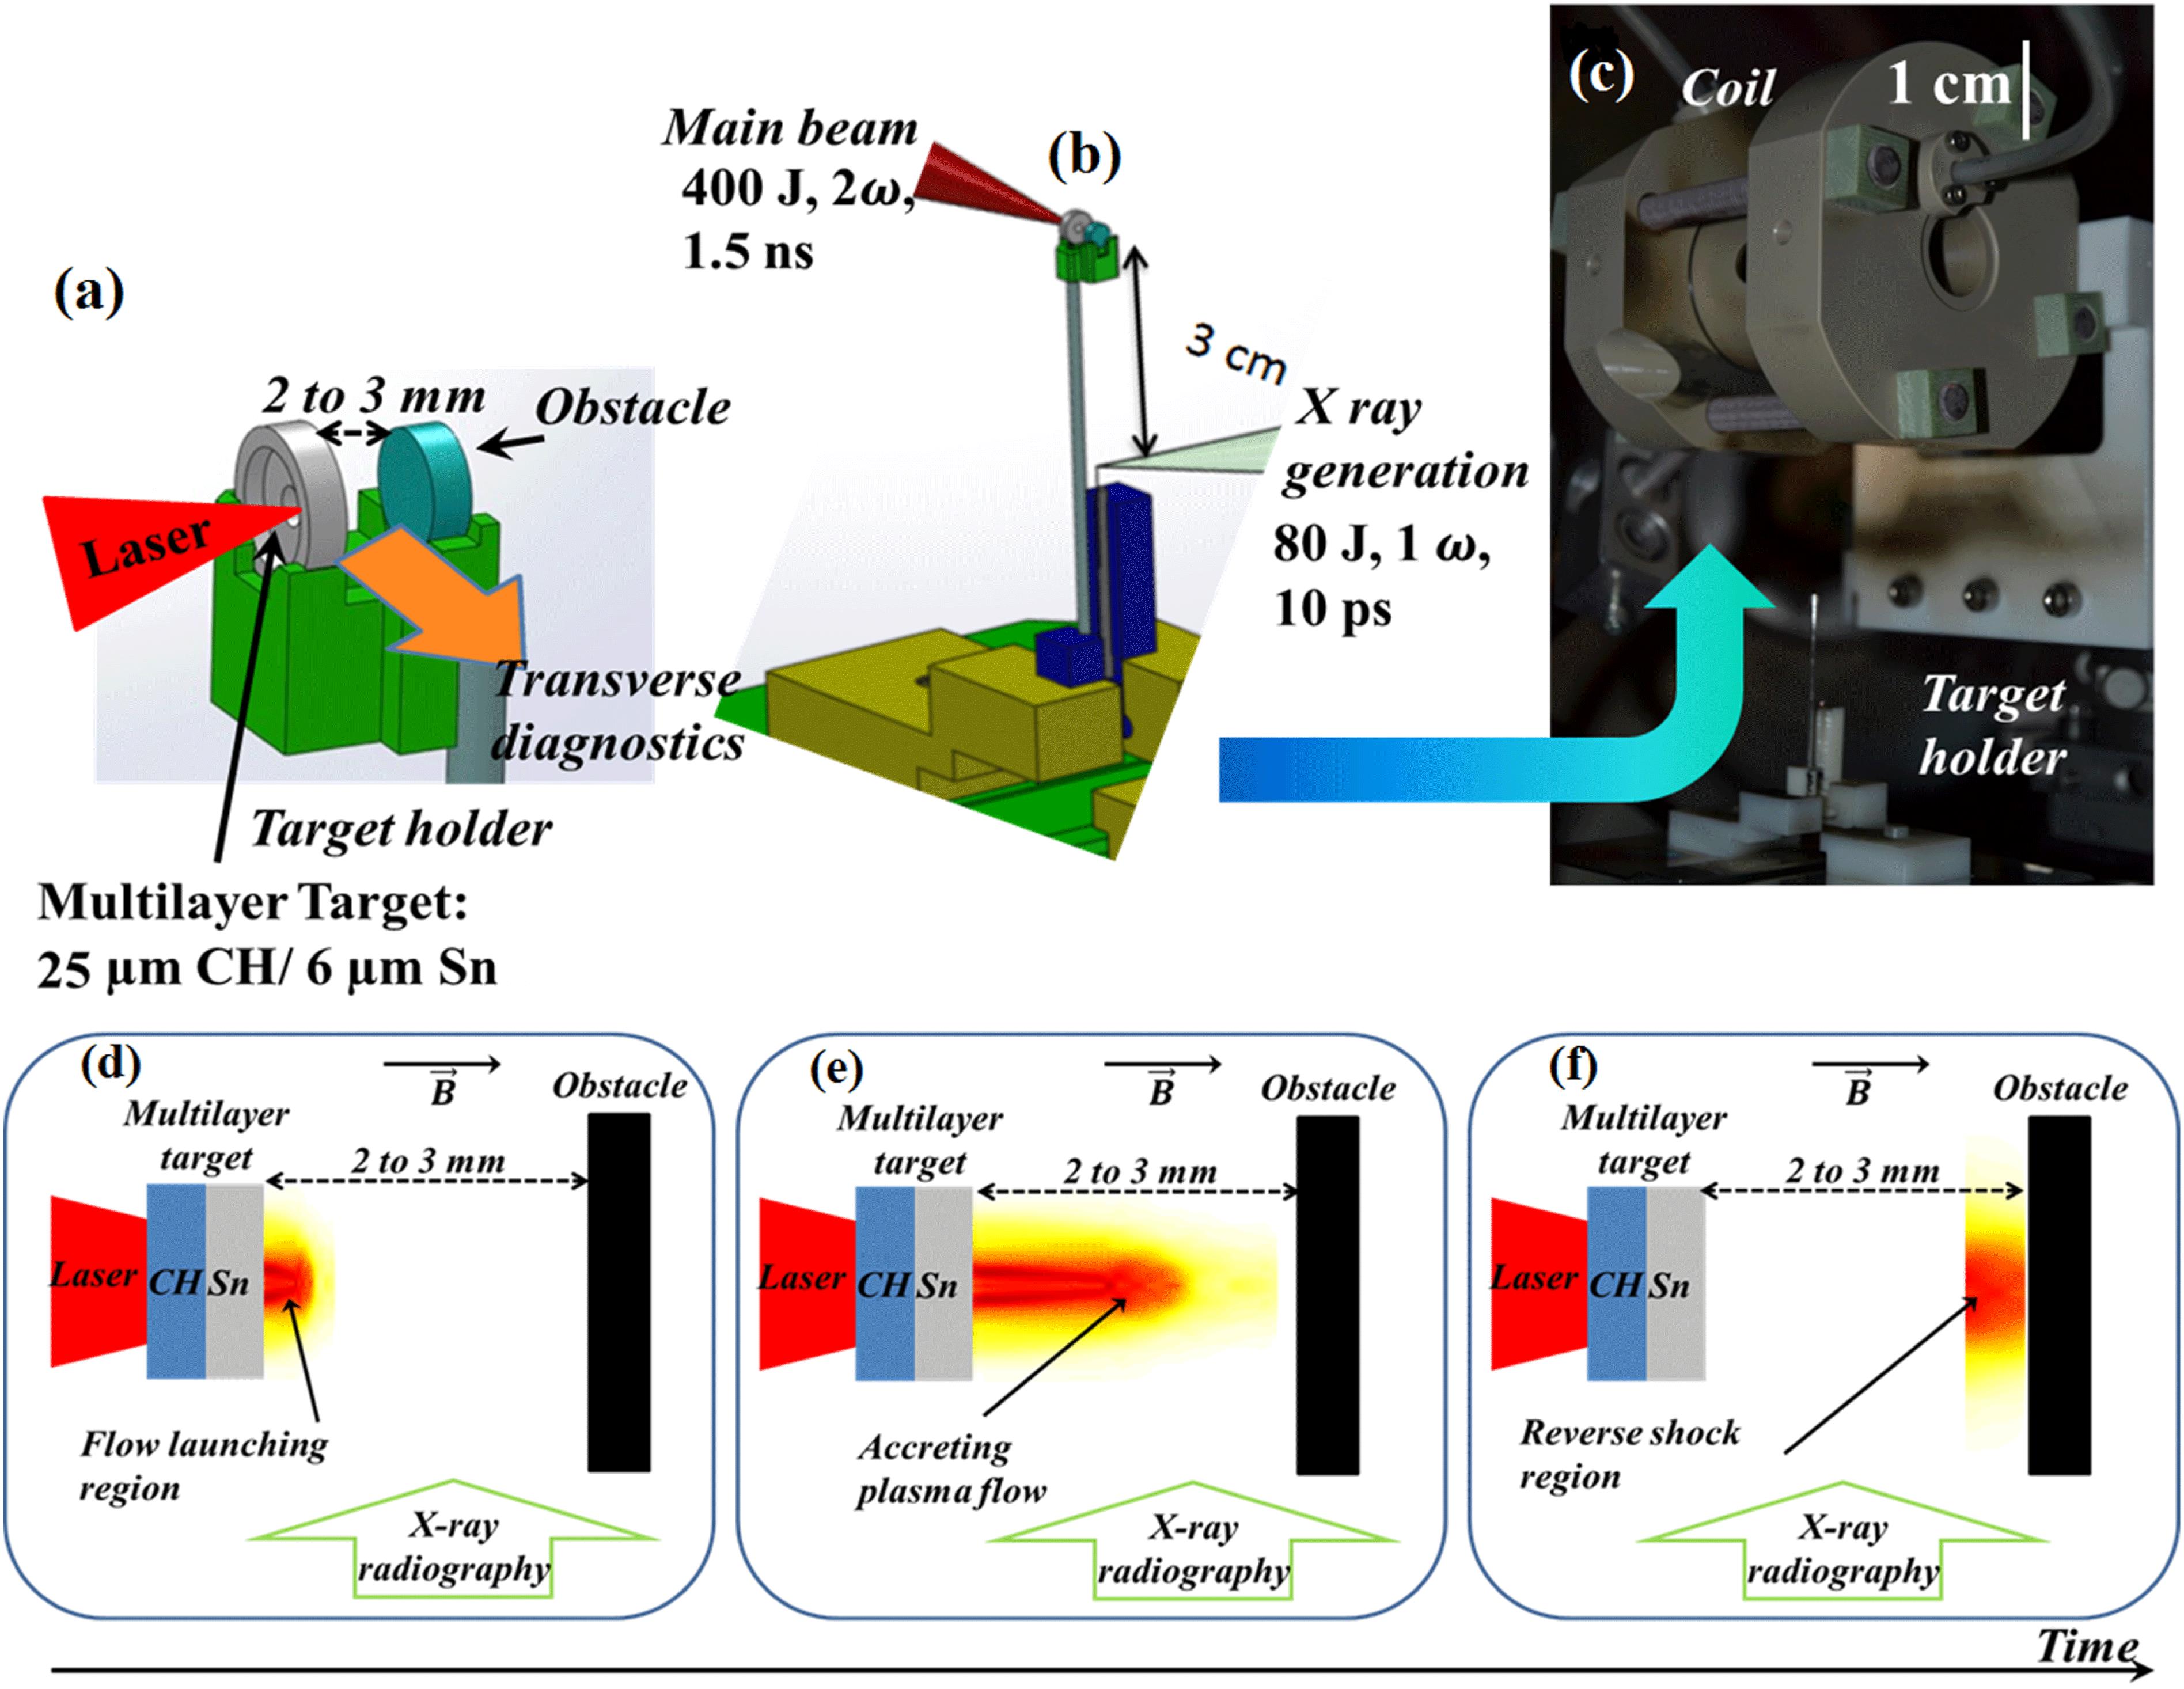
Fig. 2. Streaked optical emission of the plasma at a wavelength of 450 nm obtained during the experiment giving the different velocities of the plasma flow, (a) with a 10 T B-field using 406 J laser energy and (b) without B-field using 402 J laser energy.

Fig. 3. Experimental results of the flow-launching velocity, accreting plasma flow velocity and reverse-shock velocity as a function of (a) the distance between the main target and the obstacle (the laser energy for each shot is displayed) and (b) the laser energy. The different velocities ( ,
,  ,
,  ) are defined in Figure
 2 .

Fig. 4. Experimental results of X-ray radiography in the case without external B-field at (a) 60 ns and (d) 75 ns and with B-field at (b) 60 ns and (c) 75 ns. The laser irradiates the target from the bottom of the image. The plasma expansion from the rear surface of the target is visible. The thin, darkened feature seen near the edges of the plasma, especially in the bottom two images, suggests the presence of a denser shell of material seen by limb-darkening. The dark band at the bottom of the image (located between  and
and  ) is an additional Al filter to prevent unexpected X-ray emission from the front of the target. The lighter box above corresponds to the area where no additional filters are present.

Fig. 5. Diameter of the plasma flow as a function of the distance from the rear surface of the target in the case with and without magnetic field at 75 ns after the beginning of the interaction. Uncertainties are of the order of  and come mainly from the determination of the edge of the plasma flow. The data stop at 2 mm from the main target due to the low plasma density and the resulting low contrast (see Figure
 4 ).

Fig. 6. General setup of the 2D axis-symmetric radiative MHD FLASH simulation using a 1 mm hole diameter and a 10 T B-field.

Fig. 7. (a) 2D MHD radiative simulation of the experiment performed with and without a 10 T B-field at 75 ns after the beginning of the interaction showing the mass density. Radiation module is on. The left panel corresponds to the case with the B-field and the right panel without. (b) Numerical results of the simulation showing the dimensionless number  and
and  for the simulation of (a) left (using the 10 T B-field, radiation module on and at 75 ns after the beginning of the interaction).
  is evaluated using the conduction model of Lee and More[30].

Fig. 8. 2D MHD radiative simulation of the experiment performed with and without radiation at 75 ns after the beginning of the interaction. A 10 T B-field is present. (a) Temperature in eV, (b) density in  with isocontours of CH fraction compared with Al and Sn, (c) ionization state and (d) modulus of velocity in
  .
.

Fig. 9. Radiographs obtained at 75 ns from (a) experimental results renormalized between 0 and 1, and (b) FLASH MHD radiative simulation, postprocessed using a 4.952 keV monochromatic X-ray source (corresponding to the vanadium K emission of the backlighter in the experiment). Horizontal lineouts of radiograph transmission at different positions (c)
  and (d)
  (dashed lines in (a) and (b)) and direct comparison between two different X-ray source energies: 4.952 keV (reproducing the K
 emission of the backlighter in the experiment) and 11.92 keV (to observe the influence of a higher photon energy on the morphology of the X-ray radiography).

Fig. 10. Comparison between lineout of the optical emission (see Figure 2 (a) for an example), measured in the experiment (left axis) and electron and radiation temperature given by the FLASH simulation (right axis at  ) at (a) 45 ns and (b) 60 ns after the laser drive for two different FLASH simulations: without radiation modules (black curve) and with radiation module on (blue and red) using 40 radiation groups. (c) Vertical lineout of radiograph transmission, at
  of Figure
 9 (a) (experiment, red curve), Figure 9 (b) (simulation with radiations, black curve) and without radiations (blue curve).

Fig. 11. MHD radiative FLASH simulation of the experiment using a 1 mm hole diameter (left panel) and a 2 mm hole diameter (right panel) and a 10 T B-field. An obvious difference is observed at the base of the jet where the plasma shape is strongly affected by the size of the hole.

Fig. 12. Illustration of the  parameter as a function of the shock velocity and the density for an external magnetic field of (a) 10 T and (b) 20 T. The red rectangle corresponds to the experimental conditions deduced from the combination of diagnostics.

Fig. 13. Map of magnetic Reynolds number in the shocked matter,  , which depends on the incoming flow velocity, resistivity and temperature. The resistivity was evaluated using a Coulomb logarithm of 10 and ionization from 1 to 6. Results are shown for an external magnetic field of 10 T. The white rectangle corresponds to the experimental conditions, as deduced from the combination of diagnostics. The lines are isolines of
  for values of 1, 5, 10, 20 and 50.

B. Albertazzi, E. Falize, A. Pelka, F. Brack, F. Kroll, R. Yurchak, E. Brambrink, P. Mabey, N. Ozaki, S. Pikuz, L. Van Box Som, J. M. Bonnet-Bidaud, J. E. Cross, E. Filippov, G. Gregori, R. Kodama, M. Mouchet, T. Morita, Y. Sakawa, R. P. Drake, C. C. Kuranz, M. J.-E. Manuel, C. Li, P. Tzeferacos, D. Lamb, U. Schramm, M. Koenig. Experimental platform for the investigation of magnetized-reverse-shock dynamics in the context of POLAR[J]. High Power Laser Science and Engineering, 2018, 6(3): 03000e43.


 PDF全文
PDF全文

