手持式激光诱导击穿光谱仪对铝合金中镁钛元素的定量分析  下载: 897次
Quantitative Analysis of Magnesium and Titanium Elements in Aluminum Alloy by Handheld Laser-Induced Breakdown Spectroscopy
1 南京理工大学电子工程与光电技术学院, 江苏 南京 210094
2 南京先进激光技术研究院, 江苏 南京 210038
图 & 表
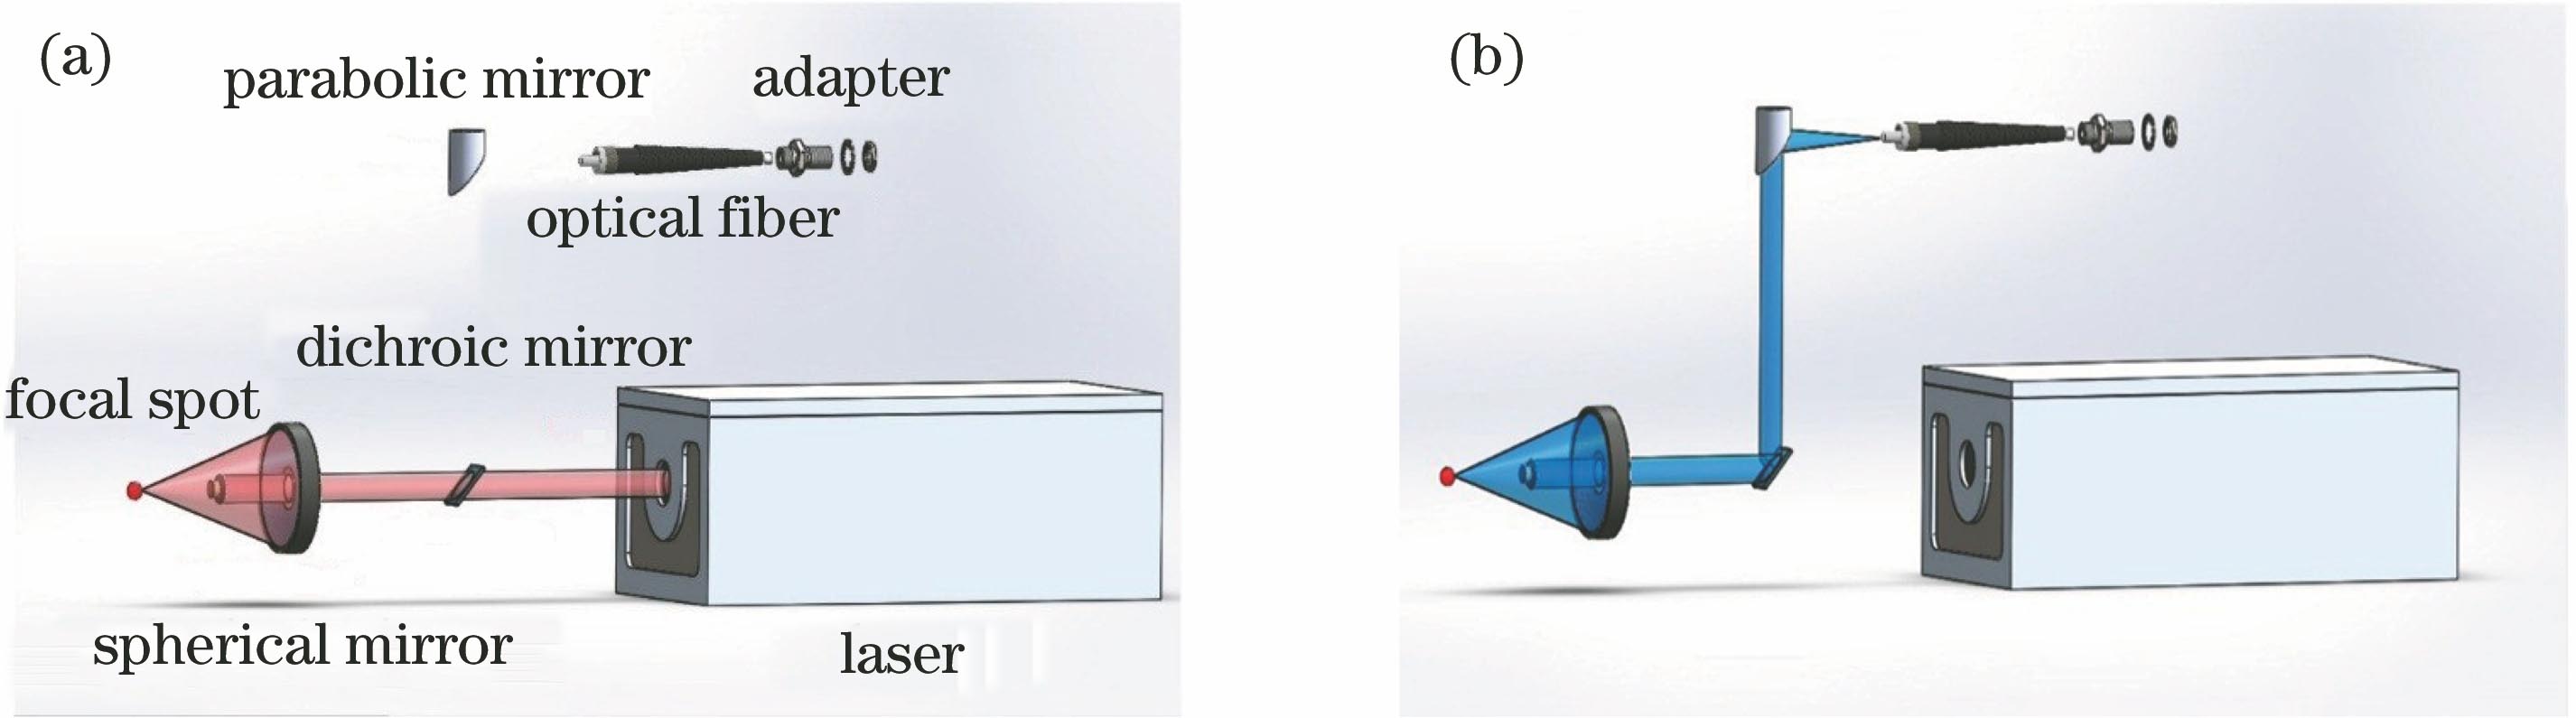
图 1. 手持式LIBS光路结构示意图。 (a)激发光光路图;(b)信号光光路图
Fig. 1. Schematic of optical path structure in handheld LIBS. (a) Path diagram of excitation light; (b) path diagram of signal light
下载图片 查看原文
图 2. ZEMAX仿真的光线追迹图
Fig. 2. Ray trace image simulated by ZEMAX
下载图片 查看原文
图 3. 实验装置图
Fig. 3. Experimental setup
下载图片 查看原文
图 4. 光谱图。(a)原始光谱图;(b)预处理的光谱
Fig. 4. Spectrogram. (a) Original signal spectrum; (b) processed signal spectrum
下载图片 查看原文
图 5. 型号为E111的标准样品光谱
Fig. 5. Spectrum of standard sample E111
下载图片 查看原文
图 6. Mg元素在383.83 nm及285.17 nm特征谱线处的定标曲线
Fig. 6. Calibration curves of Mg element at 383.83 nm and 285.17 nm characteristic lines
下载图片 查看原文
图 7. Ti元素在323.38 nm及336.12 nm特征谱线处的定标曲线
Fig. 7. Calibration curves of Ti element at 323.38 nm and 336.12 nm characteristic lines
下载图片 查看原文
表 1镜片结构参数
Table1. Structural parameters of lens
| No. | Type | Radius /mm | Thickness /mm | Glass |
|---|
| 1 | Standard | Infinity | 20 | | | 2 | Tilt | Infinity | 50 | K9 | | 3 | Standard | 24.628 | -26.701 | Mirror | | 4 | Standard | 53.145 | 56.520 | Mirror | | 5 | Standard | Infinity | -56.520 | | | 6 | Standard | 53.145 | 26.701 | Mirror | | 7 | Standard | 24.628 | -50 | Mirror | | 8 | Tilt | Infinity | 40 | K9 | | 9 | Evenasphere | -50.8 | - | Mirror |
|
查看原文
表 2用于绘制定标曲线的样品型号及成分组成
Table2. Sample names and compositions used for drawing calibration curves
| Samplename | Mass fraction /% |
|---|
| Si | Fe | Cu | Mn | Mg | Cr | Ni | Zn | Ti | Al |
|---|
| E111 | 1.250 | 0.825 | 1.880 | 1.240 | 0.692 | 0.092 | 0.161 | 0.401 | 0.121 | Others | | E213b | 0.287 | 0.313 | 0.129 | 1.520 | 0.052 | - | 0.075 | 0.047 | 0.060 | Others | | E924d | 12.290 | 1.060 | 2.020 | 0.261 | 0.265 | - | 0.427 | 1.540 | 0.018 | Others | | 6063 | 0.098 | 0.110 | 0.012 | 0.460 | 1.210 | 0.310 | - | 0.053 | 0.220 | Others | | E123a | 0.127 | 0.350 | 4.110 | 0.532 | 1.510 | - | 0.037 | 0.147 | 0.039 | Others |
|
查看原文
表 3用于验证定标曲线的样品型号及成分组成
Table3. Sample names and compositions used for verifying calibration curves
| Samplename | Mass fraction /% |
|---|
| Si | Fe | Cu | Mn | Mg | Cr | Ni | Zn | Ti | Al |
|---|
| K6061 | 0.588 | 0.292 | 0.278 | 0.118 | 1.050 | 0.208 | 0.031 | 0.154 | 0.108 | Others | | K6063b | 0.419 | 0.223 | 0.019 | 0.020 | 0.547 | 0.024 | - | 0.027 | 0.023 | Others |
|
查看原文
表 4样品的验证结果及相对误差
Table4. Verification results and relative errors of sample
| Samplename | Mass fraction of Mg /% | Mass fraction of Ti /% |
|---|
| 285.17 nm | 383.83 nm | 323.45 nm | 334.94 nm |
|---|
| Standardvalue | Measuredvalue | Relativeerror | Standardvalue | Measuredvalue | Relativeerror | Standardvalue | Measuredvalue | Relativeerror | Standardvalue | Measuredvalue | Relativeerror | | K6061 | 1.050 | 1.021 | 2.76 | 1.050 | 1.072 | 2.10 | 0.108 | 0.106 | 1.85 | 0.108 | 0.113 | 4.63 | | K6063b | 0.547 | 0.586 | 7.13 | 0.547 | 0.556 | 1.65 | 0.023 | 0.022 | 4.35 | 0.023 | 0.025 | 8.70 |
|
查看原文
表 5分析元素在不同特征谱线的检出限
Table5. Detection limits of different spectral lines in element analysis
| Parameter | Mg | Ti |
|---|
| 285.17 nm | 383.83 nm | 323.45 nm | 334.94 nm |
|---|
| Slope of calibration curve | 3410.06 | 3117.09 | 2205.07 | 2398.08 | | Detection limit /(μg·g-1) | 564.8 | 538.7 | 405.6 | 398.9 |
|
查看原文
李婧御, 陈宽, 陈国飞, 李扬彦, 曾爱军, 辛煜. 手持式激光诱导击穿光谱仪对铝合金中镁钛元素的定量分析[J]. 激光与光电子学进展, 2019, 56(2): 023002. Jingyu Li, Kuan Chen, Guofei Chen, Yangyan Li, Aijun Zeng, Yu Xin. Quantitative Analysis of Magnesium and Titanium Elements in Aluminum Alloy by Handheld Laser-Induced Breakdown Spectroscopy[J]. Laser & Optoelectronics Progress, 2019, 56(2): 023002.


 PDF全文
PDF全文

