Chinese Optics Letters, 2021, 19 (4): 043201, Published Online: Feb. 4, 2021
Even-order high-harmonic generation from solids in velocity gauge  Download: 875次
Figures & Tables
Fig. 1. (a) Periodic potential used for the calculation. Each crystal lattice includes three different atomic centers, namely, A, B, and C. (b) The corresponding band structure (first five bands). Band indices are shown on the right. The gray dashed line indicates the Fermi level.
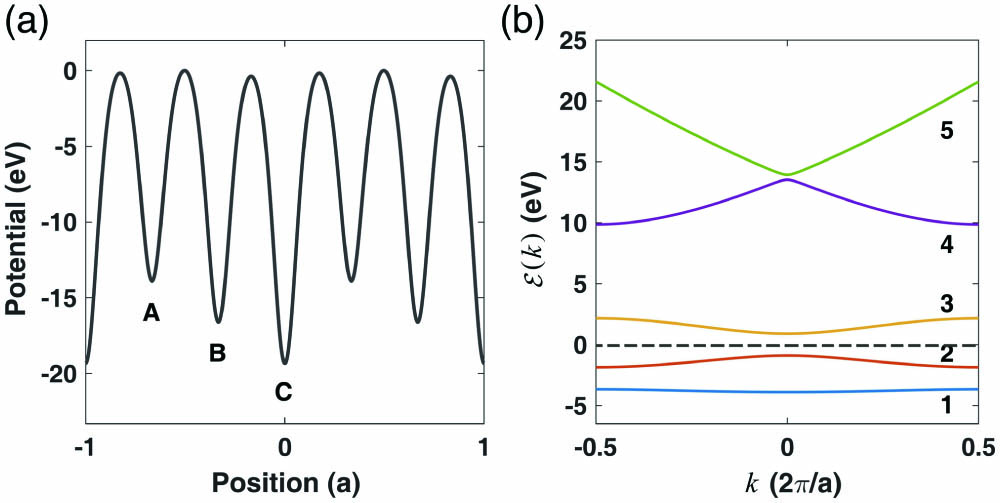

Fig. 3. Comparison between the harmonic spectra obtained by allowing (blue line) and forbidding (red line) multiple-band transitions. Initial electron state and laser parameters are the same as in Fig. 2(a) .

Fig. 4. Comparison of high-harmonic spectra calculated with (blue line) and without (pink line) transitions involving band 1.

Fig. 5. Laser field dependence of the high harmonics. (a) Calculated high-harmonic spectra between the 5th and 18th harmonic order. (b) The even/odd ratio of the 6th–14th harmonics. Red solid line shows the averaged ratio.

Fig. 6. Schematic diagram of the (a) direct transition and (b) sequential transition processes. Number and letters on the right of (a) are band indices.


Jiayuan Cao, Na Li, Ya Bai, Peng Liu, Ruxin Li. Even-order high-harmonic generation from solids in velocity gauge[J]. Chinese Optics Letters, 2021, 19(4): 043201.


 PDF全文
PDF全文

