Chinese Optics Letters, 2020, 18 (4): 042604, Published Online: Apr. 10, 2020   

Imaging through dynamic scattering media with stitched speckle patterns Download: 807次

Author Affiliations
1 Key Laboratory of Quantum Optics, Shanghai Institute of Optics and Fine Mechanics, Chinese Academy of Sciences, Shanghai 201800, China
2 Center of Materials Science and Optoelectronics Engineering, University of Chinese Academy of Sciences, Beijing 100049, China
Figures & Tables

Fig. 1. Schematic illustration of stitching. (a) A big speckle pattern is split into many subblocks, and each subblock has its own independent PSFk. In other words, the big speckle pattern is obtained by stitching all independent subblocks together. (b) The segmentation of a big speckle pattern I.

下载图片 查看原文

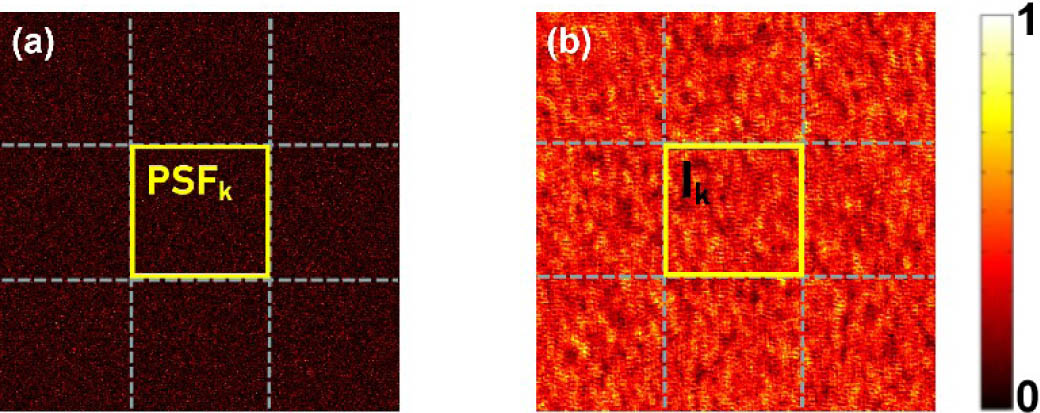
Fig. 2. Diagram of piecing together a series of speckle patterns {Itk}k=1n×n [shown as subfigure (a)] into (b) a big speckle pattern; the yellow square frame denotes a single speckle pattern Itk.

下载图片 查看原文

Fig. 3. Experimental setup. u and v are distances from the object and the camera to the scattering layer, respectively.

下载图片 查看原文

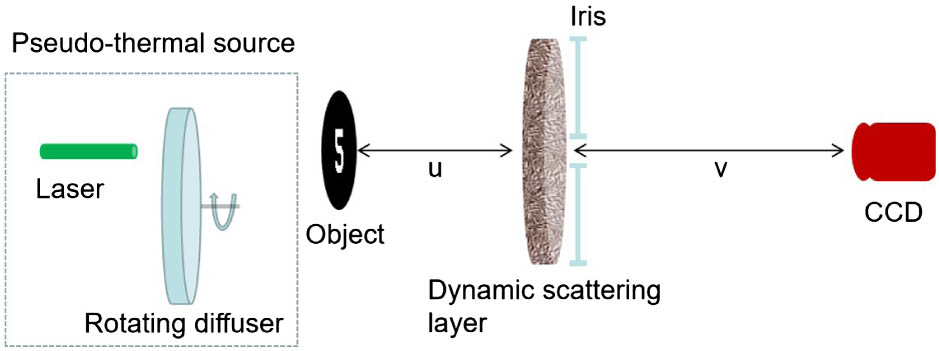
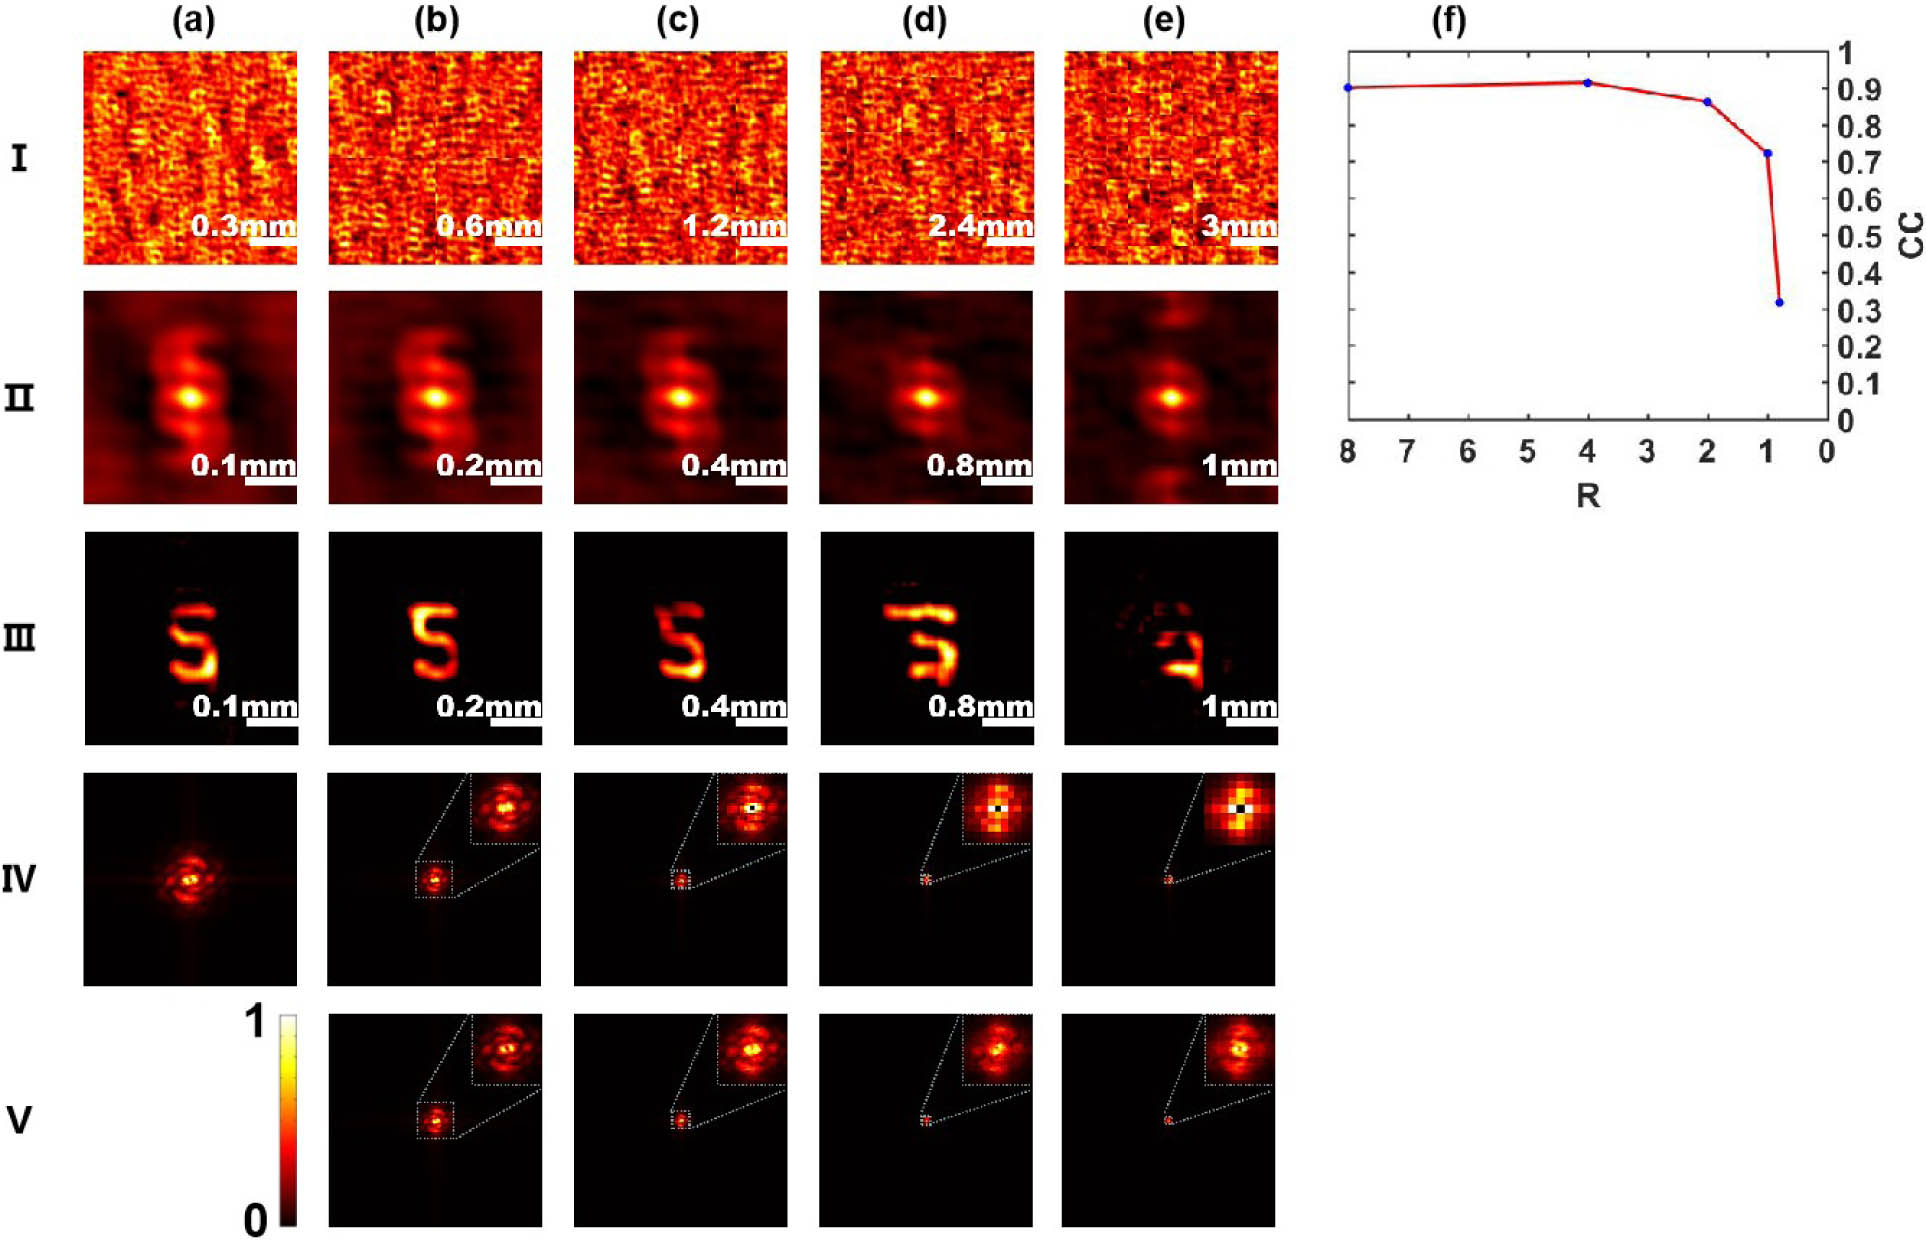
Fig. 4. Experimental results. Rows I, II, and III correspond to R=10.8, 5.4, and 3.6, respectively. (a) Examples of captured speckle patterns, and (b) the corresponding autocorrelations of (a). (c) The power spectra of (a), (d) the averaged power spectra, and (e) the images reconstructed from (d). (f) The stitched speckle patterns at different sampling ratios and numbers of frames: R=10.8, 4×4 frames (row I); R=5.4, 8×8 frames (row II); and R=3.6, 12×12 frames (row III), respectively. (g) The corresponding power spectra of (f), and (h) the images reconstructed from (g). (II,i) The autocorrelation and (III,i) the frequency spectrum of (I,i), the object. The inserts in rows II and III, and columns (c), (d), and (h) show zoom-ins of the center dash squares.

下载图片 查看原文

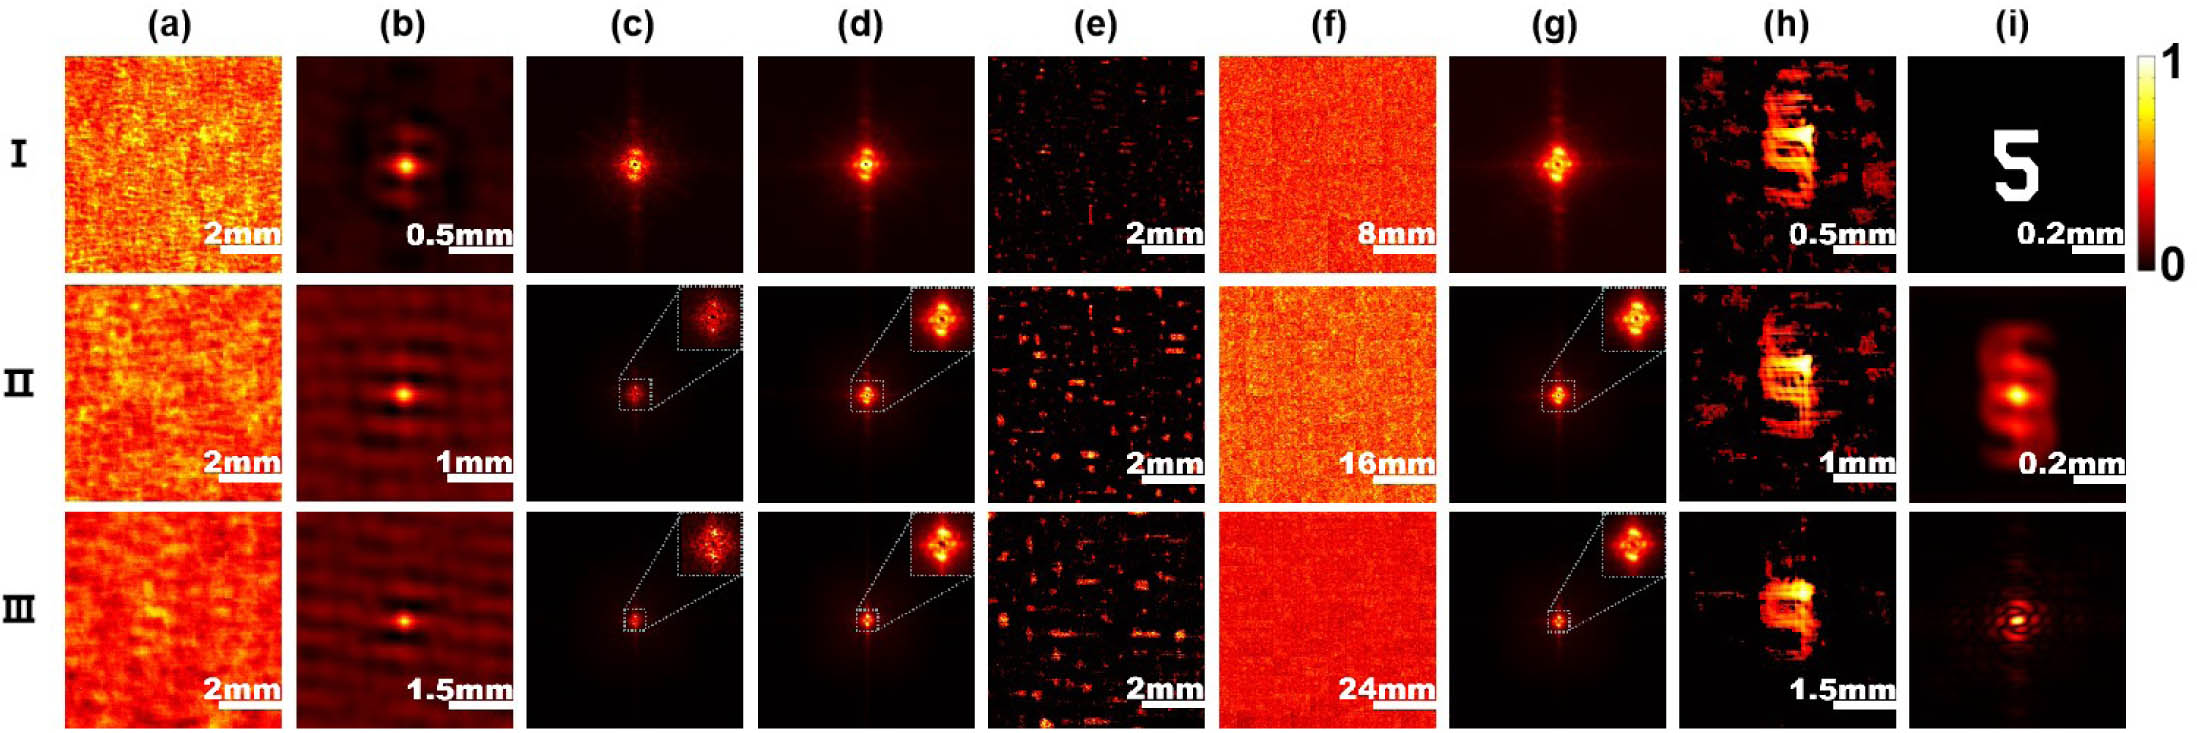
Fig. 5. Simulation results of different stitching numbers at R=2. Row I. (a) A single original speckle pattern; and (b) 4, (c) 9, (d) 36, and (e) 64 original patterns stitched together equally in two directions. Row II. The autocorrelations corresponding to I. Row III. The respective images reconstructed. Row IV. The averaged power spectra of 1, 4, 9, 36, and 64 frames of the original patterns. Row V. The corresponding power spectra of row I. (f) The evolution of the correlation coefficient with stitching number n. In rows IV and V, all have the same spectrum range because of the same pixel pitch. However, the power spectra of the stitched patterns have a higher resolution determined by the array size, which can be seen clearly from the amplified dash squares.

下载图片 查看原文

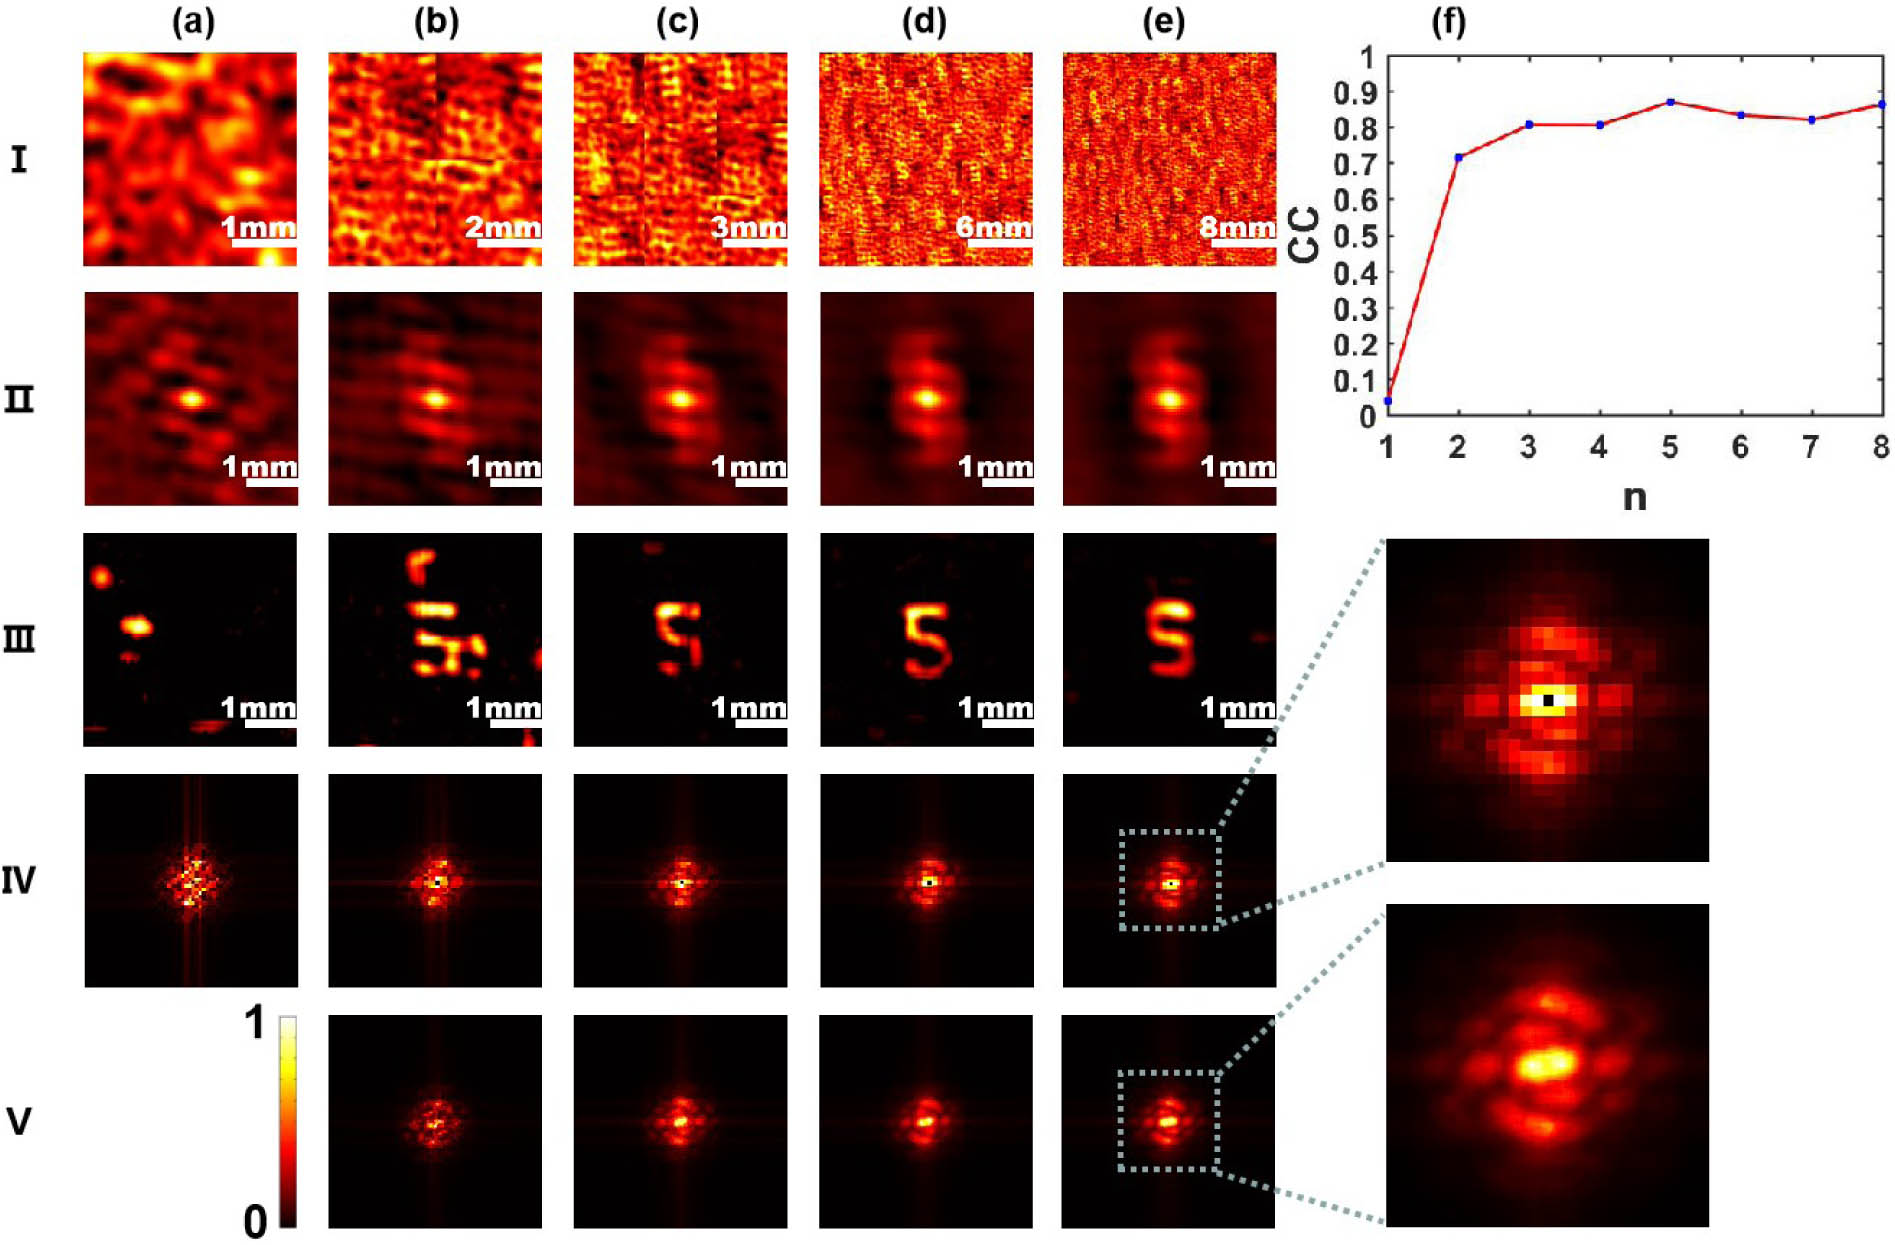
Fig. 6. Simulation results of different sampling ratios R. Row I. (a) A speckle pattern at R=8, and stitched speckle patterns of different sampling ratios and numbers of frames: (b) R=4, 2×2 frames; (c) R=2, 4×4 frames; (d) R=1, 8×8 frames; and (e) R=0.8, 10×10 frames, respectively. Row II. Autocorrelations corresponding to I. Row III. Reconstructed images, respectively. Row IV. Averaged power spectra. Row V. Corresponding power spectra of I (b)–(e). (f) The evolution of the correlation coefficient versus sampling ratio R. Again, all power spectra in rows IV and V have the same spectral range but different resolutions.

下载图片 查看原文

Xin Wang, Honglin Liu, Meijun Chen, Zhentao Liu, Shensheng Han. Imaging through dynamic scattering media with stitched speckle patterns[J]. Chinese Optics Letters, 2020, 18(4): 042604.

本文已被 1 篇论文引用
被引统计数据来源于中国光学期刊网
引用该论文: TXT   |   EndNote

相关论文

加载中...

关于本站 Cookie 的使用提示

中国光学期刊网使用基于 cookie 的技术来更好地为您提供各项服务,点击此处了解我们的隐私策略。 如您需继续使用本网站,请您授权我们使用本地 cookie 来保存部分信息。
全站搜索
您最值得信赖的光电行业旗舰网络服务平台!