Photonics Research, 2021, 9 (1): 01000066, Published Online: Apr. 1, 2021
Program-controlled single soliton microcomb source  Download: 802次
Figures & Tables
Fig. 1. Schematic of program-controlled single SMC generation. (a) Diagram of program-controlled single SMC generation. A controller is used for microcomb data acquisition, microcomb states discrimination, and pump condition adjustment. An auxiliary laser is counter coupled into the cavity to stabilize the intracavity power for tuning speed independent single SMC generation. (b) Diagram of the intracavity power evolution while the pump laser sweeps across the peak of resonance. (c) The lower boundary of the soliton existing range is nondegenerate while backward tuning the pump frequency or microcavity operation temperature, which provides an effective approach for deterministic soliton switching. (d) The soliton steps when intracavity solitons annihilate one by one. All the solitons have similar power under the same pump condition, which provides a simple soliton state discrimination criterion for program-controlled single SMC generation. ECDL: external cavity diode laser.
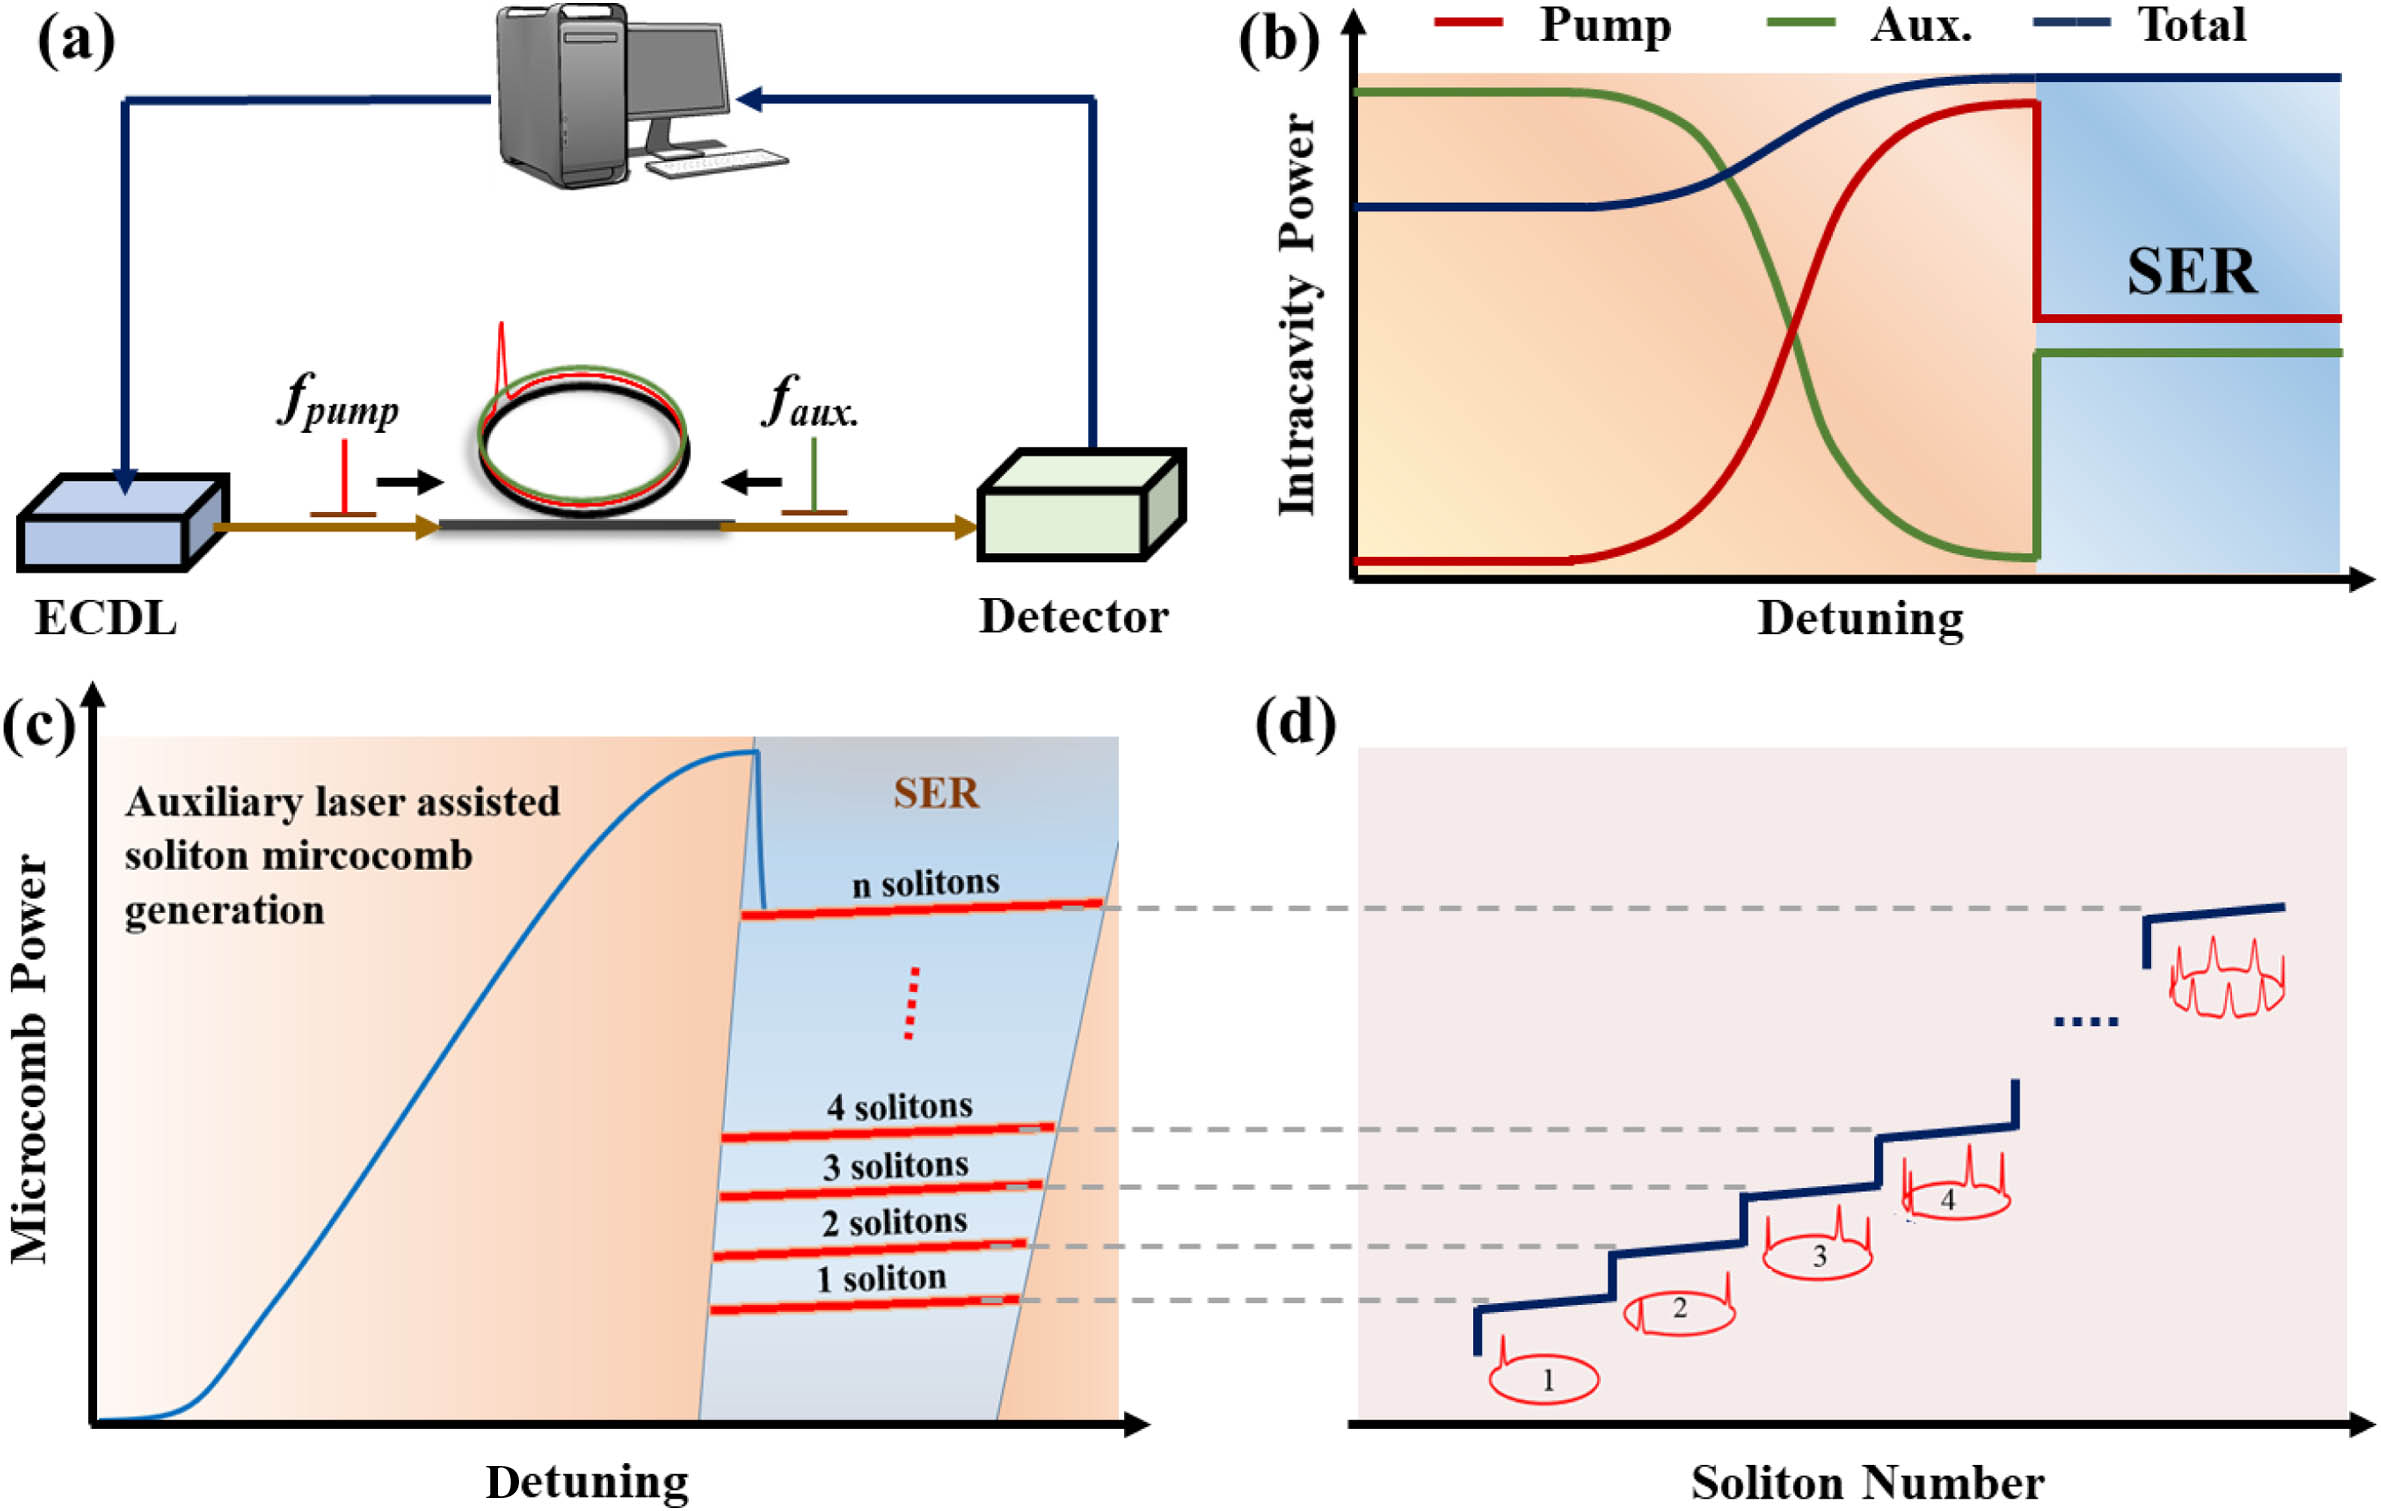
Fig. 2. Experimental setup. (a) Experimental setup of program-controlled single SMC generation. An auxiliary laser assisted thermal balance scheme is employed for tuning speed independent single SMC generation. The microcomb states are discriminated by the microcomb power, and the pump condition is exactly controlled by a computer program. EFDA: erbium doped fiber amplifier; FPC: fiber polarization control; TEC: thermoelectric cooler; OSA: optical spectrum analyzer; BPF: band pass filter; and PC: personal computer. (b) A 14-pin butterfly packaged MRR device whose operation temperature can be precisely tuned using an external TEC controller. (c) Microscope image of the 49 GHz high-index doped silica glass microring resonators. (d) Flowchart of the control program. There are four microcomb power criteria for different microcomb states discrimination.
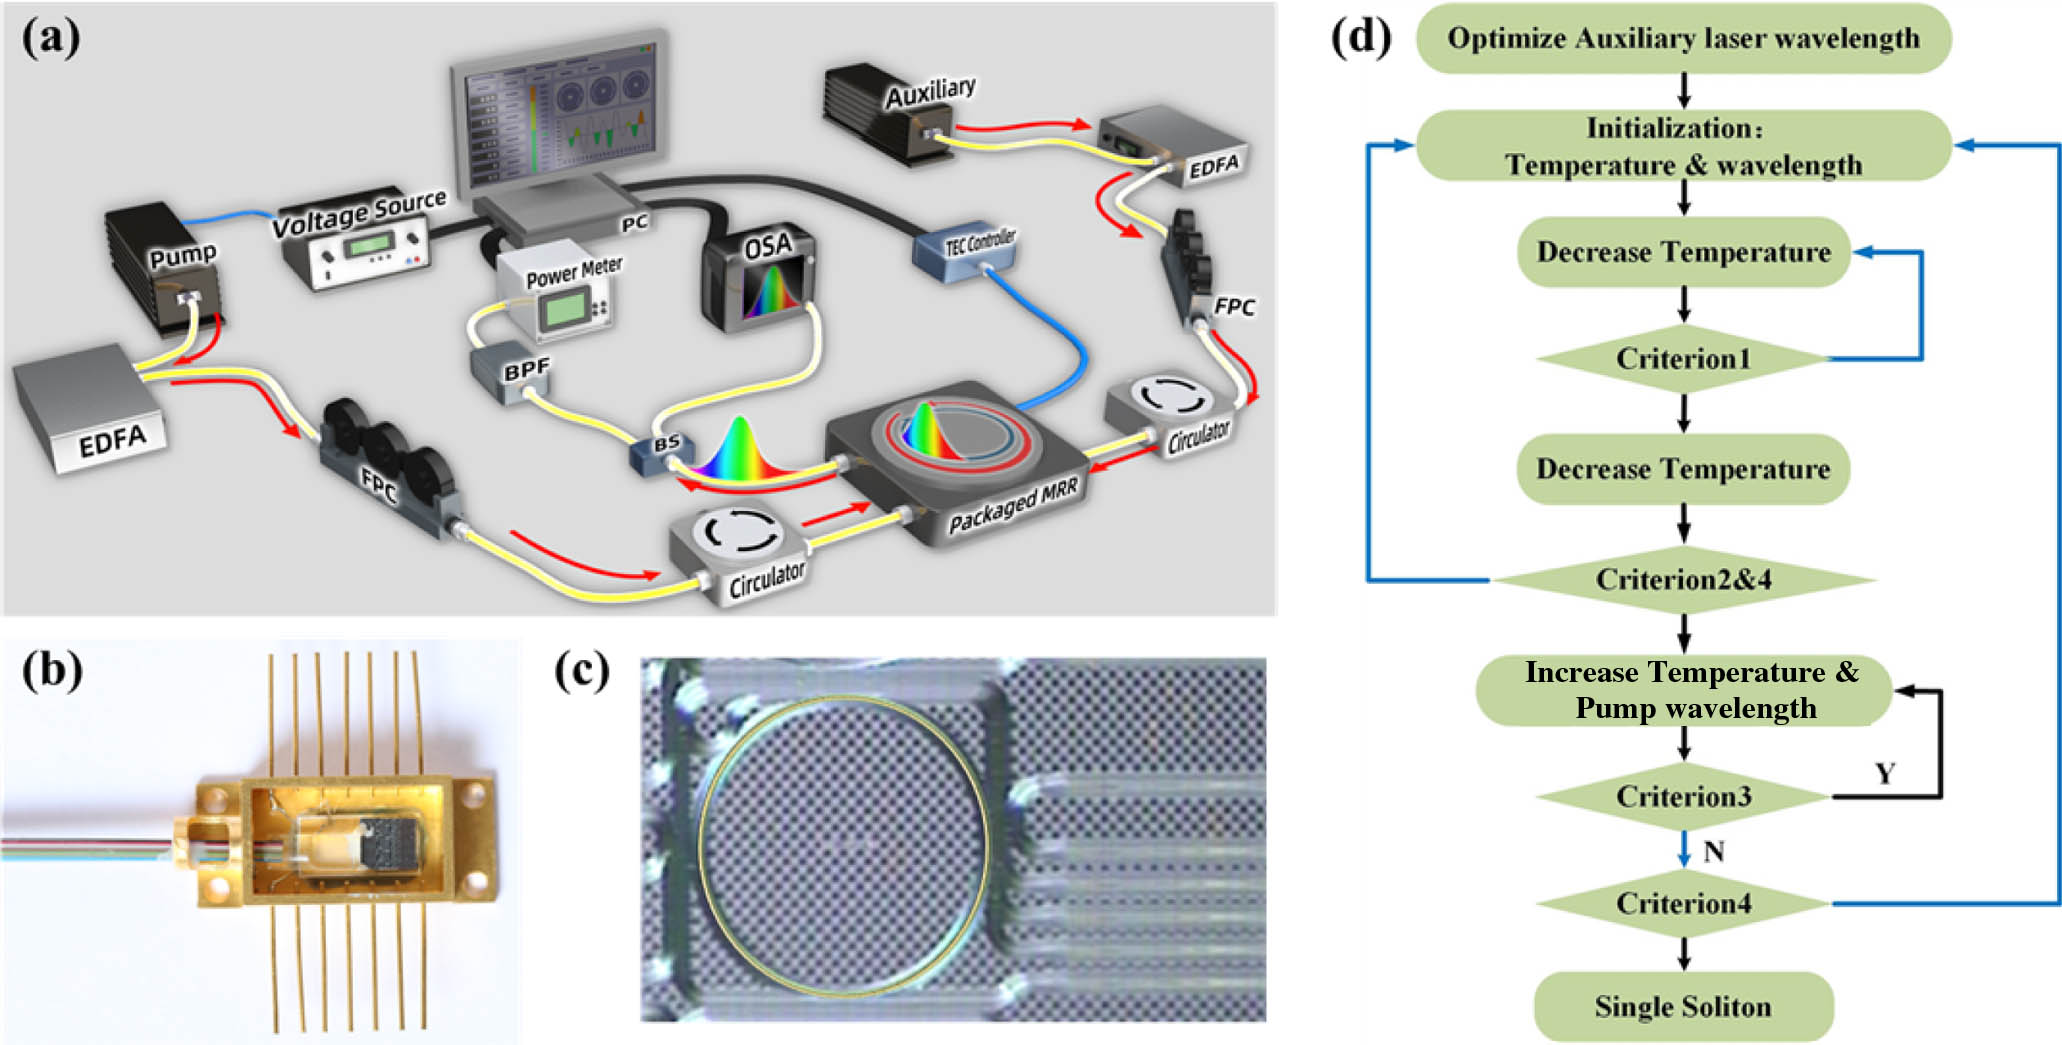
Fig. 3. Experimental results of program-controlled SMC generation. (a) The measured power trace of microcomb evolutionary process. The power of a single SMC is clamped in a range between − 12 − 10 dBm
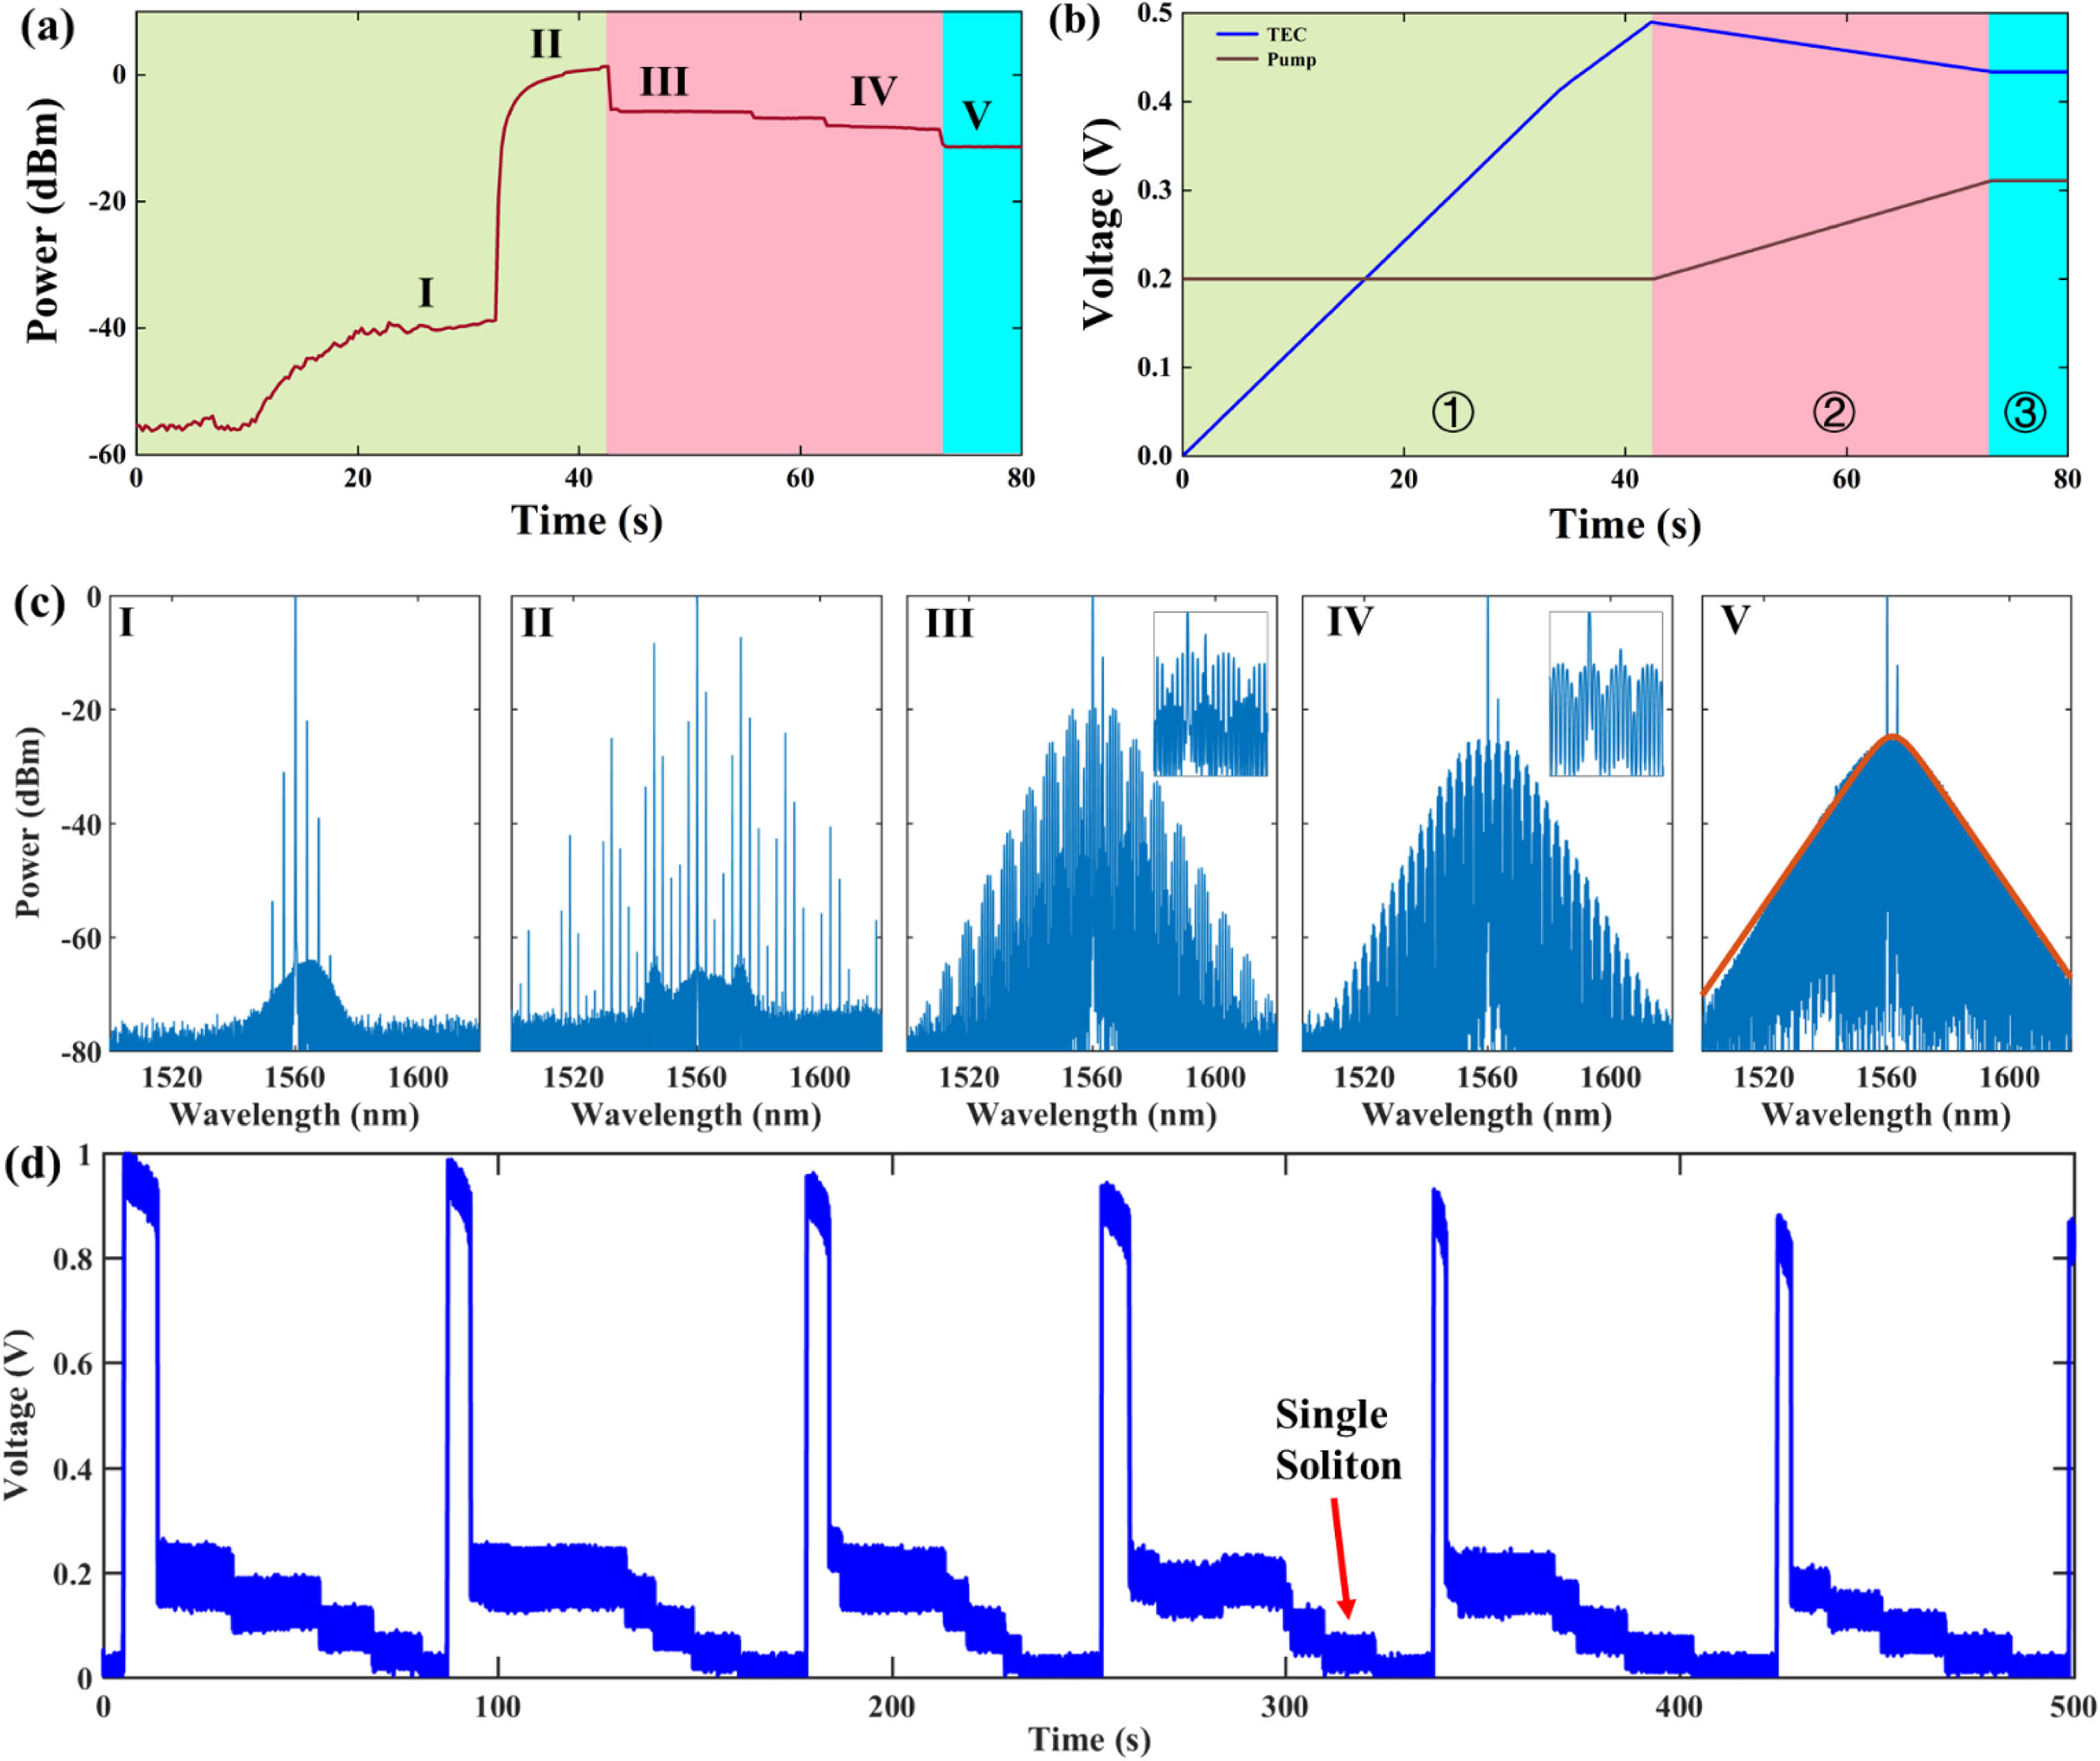
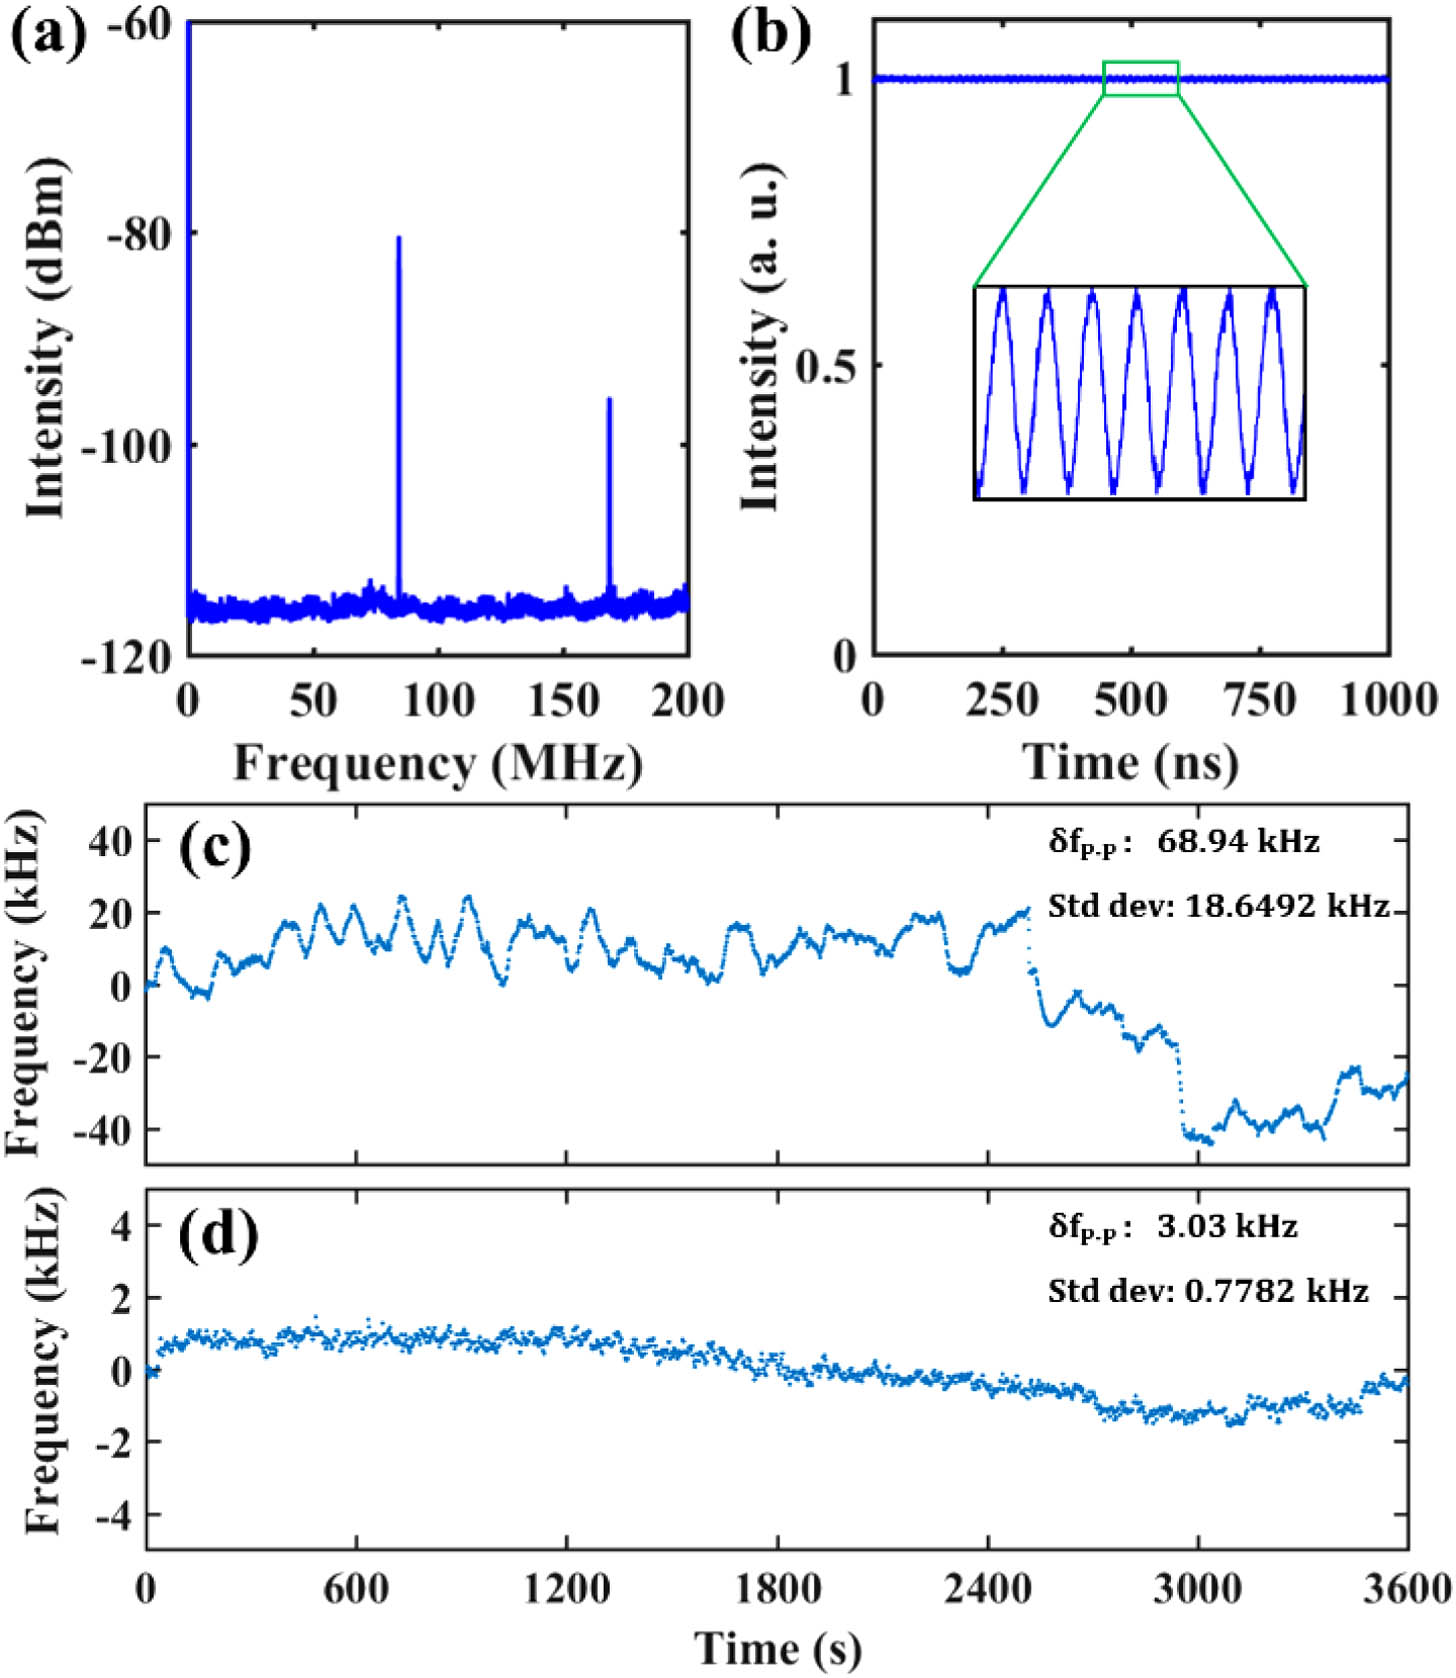
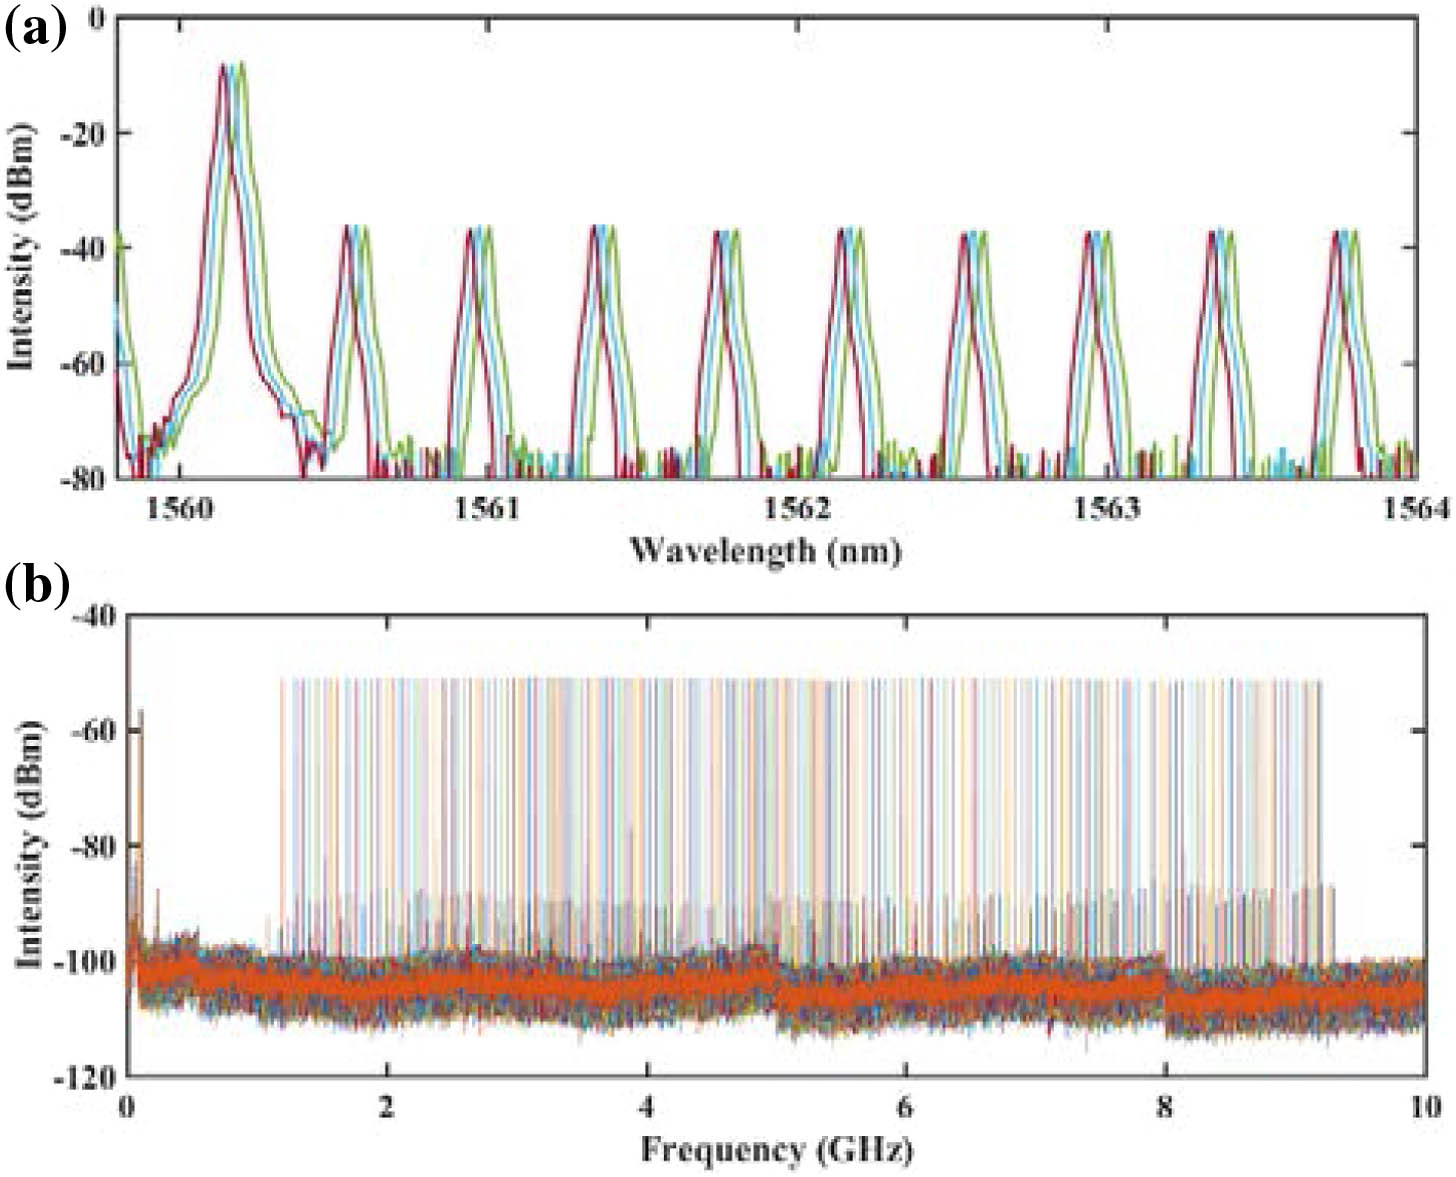
Fig. 4. Performance of a single SMC. (a) The radio frequency spectrum. (b) The waveform of a single SMC, which has an intensity modulation of approximately 1%. (c) and (d) The repetition rate fluctuation of single SMC without and with the beating frequency locking, respectively.
Xinyu Wang, Peng Xie, Weiqiang Wang, Yang Wang, Zhizhou Lu, Leiran Wang, Sai T. Chu, Brent E. Little, Wei Zhao, Wenfu Zhang. Program-controlled single soliton microcomb source[J]. Photonics Research, 2021, 9(1): 01000066.


 PDF全文
PDF全文

