High Power Laser Science and Engineering, 2018, 6 (3): 03000e49, Published Online: Aug. 22, 2018
Implementation of a Faraday rotation diagnostic at the OMEGA laser facility  Download: 519次
Figures & Tables
Fig. 1. Experimental setup. (a) In this experiment, two  chlorine-doped plastic foils, separated by
  mm, were each irradiated with 351 nm, 5 kJ drive lasers in either a
  or 10 ns pulse. This generated two counter-propagating plasma flows, each of which then passed through a plastic grid with
  hole width and hole spacing, and collided with one another at
  after the start of the laser drive. The velocity of these flows prior to their collisions is
  . Additional
  laser beams are fired simultaneously to implode a
  diameter capsule consisting of a
 shell filled with
  gas at 6 atm and
  He at 12 atm. The implosion produces mono-energetic protons at 3.3 and 15 MeV which traverse the plasma and are then collected by a CR-39 nuclear track detector[1, 11, 12]. Thomson scattering (TS) uses a 30 J, 1 ns, frequency doubled laser beam to probe the plasma on the axis of the flow,
  from the center in a
  focal spot toward grid B. The scattered light is collected with
  scattering angle and the geometry is such that the scattering wavenumber is parallel to the axis of the flow. (b) Radiative hydrodynamic simulations using the code FLASH predict the electron density 36 ns after the start of the laser pulse and show the interaction region where the two jets have collided. Both proton radiography and Faraday rotation are path-integrated measurements. The proton radiography path length,
  , is equal to the scale length of the electron density, in this case 0.6 mm. The Faraday rotation path length,
  , is longer than that of proton radiography since the Thomson scattering region lies on the opposing side from which the probe beam originates and so passes through the interaction region (where the density is larger) twice. Consequently, in this experiment, the Faraday rotation path length
  . (c) Electron density along the TS beam path, from FLASH simulations[13–16]. The electron density increases as the beam passes through the jet-interaction region.
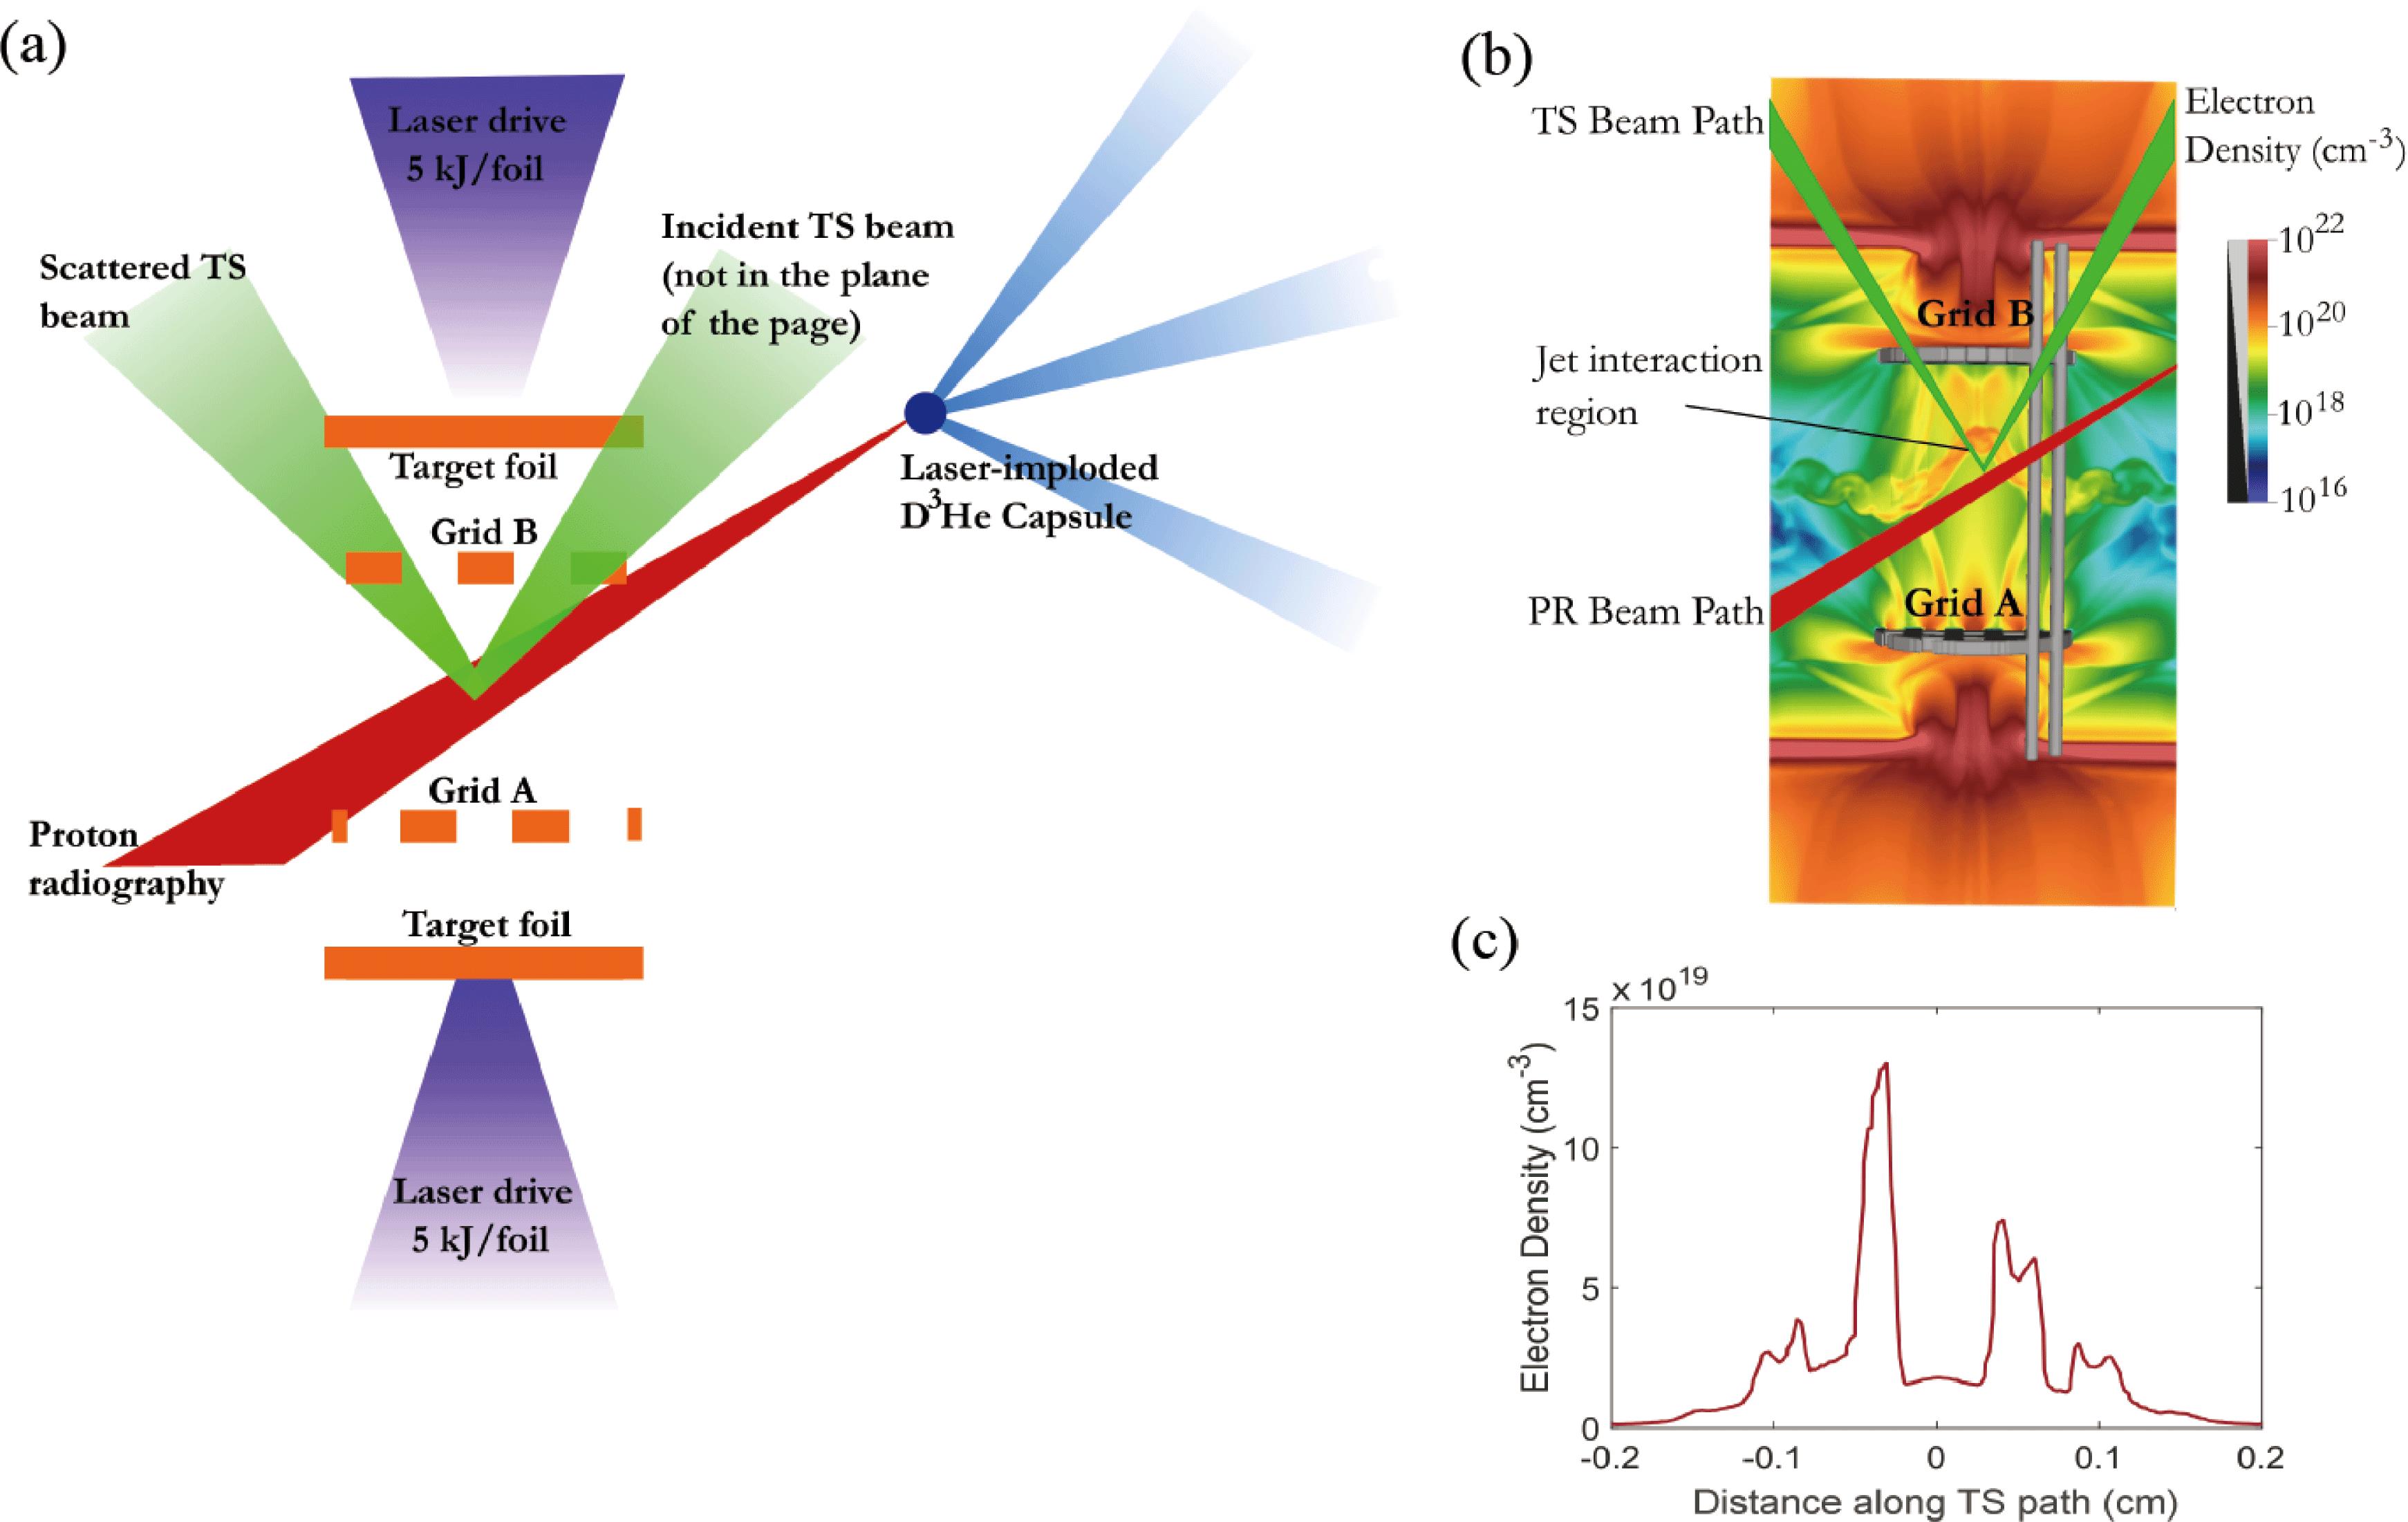
Fig. 2. Faraday rotation measurement setup. A  , 1–3 ns pulse probe beam is scattered from a
  region of the plasma and is collected using
  collection optics. The collected scattered light enters the insertable polarimetry setup. Four mirrors within the configuration align the scattered light onto a quartz Wollaston prism which separates the two polarizations with a
  angular separation. The scattered light is then further split and focused onto two spectrometers. The ion-acoustic wave spectrometer spectrally resolves both polarizations onto a streak camera. The electron plasma wave spectrometer measures the total scattered power across all wavelengths and so does not spectrally resolve the scattered light, and displays both polarizations onto a streak camera.

Fig. 3. Calibration shot: (a) EPW and (b) IAW. The dots at the top and bottom of both images indicate timing fiducials and appear once every 1.1 ns and 0.548 ns, respectively. The horizontal black dashed lines in the IAW image indicate the positions of the probe laser and also the stray light. The horizontal blue dashed line in the IAW image represents the separation between the S and P polarizations and so indicates the break in the vertical wavelength axis. The lineouts underneath both images show the integrated signal of the P polarization (red) and S polarization (blue).

Fig. 4. Calibration shot: the resultant angle from both the IAW (blue) and EPW (green) data for the calibration shot. The calibration shot is a single-jet shot for which no measurable magnetic field is expected.

Fig. 5. Shot 1: (a) EPW and (b) IAW. The dots at the top and bottom of both images indicate timing fiducials and appear once every 1.1 ns and 0.548 ns, respectively. The horizontal black dashed lines in the IAW image indicate the positions of the probe laser and also the stray light. The horizontal blue dashed line in the IAW image represents the separation between the S and P polarizations and so indicates the break in the vertical wavelength axis. The lineouts underneath both images show the integrated signal of the P polarization (red) and S polarization (blue).

Fig. 6. Shot 1: resultant angle from the IAW (blue) and EPW (green) data for shot 1 averaged over 100 ps.

Fig. 7. Shot 2: (a) EPW and (b) IAW. The dots at the top and bottom of both images indicate timing fiducials and appear once every 1.1 ns and 0.548 ns, respectively. The horizontal black dashed lines in the IAW image indicate the positions of the probe laser and also the stray light. The horizontal blue dashed line in the IAW image represents the separation between the S and P polarizations and so indicates the break in the vertical wavelength axis. The lineouts underneath both images show the integrated signal of the P polarization (red) and S polarization (blue).

Fig. 8. Shot 2: resultant angle from the IAW (blue) and EPW (green) data for shot 2, averaged over 100 ps. The IAW data is much noisier than the EPW data because the S polarization is very weak. Despite the noisiness in the IAW data, the EPW and IAW data have a similar angular distribution.

Fig. 9. Schematic of photometric calibration setup. Scattered light from the Thomson scattering probe beam is deposited onto the IAW streak camera and recorded on a CCD as pixel counts. Initially, an energy meter is placed at the position of the IAW streak camera and records the energy of the fiducial beam once it has passed through the vacuum chamber and Thomson scattering collection optics (but not the Faraday rotation optics). The measured transmitted energy of the fiducial laser is used to calibrate a reference energy meter which records a pick-off of the fiducial laser, taken before the fiducial laser enters the vacuum chamber. The reference energy meter can then be used to determine the energy of the transmitted fiducial beam at the IAW spectrometer position. The IAW spectrometer is returned to its standard position and the transmitted energy of the fiducial laser is recorded on the IAW spectrometer as pixel counts. The reference meter then indicates the total transmitted energy to the IAW spectrometer and so a relationship between the energy transmitted to and the number of counts registered on the IAW spectrometer can be determined. Finally, the Faraday rotation setup (Wollaston prism and turning mirrors) was characterized outside of this setup, by recording the reduction in the probe beam energy due to the Faraday rotation optics, which could then be included in the final calculation.

Fig. 10. Determining electron density and temperature. (a) An IAW image that can be used to determine the electron temperature of the plasma. This shot spectrally (vertical axis) and temporally (horizontal axis) resolves the ion features. A Thomson scattering spectra can then be fitted to this data to determine the electron temperature and so, through the full photometric calibration, determine the electron density for each Faraday rotation shot. The black dashed line indicates where the lineout in (b) is taken. (b) Lineout of raw data (red) from (a) with fitted spectra (blue solid line) indicating an electron temperature  . It has been assumed, as predicted by FLASH simulations in Ref. [13], that the electron density is
  , the ion and electron temperatures are equal and the plasma is fully ionized, giving an average ionization
  . The sensitivity of the fitted spectra to electron density is shown by additional spectra with electron densities of
  (purple dot-dashed line) and
  (green dotted line). (c) An EPW image that can be used to determine the electron density. The vertical band at
  nm is due to a filter that eliminates the probe light. This shot spatially (vertical axis) and spectrally (horizontal axis) resolved the electron features and so fitted Thomson scattering spectra can be found to determine the electron density. Aside from the differences in the EPW diagnostic, the experimental setup for this shot is the same as those shown previously with Faraday rotation data. The white dashed line indicates where the lineout in (d) is taken. (d) Lineout of raw data (red) from (c) with fitted spectra (blue solid line) indicating an electron density
  , similar to the value found in the full photometric calibration. The fitted spectra have an electron temperature of
  eV, as determined from fitting the IAW data. The sensitivity of the fitted spectra to electron density is shown by additional spectra with electron densities of
  (green dotted line) and
  (purple dot-dashed line).

Fig. 11. Shot 1: reconstructed magnetic field for shot 1. The red dashed lines indicate the extent the plasma within the Thomson scattering region can travel within the 2 ns delay between the proton radiograph and Thomson scattering measurements assuming the plasma travels at  . The mean field within this red square is used for comparison with the Faraday rotation diagnostic.

Fig. 12. Shot 2: reconstructed magnetic field for shot 2. The red dashed lines indicate the extent the plasma within the Thomson scattering region can travel within the 2 ns delay between the proton radiograph and Thomson scattering measurements assuming the plasma travels at  . The mean field within this red square is used for comparison with the Faraday rotation diagnostic.

Fig. 13. Comparison with proton radiography. The Faraday rotation path-integrated magnetic fields (red diamonds) for the shots described are compared with the path-integrated magnetic fields calculated from proton radiography (blue circles) for the same shots. The largest path-integrated field structure recorded by proton radiography (light-blue stars) is plotted for comparison.

A. Rigby, J. Katz, A. F. A. Bott, T. G. White, P. Tzeferacos, D. Q. Lamb, D. H. Froula, G. Gregori. Implementation of a Faraday rotation diagnostic at the OMEGA laser facility[J]. High Power Laser Science and Engineering, 2018, 6(3): 03000e49.


 PDF全文
PDF全文

