Chinese Optics Letters, 2017, 15 (8): 081401, Published Online: Jul. 20, 2018
Observation of intracavity electromagnetically induced transparency in Cs vapor coupled with a standing-wave cavity  Download: 800次
Figures & Tables
Fig. 1. (a) The
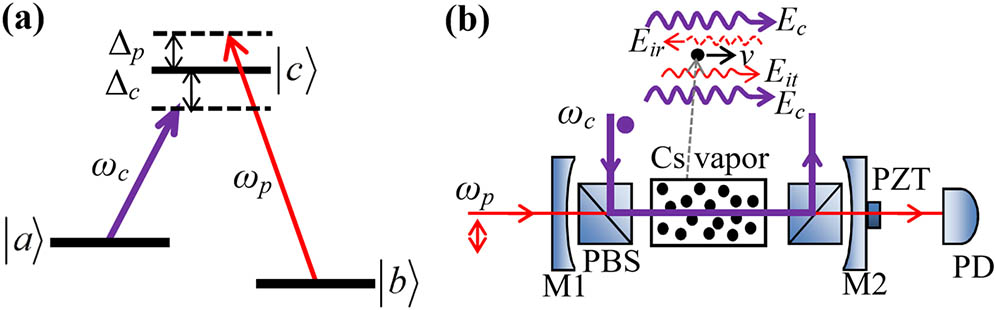
Fig. 2. (Color online) Cavity transmission spectrum versus the probe detuning in the different coupling powers at single-photon resonance (

Fig. 3. (Color online) Theoretical calculations of (a) dispersion and (b) absorption curves versus the probe frequency detuning for the Doppler-broadened medium in different cases: (1) the probe copropagates with the coupling field (red dashed lines); (2) the probe counterpropagates without the coupling field (blue solid lines).

Fig. 4. Theoretical plots of the normalized cavity transmission function as a function of the probe frequency detuning for RC (I) (dashed line) and SC (II) (solid line). The parameters used in the calculation are: 3 .

Fig. 5. The cavity transmission spectra versus the probe detuning at different coupling and cavity-mode detunings. The solid lines are the experimental measurement and the dashed lines are that of the theoretical simulation.


Haitao Zhou, Shaona Che, Pengcheng Zuo, Yuhong Han, Dan Wang. Observation of intracavity electromagnetically induced transparency in Cs vapor coupled with a standing-wave cavity[J]. Chinese Optics Letters, 2017, 15(8): 081401.


 PDF全文
PDF全文

