Collective absorption of laser radiation in plasma at sub-relativistic intensities
1 ELI-Beamlines, Institute of Physics, Czech Academy of Sciences, 25241 Dolní Břežany, Czech Republic
2 Institute of Plasma Physics of the CAS, Za Slovankou 1782/3, 18200 Prague, Czech Republic
3 Faculty of Nuclear Sciences and Physical Engineering, Czech Technical University in Prague, 11519 Prague, Czech Republic
4 Centre of Intense Lasers and Applications, University of Bordeaux, CNRS, CEA, 33405 Talence, France
5 School of Science, Xi’an Jiaotong University, Xi’an 710049, China
Figures & Tables
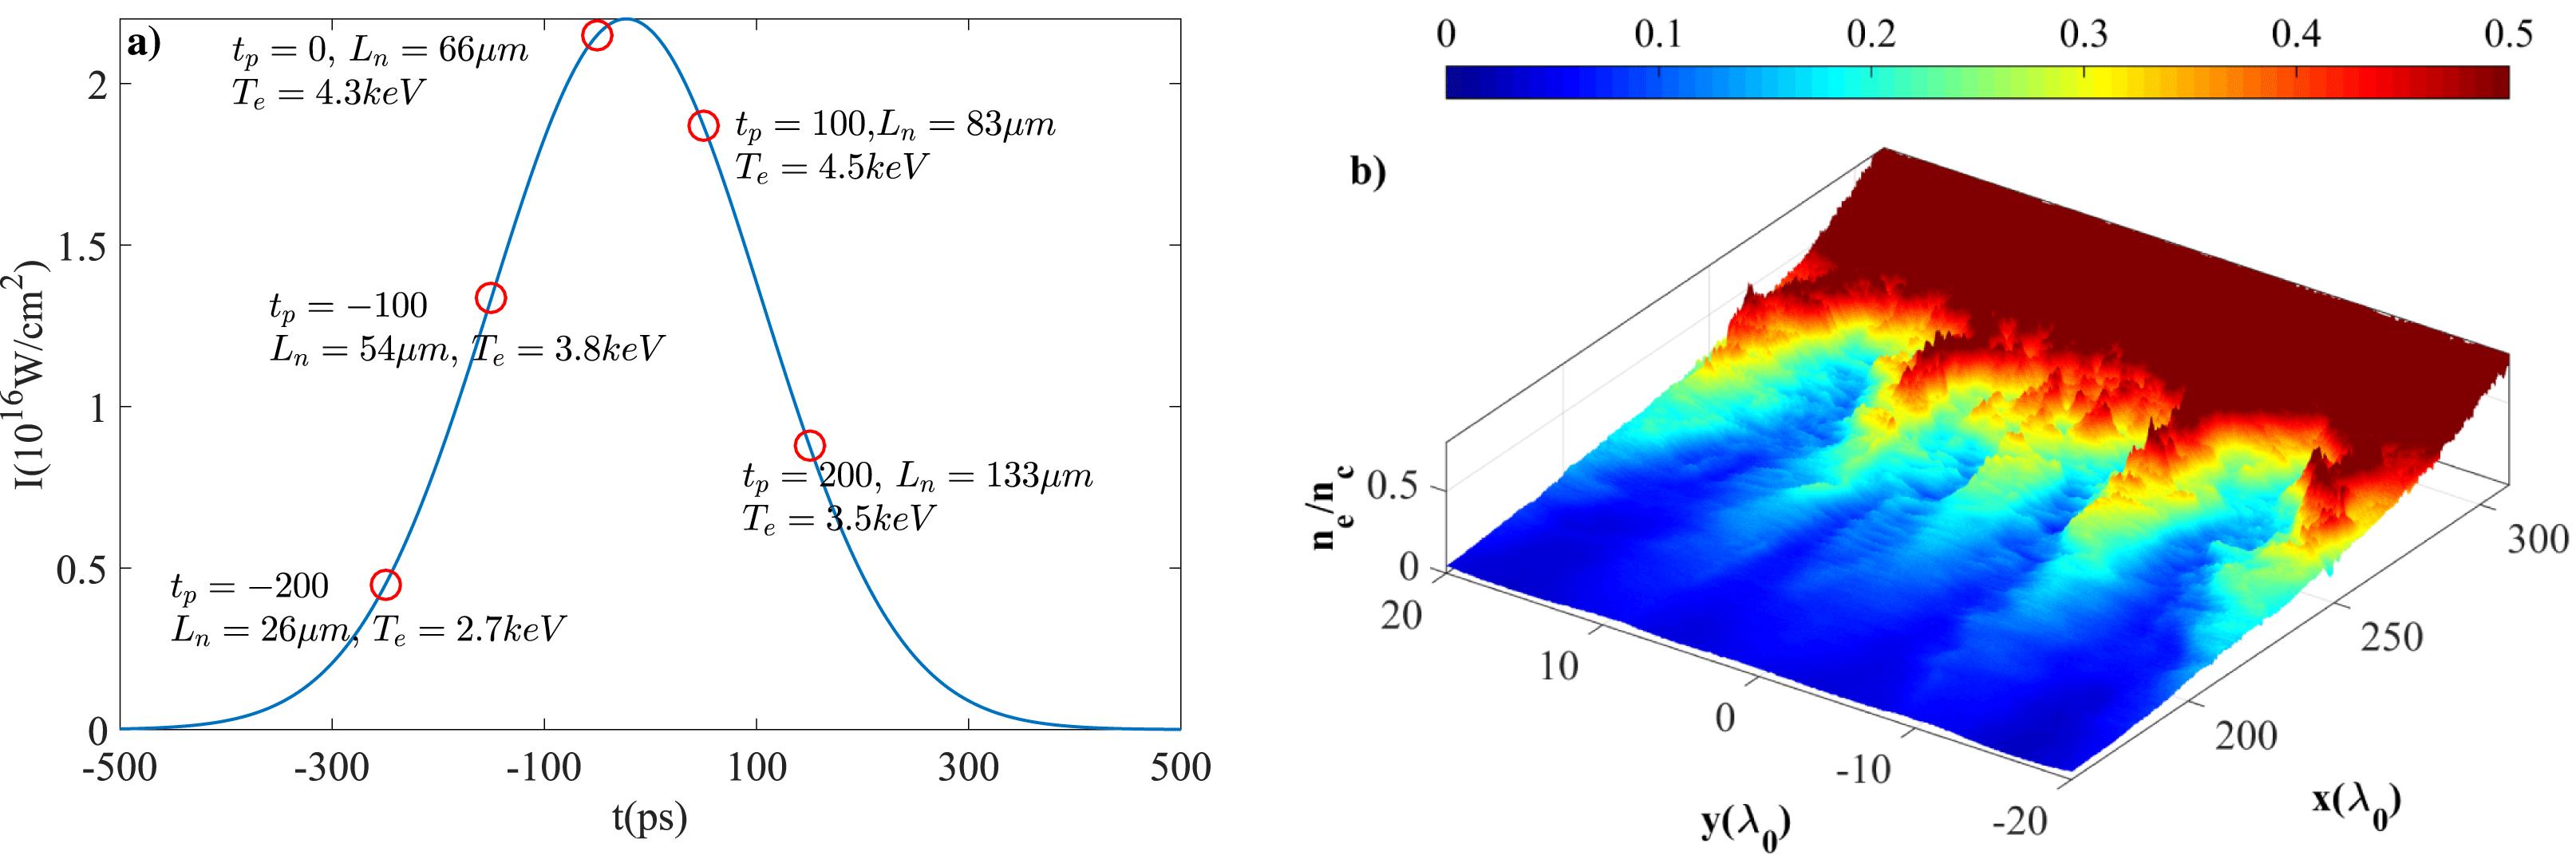
Fig. 1. (a) The pulse shape and the selected representative points for the kinetic simulations. (b) Typical filamentation structure observed in our simulations and represented by the electron density distribution at the time corresponding to the laser pulse maximum in panel (a).
下载图片 查看原文
Fig. 2. (a) Dependence of the longitudinal component of the electron energy flux $F_{x}$ (Equation (1)) on the plasma density averaged over the transverse coordinate and the last 1 ps of the simulation time. The electron energy flux is normalized to the instantaneous incident laser energy flux $F_{\text{las}}(t_{p})$. (b) Electron density profiles in the expanding plasmas used in PIC simulations. The five lines in both panels correspond to the pulse time $t_{p}$ given in Table 1: black $t_{p}=-200$ ps, blue $t_{p}=-100$ ps, red $t_{p}=0$, green $t_{p}=100$ ps and pink $t_{p}=200$ ps.
下载图片 查看原文
Fig. 3. (a) Distribution of the electron energy flux entering the overcritical plasma $n_{e}\gtrsim n_{c}$ on the parallel momentum, $\text{d}F_{x}/\text{d}p_{x}$. All curves are normalized to the total electron energy flux at that position. The five lines in both panels correspond to the pulse times $t_{p}$ given in Table 1. The color code is the same as in Figure 2. (b) Distribution of electrons in the plasma near the critical density as a function of the energy $\unicode[STIX]{x1D700}$ and the polar angle $\unicode[STIX]{x1D703}$. The laser pulse time $t_{p}=0$ and the quasi-steady phase of the simulation are considered. Color bar is in a logarithmic scale.
下载图片 查看原文
Fig. 4. (a) Magnetic field Fourier spectrum in the part of the simulation box corresponding to the densities below the quarter critical as a function of the longitudinal and transverse components of the wavevector. Color bar is in a logarithmic scale. (The spectrum calculated from the instantaneous code output provides only the absolute values of the wavevector components.) (b) Frequency spectra of the backward propagating radiation recorded at the front boundary of the simulation box during the quasi-steady phase of interaction, for different conditions according to Table 1. The results correspond to the pulse time $t_{p}=0$ and the quasi-steady phase of the interaction. The color code is: black $t_{p}=-200$ ps, blue $t_{p}=-100$ ps, red $t_{p}=0$, green $t_{p}=100$ ps and pink $t_{p}=200$ ps.
下载图片 查看原文
Fig. 5. (a) Fourier spectra of electromagnetic waves, (b) electron plasma waves – charge density, and (c) ion acoustic waves in the quarter critical density region for the laser pulse time $t_{p}=0$ and the simulation time $t=5$ ps. Color bars are in logarithmic units.
下载图片 查看原文
Fig. 6. (a) Distribution of the Poynting vector ($x$-component in W/cm$^{2}$) in real space around quarter critical density, (b) the charge density $(Zn_{i}-n_{e})/n_{c}$ and (c) the ion density normalized to the critical density $Zn_{i}/n_{c}$ for the laser pulse time $t_{p}=0$ and the simulation time $t=5$ ps. The solid black lines represent the density range between $0.22n_{c}$ and $0.28n_{c}$ on the initial density profile.
下载图片 查看原文
Fig. 7. (a) Spatial distribution of the Poynting vector ($x$-component in $\text{W}/\text{cm}^{2}$) in real space around the critical density, (b) the charge density $(Zn_{i}-n_{e})/n_{c}$ and (c) the ion density normalized to the critical density $Zn_{i}/n_{c}$ for the laser pulse time $t_{p}=0$ and the simulation time $t=5$ ps. The solid black lines represent the region $(0.9-1)n_{c}$ near the critical density.
下载图片 查看原文
Fig. 8. Fourier spectra of (a) electromagnetic waves, (b) electron plasma waves – charge density, and (c) ion acoustic waves in the region around critical density for the laser pulse time $t_{p}=0$ and the simulation time $t=5$ ps. Color bars are in logarithmic units.
下载图片 查看原文
Table1. Input laser and plasma parameters used in modeling of nonlinear interaction processes.
| Laser pulse | Intensity , | Density scale | Electron | Ion temperature |
|---|
| time , ps | | length , | temperature , keV | , keV |
|---|
| $-$200 | 4.5 | 26 | 2.7 | 0.15 | | $-$100 | 13.4 | 54 | 3.8 | 0.22 | | 0 | 21.5 | 66 | 4.3 | 0.25 | | 100 | 18.7 | 83 | 4.5 | 0.26 | | 200 | 8.8 | 133 | 3.5 | 0.20 |
|
查看原文
Table2. Energy balance in the simulation box observed in PIC simulations.
| Pulse time | Backscattered | Sidescattered | Transmitted | Hot electron | Bulk electron |
|---|
| , ps | fraction SBS/SRS | fraction | fraction | temperature, keV | temperature, keV |
|---|
| $-$200 | 0.40/0.001 | 0.55 | 0.05 | 48 | 2.9 | | $-$100 | 0.33/0.02 | 0.58 | 0.07 | 62 | 4.6 | | 0 | 0.12/0.03 | 0.64 | 0.21 | 90 | 5.7 | | 100 | 0.12/0.04 | 0.60 | 0.24 | 93 | 5.0 | | 200 | 0.35/0.02 | 0.60 | 0.07 | 57 | 4.4 |
|
查看原文
Y. J. Gu, O. Klimo, Ph. Nicolaï, S. Shekhanov, S. Weber, V. T. Tikhonchuk. Collective absorption of laser radiation in plasma at sub-relativistic intensities[J]. High Power Laser Science and Engineering, 2019, 7(3): 03000e39.


 PDF全文
PDF全文

