大样本图像质量主观评价方法  下载: 1107次
Subjective Image Quality Assessment for Large Samples
中国科学院长春光学精密机械与物理研究所, 吉林 长春 130033
图 & 表
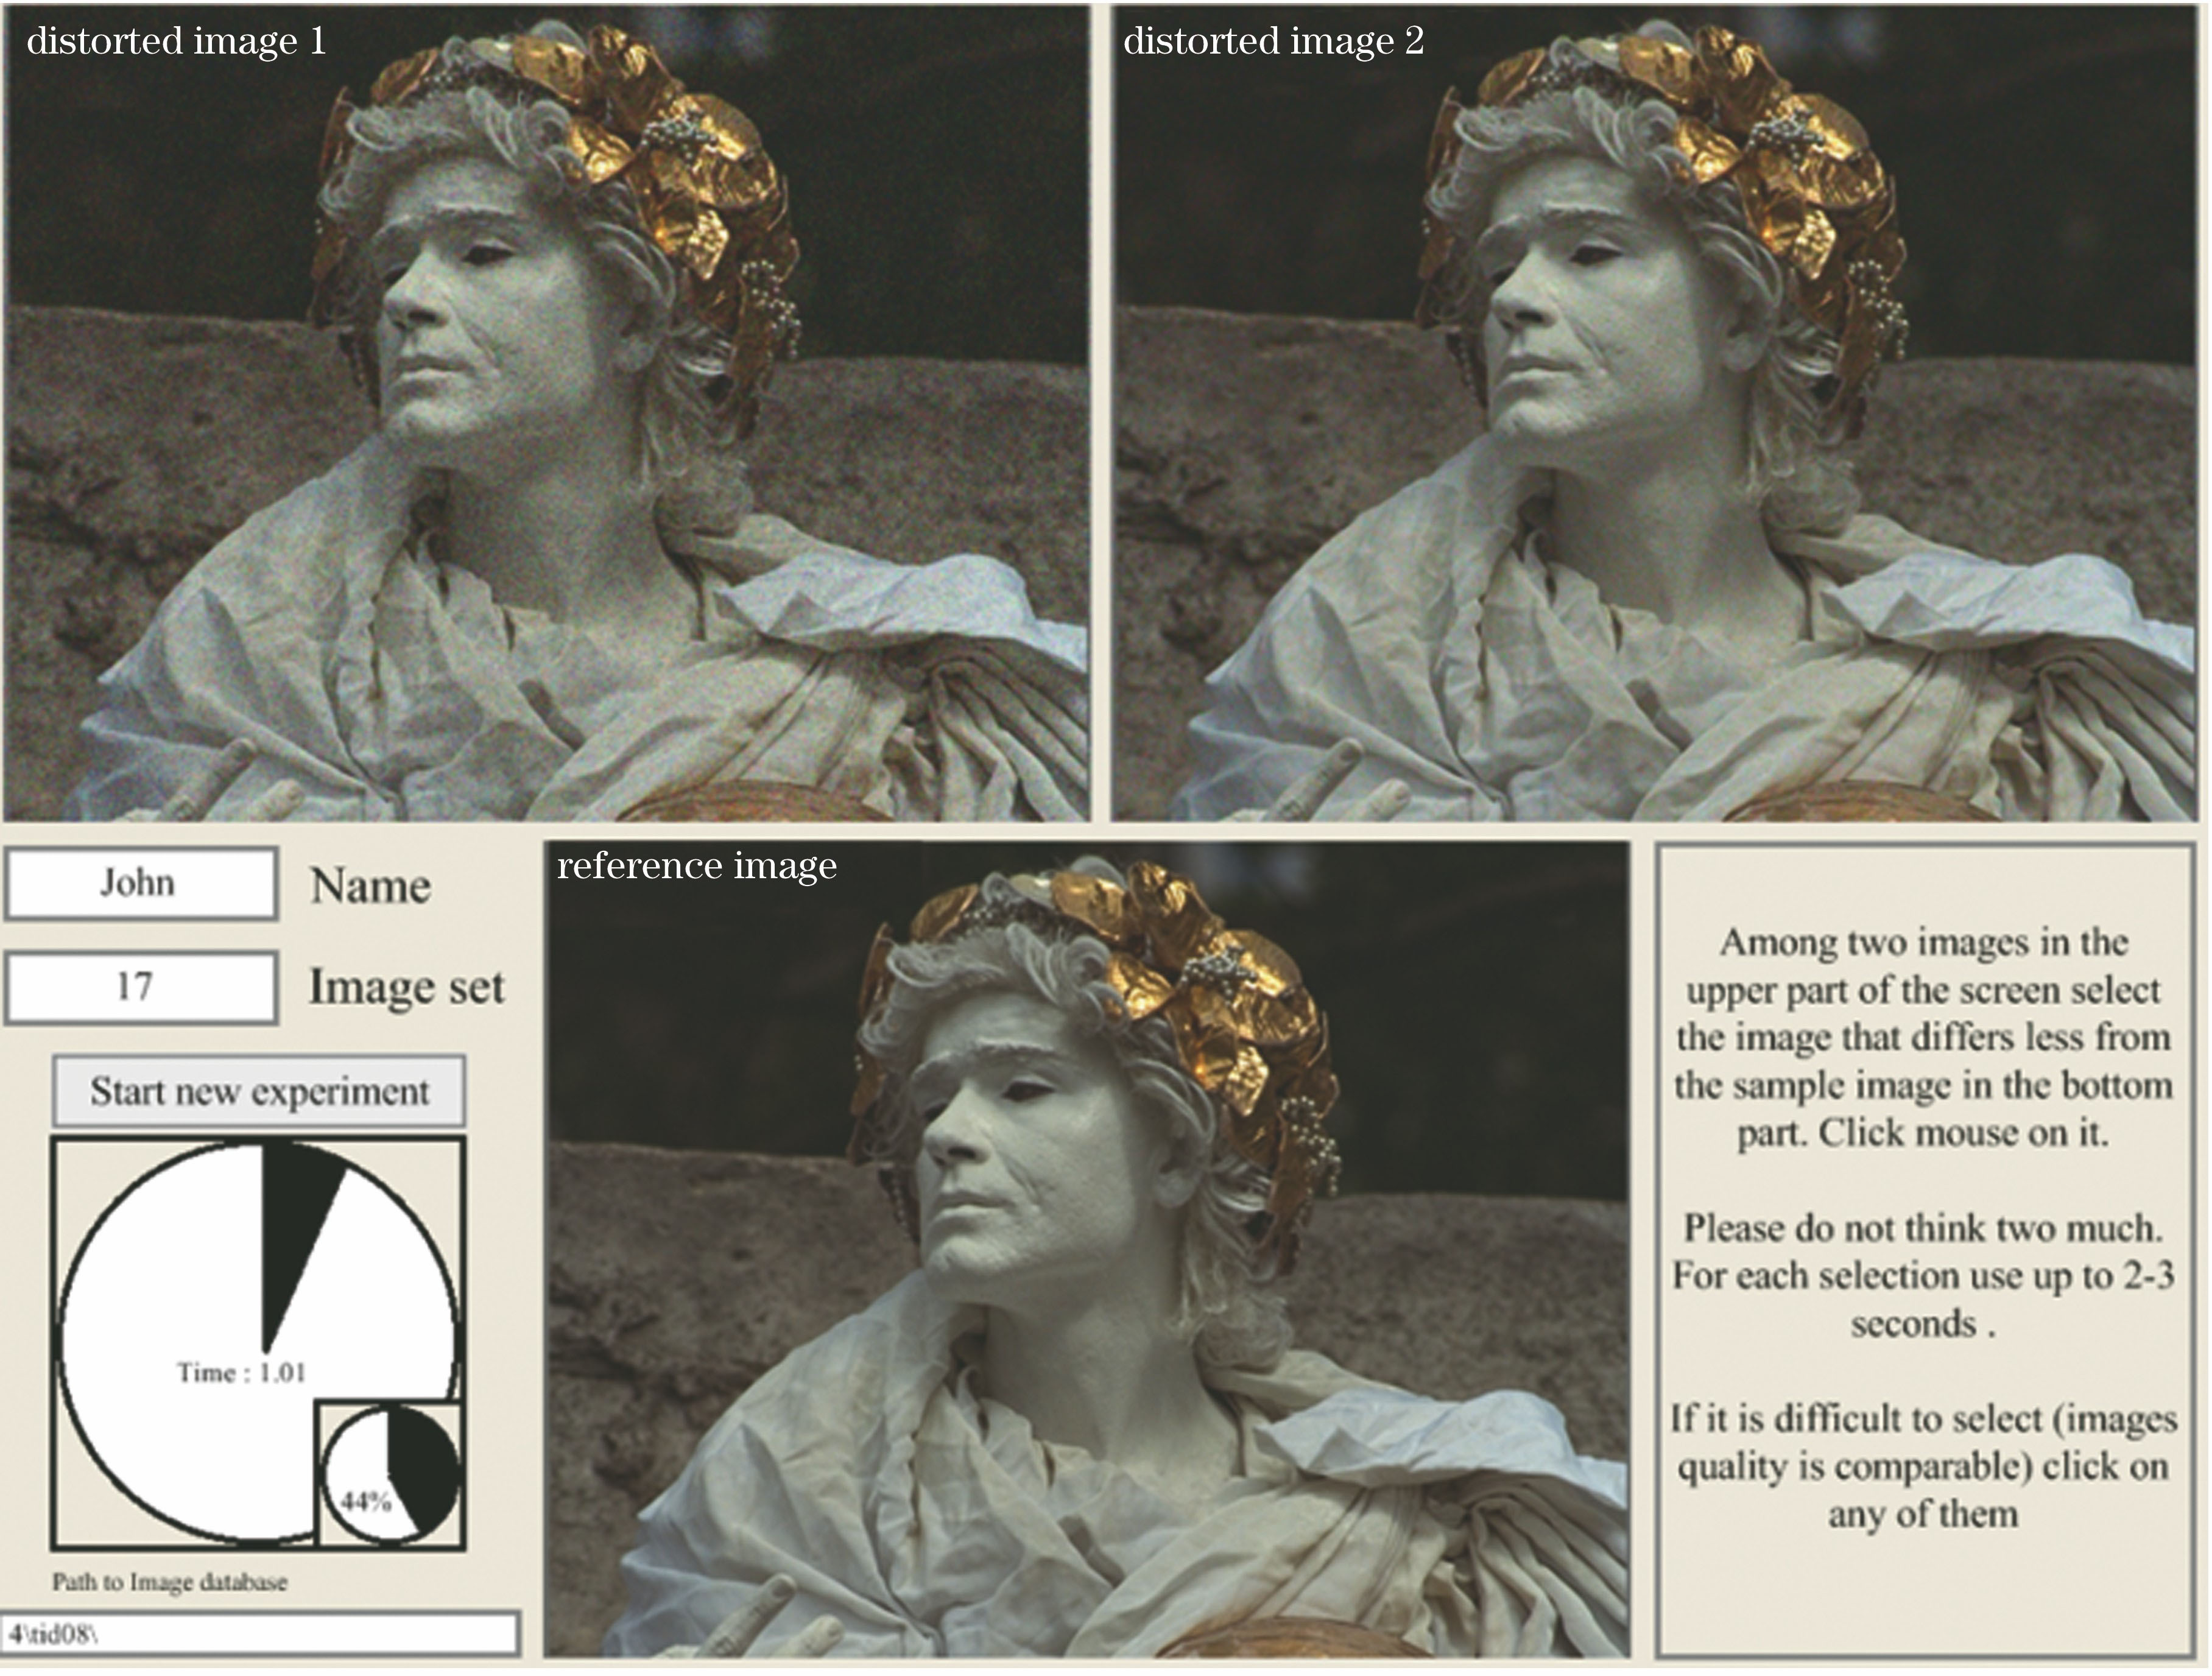
图 1. TID2013主观评价实验软件界面
Fig. 1. Screenshot of software used in subjective assessment experiments of TID2013
下载图片 查看原文
图 2. r1和r2对主观评价结果的影响
Fig. 2. Effects of r1 and r2 on results of subjective assessment
下载图片 查看原文
图 3. 循环积分测试界面
Fig. 3. Screenshot of software used in cyclical integrating
下载图片 查看原文
图 4. 最优选择测试界面
Fig. 4. Screenshot of software used in selecting best quality
下载图片 查看原文
图 5. 顺序调整测试界面
Fig. 5. Screenshot of software used in adjusting sequence
下载图片 查看原文
图 6. 参考图像
Fig. 6. Reference image
下载图片 查看原文
图 7. 主观评价实验结果
Fig. 7. Results of subjective assessment experiments
下载图片 查看原文
图 8. 图像动态聚类图
Fig. 8. Dynamic clustering diagram of images
下载图片 查看原文
图 9. 图像质量主观评价得分
Fig. 9. Subjective assessment scores of image quality
下载图片 查看原文
图 10. 可察觉差异测试软件界面
Fig. 10. Screenshot of software used in test of just-noticeable difference
下载图片 查看原文
图 11. 容易被感知到质量变化的区域
Fig. 11. Areas that are easily perceived to change in quality
下载图片 查看原文
图 12. 测试结果与真值的欧式距离
Fig. 12. Euclidean distances between test results and true values
下载图片 查看原文
图 13. 所提方法所得结果的标准差
Fig. 13. STDs of results obtained by proposed method
下载图片 查看原文
图 14. 与其他数据库的标准差比较
Fig. 14. Comparison of STDs between proposed method and other image quality databases
下载图片 查看原文
表 1常用图像质量数据库
Table1. Widely used image quality databases
| Database | Year | Reference | Distortion | Level | Total | Format | Resolution |
|---|
| LIVE(image) | 2006 | 29 | 5 | 5 | 1011 | BMP | ≤768×512 | | IVC | 2005 | 10 | 10 | 4 | 195 | BMP | 512×512 | | CSIQ | 2010 | 30 | 6 | 4-5 | 930 | PNG | 512×512 | | TID2008 | 2008 | 25 | 17 | 4 | 1725 | BMP | 512×384 | | TID2013 | 2013 | 25 | 24 | 5 | 3025 | BMP | 512×384 |
|
查看原文
表 2主观评价实验
Table2. Experiments of subjective assessment
| Database | Method | Score | Subject | Rating | Screen | Distance |
|---|
| LIVE(image) | SS | DMOS | 161 | 20-29 | CRT/21″ | 2Hs-2.5Hs | | IVC | DSIS | DMOS | 15 | 15 | CRT/21″ | 6Hs | | CSIQ | SS | DMOS | 25 | 5-7 | LCD/21″ | 80 cm | | TID2008 | DSCQS | MOS | 838 | 33 | LCD/19″ | 2Hs-4Hs | | TID2013 | DSCQS | MOS | 985 | 47 | LCD&CRT/19″ | 2Hs-4Hs |
|
查看原文
表 3ITU-R BT.500-13的主观评价质量尺度
Table3. Quality scale of subjective assessment for ITU-R BT.500-13
| Score | Distortion level | Score | Distortion level |
|---|
| -3 | Much worse | +1 | Slightly better | | -2 | Worse | +2 | Better | | -1 | Slightly worse | +3 | Much better | | 0 | The same | | |
|
查看原文
表 4简化后的主观评价质量尺度
Table4. Simplified quality scale of subjective assessment
| Score | Distortion level |
|---|
| +2 | Better | | +1 | The same |
|
查看原文
表 5平均JND
Table5. Mean JND
| Distortion level | 1 | 3 | 5 | 17 | 24 | 32 | 40 | 48 | 56 |
|---|
| Point spread blur radius | 0.31 | 0.94 | 1.56 | 5.31 | 7.50 | 10.00 | 12.50 | 15.00 | 17.50 | | Just noticeable difference | +0.33 | +0.28 | +0.34 | +0.51 | +0.66 | +0.97 | +1.52 | +1.93 | +3.35 | | Obvious difference | +0.69 | +0.75 | +0.84 | +1.86 | +2.05 | +2.66 | +2.84 | +3.67 | +3.96 |
|
查看原文
刘阳, 姜润强, 于洪君, 陈健. 大样本图像质量主观评价方法[J]. 激光与光电子学进展, 2019, 56(13): 131103. Yang Liu, Runqiang Jiang, Hongjun Yu, Jian Chen. Subjective Image Quality Assessment for Large Samples[J]. Laser & Optoelectronics Progress, 2019, 56(13): 131103.


 PDF全文
PDF全文

