Matter and Radiation at Extremes, 2019, 4 (2): 024402, Published Online: Oct. 17, 2019
Alignment of solid targets under extreme tight focus conditions generated by an ellipsoidal plasma mirror
Figures & Tables
Fig. 1. (a) Sectional view of the EPM, depicting the geometry. The boundary of the laser beam path is shown in red. Fin and Fout are the input and output foci, respectively, of the EPM. (b) Image of a machined EPM placed next to a 10  coin of diameter 17.5 mm. (c) Expected fluence in J/cm2 on the surface of the EPM when used with the PEARL laser delivering 20 J on target. All dimensions are in millimeters.
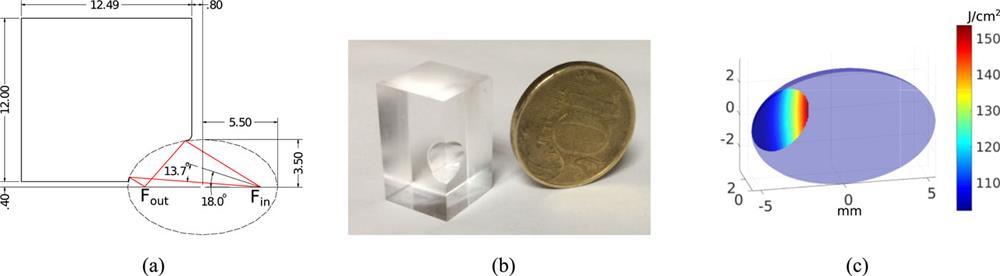
Fig. 2. Focal spot images normalized to peak intensity characterizing the performance of the EPMs. (a, b) Focal spot at the input (a) and output (b) of the EPM at the test bench. (c, d) Focal spots at the input (c) and (d) of the EPM at the PEARL laser facility as measured with low-power alignment beam. Field of view in all the images is 20 μ m × 20 μ m. The diameter of the full width at half maximum (FWHM) of the focal spot (ΦFWHM) and the fraction of energy enclosed within the FWHM (E enc) are given in each image.

Fig. 3. (a) Schematic of the setup used on the test bench to characterize the EPMs and benchmark the retro-alignment system. (b) Image of the setup, showing the physical layout of the components.

Fig. 4. Target alignment by monitoring the near field. (a) Schematic of the alignment method. (b) Near-field images during target alignment at the PEARL facility, showing the unobstructed near field, the shadow of the target moving from the right, and the shadow of the near field when the target was at the focus.


Deepak Kumar, Michal ?míd, Sushil Singh, Alexander Soloviev, Hannes Bohlin, Konstantin Burdonov, Gashaw Fente, Alexander Kotov, Livia Lancia, Vit Lédl, Sergey Makarov, Michael Morrissey, Sergey Perevalov, Denis Romanovsky, Sergey Pikuz, Ryousuke Kodama, David Neely, Paul McKenna, Tomá? La?tovi?ka, Mikhail Starodubtsev, Stefan Weber, Motoaki Nakatsutsumi, Julien Fuchs. Alignment of solid targets under extreme tight focus conditions generated by an ellipsoidal plasma mirror[J]. Matter and Radiation at Extremes, 2019, 4(2): 024402.


 PDF全文
PDF全文
