基于角度照明优化的傅里叶叠层显微成像方法  下载: 1445次
An Efficient Fourier Ptychographic Microscopy Imaging Method Based on Angle Illumination Optimization
1 杭州电子科技大学电子信息学院, 浙江 杭州 310018
2 中国科学院大学宁波华美医院, 浙江 宁波 315010
图 & 表
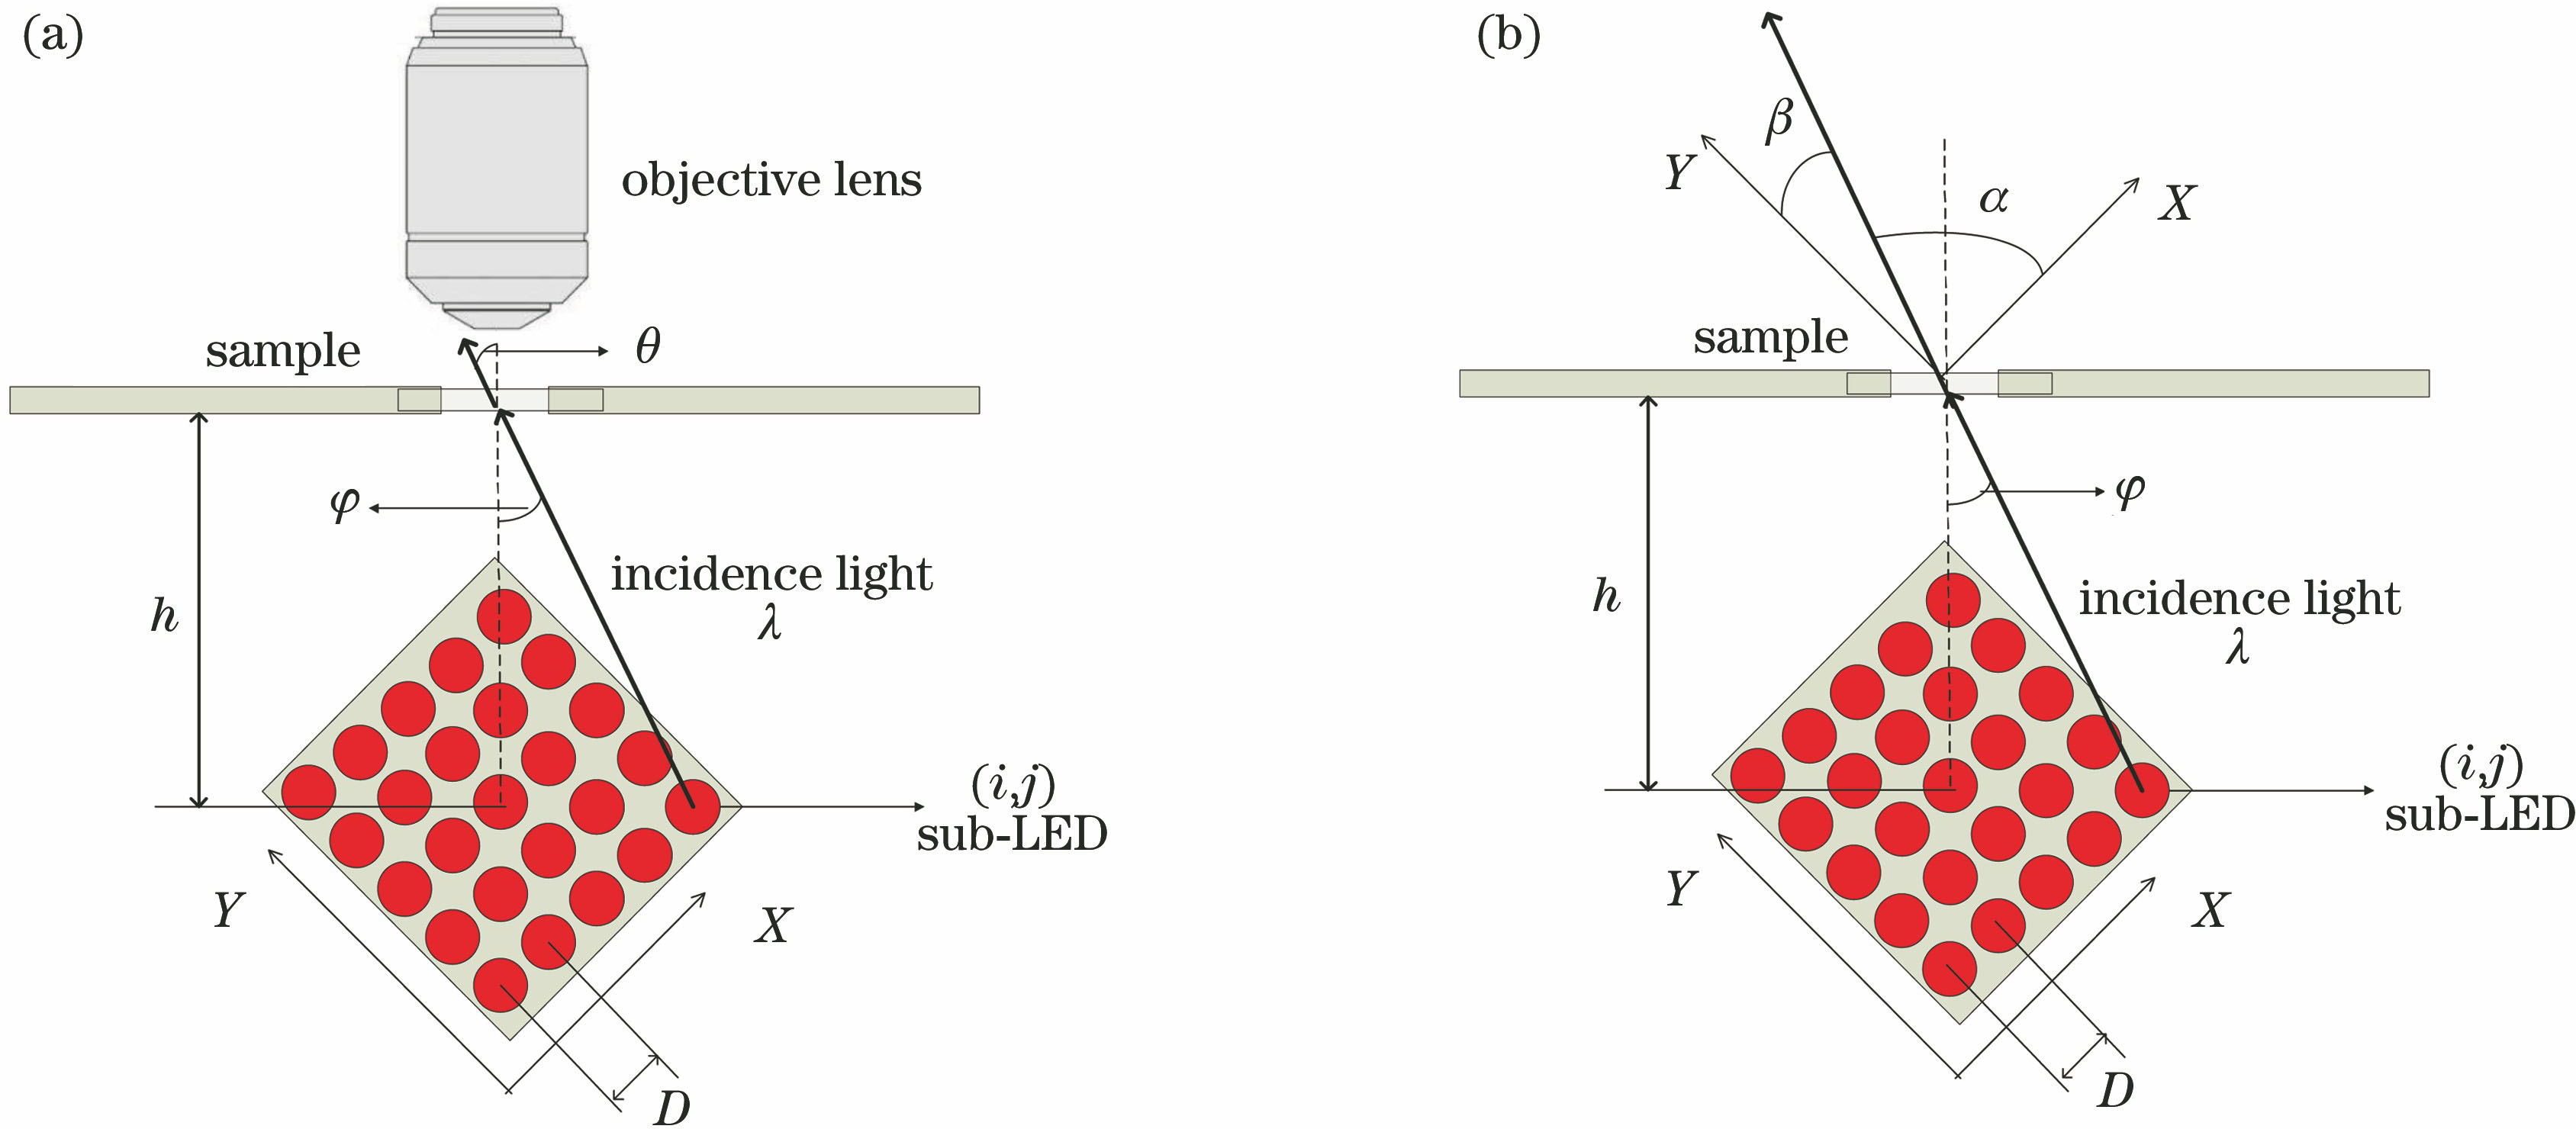
图 1. 装置中的空间位置关系。(a)装置空间关系与基本光路图;(b)包含边缘光线的具体光路图
Fig. 1. Spatial position relationship in the setup. (a) Spatial position relationship and basic light path of the setup; (b) specific light path with edge rays
下载图片 查看原文
图 2. FPM成像重建过程
Fig. 2. Recovery process of FPM
下载图片 查看原文
图 3. 频谱扩展后合成孔径的全频谱示意图
Fig. 3. Sketch map of synthetic aperture for full spectrum after spectrum extension
下载图片 查看原文
图 4. 测试图像。(a) 摄影男;(b)硬币;(c)图标;(d)米粒;(e) X光片;(f)轮胎;(g)标靶;(h)俯瞰图;(i)文字;(j)花
Fig. 4. Tested images. (a) Man; (b) coin; (c) icon; (d) rice; (e) X-ray image; (f) tire; (g) target; (h) aerial view; (i) text; (j) flower
下载图片 查看原文
图 5. 图4所示各图像对应的SSIM差异矩阵Dφ1 。(a) 摄影男;(b)硬币;(c)图标;(d)米粒;(e) X光片;(f)轮胎;(g)标靶;(h)俯瞰图;(i)文字;(j)花
Fig. 5. Dφ1 of SSIM corresponding to each image of Fig. 4. (a) Man; (b) coin; (c) icon; (d) rice; (e) X-ray image; (f) tire; (g) target; (h) aerial view; (i) text; (j) flower
下载图片 查看原文
图 6. 图4所示各图像对应的PSNR差异矩阵Dφ2。(a) 摄影男;(b)硬币;(c)图标;(d)米粒;(e) X光片;(f)轮胎;(g)标靶;(h)俯瞰图;(i)文字;(j)花
Fig. 6. Dφ2 of PSNR corresponding to each image of Fig. 4. (a) Man; (b) coin; (c) icon; (d) rice; (e) X-ray image; (f) tire; (g) target; (h) aerial view; (i) text; (j) flower
下载图片 查看原文
图 7. 基于菱形区域和4个角落原则优选最重要的M个LED的方法
Fig. 7. Selection method of most important LEDs following the principle of area of rhombus and four corners
下载图片 查看原文
图 8. 基于不同照明模式的仿真结果。(a1)(a2)原始高分辨率景物的幅度和相位图,(d1)(d2)幅度图的局部放大图;(b1)(b2)使用225个LED时的重建幅度和相位图,(e1)(e2)幅度图的局部放大图;(c1)(c2)使用57个LED时的重建幅度和相位图,(f1)(f2)幅度图的局部放大图
Fig. 8. Comparisons of simulated results under different patterns of LED angle illumination. (a1)(a2) Original input amplitude and phase of the high-resolution object, (d1)(d2) the partial enlargement of amplitude image; (b1)(b2) recovered complex amplitude (amplitude and phase) with conventional lighting one by one using 225 LEDs, (e1)(e2) the partial enlargement of amplitude image; (c1)(c2) recovered complex amplitude (amplitude and phase) with using 57 LEDs, (f1)(f2) the partial enlargement of amplit
下载图片 查看原文
图 9. 本文方法的实验装置以及光路图。(a)装置图;(b)光路图
Fig. 9. Setup and optical path of proposed method. (a)Setup; (b) optical path
下载图片 查看原文
图 10. 不同LED照明模式下的实验结果对比。(a) 垂直入射LED(中心LED)获得的原始图像数据与中心区域的局部图;(b)传统的225个LED照明模式下的重建图以及与中心区域的局部图;(c)所提(仅使用57个LED)照明模式下的重建图以及与中心区域的局部图;(d)中心区域局部图的强度曲线
Fig. 10. Comparisons of experimental results under different patterns of LED angle illumination. (a) Raw data with the vertical incidence LED (the central LED) and its local magnification; (b) recovered amplitude with conventional lighting one by one using 225 LEDs and its local magnification; (c) recovered amplitude with proposed method (only using 57 LEDs) and its local magnification; (d) intensity curves of the local map of the central area
下载图片 查看原文
图 11. 不同LED照明模式下的实验结果对比。(a) (b)垂直入射LED(中心LED)获得的原始图像数据与中心区域的局部图;(c1)(c2)传统的225个LED照明模式下的重建振幅图以及重建相位图;(d1)(d2)所提(仅使用57个LED)照明模式下的重建振幅图以及重建相位图
Fig. 11. Comparisons of experimental results under different patterns of LED angle illumination. (a) Raw data with the vertical incidence LED (the central LED); (b) local magnification; (c1)(c2) recovered amplitude and recovered phase with conventional lighting one by one using all 225 LEDs; (d1) (d2) recovered amplitude and recovered phase with our strategy (only using 57 LEDs)
下载图片 查看原文
表 1图8(b1)(c1)的重建幅度图的客观评价指标比较
Table1. Comparison of objective evaluation indexes for amplitude comparison of Fig. 8(b1) and (c1)
| Method | Image | Number of LED | PSNR | SSIM | GMG | LS |
|---|
| Conventional | Fig.8 (b1) | 225 | 30.7260 | 0.8260 | 12.5241 | 68.2657 | | Proposed | Fig.8 (c1) | 57 | 30.7044 | 0.8260 | 12.5309 | 68.2736 |
|
查看原文
表 2图8(e1)(e2)以及图8(f1)(f2)的重建幅度图的客观评价指标比较
Table2. Comparison of objective evaluation indexes for amplitude comparison of Fig. 8(e1), (e2), (f1), and (f2)
| Image | Number of LED | PSNR | SSIM | GMG | LS |
|---|
| Fig.8 (e1) | 225 | 29.3197 | 0.9063 | 16.9963 | 81.2069 | | Fig.8 (e2) | | 26.3856 | 0.6558 | 8.9412 | 46.7211 | | Fig.8 (f1) | 57 | 29.3847 | 0.9082 | 17.0095 | 81.3778 | | Fig.8 (f2) | | 26.4515 | 0.6542 | 8.9757 | 46.8287 |
|
查看原文
表 3图10的客观评价指标、重建效率的对比
Table3. Comparison of objective evaluation indexes and efficiencies for Fig. 10
| Method | Image | Number of LED | Time /s | GMG | LS |
|---|
| Conventional | Fig. 10 (b) | 225 | 1498.66 | 12.5241 | 68.2657 | | Proposed | Fig. 10 (c) | 57 | 388.79 | 12.5309 | 68.2736 |
|
查看原文
李通, 赵巨峰, 毛海锋, 崔光茫, 胡金星. 基于角度照明优化的傅里叶叠层显微成像方法[J]. 激光与光电子学进展, 2020, 57(8): 081106. Tong Li, Jufeng Zhao, Haifeng Mao, Guangmang Cui, Jinxing Hu. An Efficient Fourier Ptychographic Microscopy Imaging Method Based on Angle Illumination Optimization[J]. Laser & Optoelectronics Progress, 2020, 57(8): 081106.


 PDF全文
PDF全文

