Empowering perovskite PbTiO3 nanoparticles with enhanced up-conversion luminescence and thermal sensitivity by introducing Er3+ dopant  Download: 655次
1. Introduction
Up-conversion luminescence (UCL) materials with rare earth (RE) ions doping have deserved soaring attention in the past decades because of their excellent properties and potential applications in color displays, temperature sensor devices, drug delivery, photovoltaics, cell imaging, and tumor therapy[1
Perovskite-type oxides (), including , (PTO), , and , are intensively studied as the host materials[14
As a result of the excellent UCL properties, perovskite-type oxides are also used as temperature sensor materials. Such temperature sensing is a noncontact measurement with high sensitivity, high signal discriminability, and broad range dynamic imaging[16,24,26,27]. In this respect, several literatures have investigated the effects of temperature on the UCL in the RE-doped perovskite-type oxides. Sun et al. reported a maximum sensitivity of at room temperature for the co-doped ferroelectric ceramics[27]. Meanwhile, Mahata et al. demonstrated that ions can improve the temperature-sensing performance of the perovskite nanophosphors[16]. Recently, Gong et al. verified that the UCL intensity of -doped PTO (Er-PTO) nanofibers can be modulated by changing the phase structure and polarization intensity of the host materials[15,28]. When the ions are doped into preperovskite or perovskite PTO nanofibers, due to the differences of substitution sites and chemical environments, the preperovskite one had no UC emission, whereas the perovskite one exhibited green and red emissions. Moreover, the UCL emissions could be modulated by adjusting the tetragonality of the perovskite PTO nanofibers. However, the UC of RE-ions-doped PTO with nanoparticle morphology is rarely reported, as well as the temperature-sensing properties.
Herein, we prepared a series of perovskite Er-PTO nanoparticles with different doping concentrations by a facile hydrothermal method. The influences of dopant content on the morphology, microstructure, and UC emissions were investigated in detail. When the doping contents increased from 1% to 4% (mole fraction), the intensity of the green emission was decreased, but the intensity of the red one was increased. The maximum integrated intensity ratio of green/red (G/R) was observed at of 1% concentration. Besides, the effects of ions on the temperature-sensing performance (333 K to 493 K) were also studied. According to the fluorescence intensity ratio (FIR) technique, PTO materials with the ions doping concentration of 1% exhibited a maximum sensitivity of at 475 K.
2. Experimental Section
2.1 Synthesis of Er-PTO nanoparticles
Er-PTO (0, 1%, 2%, 3%, and 4%) samples were synthesized by the hydrothermal method. All chemical agents were purchased from Aladdin Chemical Corporation with analytical grade. Firstly, 2.07 g lead nitrate [] and erbium nitrate [] were dissolved together in deionized water to form the A solution. Meanwhile, 0.4 g commercial P25 ( powder) and 8.4 g potassium hydroxide (KOH) were added into 20 mL deionized water to achieve the B solution. Subsequently, the B solution was individually dropped into the A solution with violent stirring. Then, the obtained precursor suspension was transferred into the autoclave and heat treated at for 12 h. The resulting products were rinsed with deionized water and ethanol five times and dried in an oven at for 24 h. The obtained products were named PTO, 1% Er-PTO, 2% Er-PTO, 3% Er-PTO, and 4% Er-PTO for varying dopant concentrations from 0 to 4%, respectively.
2.2 Characterizations
X-ray diffraction (XRD) patterns were obtained on a Bruker D7 Advance power diffractometer by Cu Kα radiation (λ = 1.54056 Å, 1 Å = 0.1 nm). Scanning electron microscopy (SEM) pictures were collected by a MODEL SU8010 of Hitachi company. Transmission electron microscopy (TEM) results were taken on FEI F20 at a 200 kV accelerating voltage, as well as the high resolution TEM (HRTEM) images. The UC spectra were recorded by a HORIBA PL3-211-P spectrometer. A diode laser with wavelength of 980 nm was used to pump the powders.
3. Results and Discussion
The phase and structure variation of Er-PTO samples are verified by XRD tests. As shown in Fig. 1(a), all of the diffraction peaks of the samples can correspond well to the perovskite PTO (JCPDS 06-0452), as the doping contents of ions increased from 0 to 4%. Meanwhile, no distinct impurity phase can be detected in Er-PTO samples, implying that the introduced ions do not alter the pristine structure of PTO. Moreover, in order to reveal the subtle structure changes, the magnified XRD patterns in the range from 22° to 24° are displayed in Fig. 1(b). Apparently, the (100) peak positions of Er-PTO samples are gradually shifted to higher angles as the concentration increased from 0 to 2%, whereas the (100) peak positions shift toward the lower angle when the concentration increases to 3%. By considering the sequence of Shannon effective ionic radii (129 pm)][20], the ionic radius difference between the host and doped one will cause the change of lattice. Therefore, the ions substituted for the ions in the A site may cause shrinkage of the crystal lattices in perovskite PTO. As a result, XRD peaks shift to a higher angle. On the contrary, the replacement of ions for in the B site might lead to the expansion of crystal lattices in perovskite PTO, and hence the peaks shift to a lower angle. As illustrated in Fig. 1(b), the (100) peak positions of Er-PTO samples are gradually shifted to higher angles as the concentration increases from 0 to 2%, whereas the (100) peak positions shift toward a lower angle when the concentration increases to 3%. This result indicates that the doping will cause the lattice expansion at first and then shrinkage. Gong et al. reported that ions could occupy the B site () in perovskite PTO nanofibers by a heat treatment at 650°C in air for 1 h[28]. Moreover, our previous work indicates that ions can replace the A site in perovskite oxides as well[18]. Consequently, it can be easily inferred that ions may replace the ions first and then the ions.

Fig. 1. (a) XRD patterns of Er-PTO nanoparticles. (b) Magnification of (110) diffraction peaks.
The effects of doping on the morphology and microstructure of Er-PTO samples are observed by SEM. As depicted in Fig. 2(a), the pristine PTO sample exhibits plate-like morphology with a particle size distribution ranging from 0.5 to 2.5 µm. It is worth noting that the dopant has distinguishable effects on the morphology and particle size of PTO. As shown in Figs. 2(b) and 2(c), the particle size of the Er-PTO sample is reduced significantly along with doping concentration increasing from 1% to 2%, as well as the morphology of PTO becoming irregular and agglomerated. However, when the doping concentration increases from 2% to 4% [Figs. 2(c)–2(e)], the particle size changes slightly. This phenomenon could be attributed to the un-equivalent replacement of or ions by ions, in which the charge balance is disturbed in PTO. For the purpose of establishing the charge compensation, the vacancies or extra ions need to be introduced into the grain surface[29]. As a result, the diffusion of the crystal nucleus will be hindered, leading to the sluggish growth rate of PTO.

Fig. 2. SEM images of Er-PTO nanoparticles with different
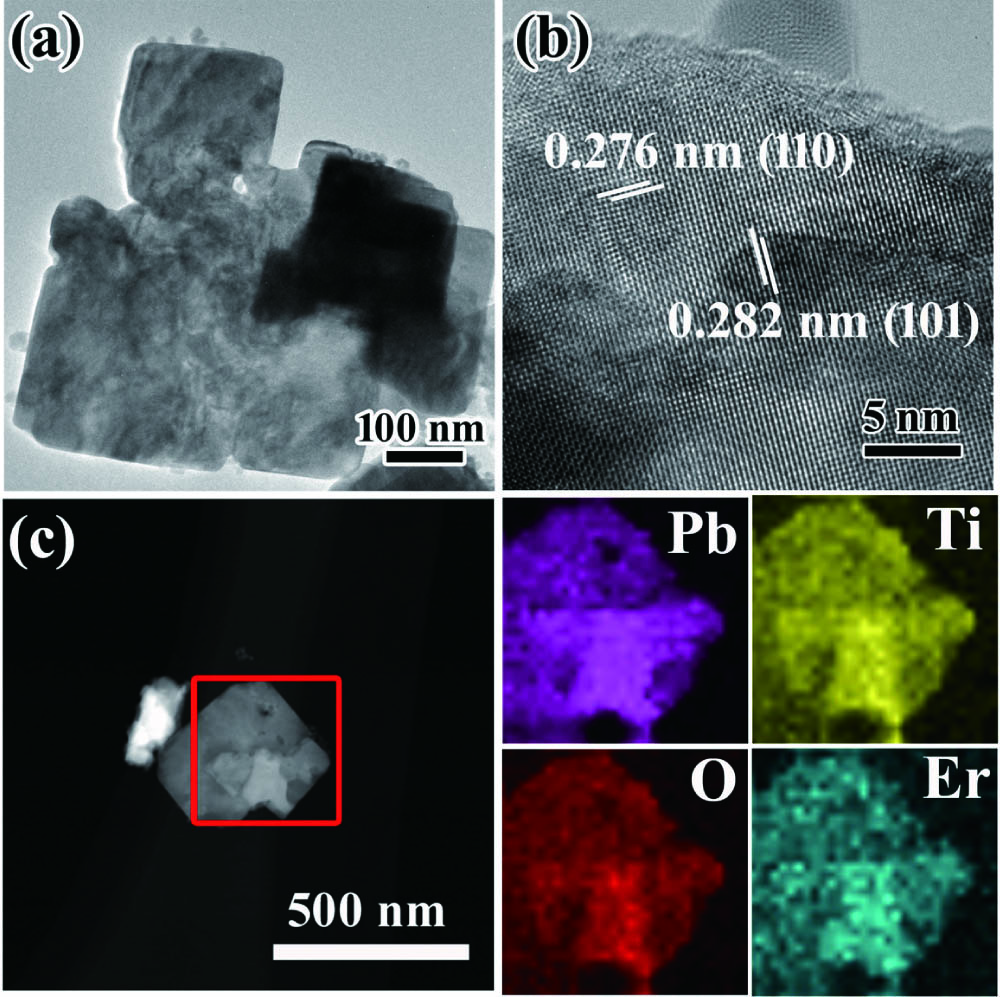
So as to further elucidate the chemical composition and microstructure of Er-PTO samples, TEM, HRTEM, scanning TEM (STEM), and energy dispersive spectroscopy (EDS) elemental mapping results of 1% Er-PTO sample are vividly illustrated in Fig. 3. Obviously, 1% Er-PTO sample has irregular plate-like morphology with a particle size of several hundred nanometers. To get a deep insight into the microstructure of 1% Er-PTO sample, the HRTEM image indicates that 1% Er-PTO sample is highly crystallized since the distinct orderly lattice fringes can be detected in Fig. 3(b). Additionally, the regular lattice fringes have interplanar distances of 0.282 nm and 0.276 nm, which belong to the (101) and (110) lattice planes of perovskite PTO, respectively. According to the STEM and EDS mapping results [Fig. 3(c)], the major elemental signals are Pb, Ti, O, and Er, which is consistent with the chemical composition of 1% Er-PTO sample. Moreover, it should be mentioned that Pb, Ti, O, and Er elemental signals have been detected, and all of them are distributed homogeneously. This result reveals the effective and uniform substitution of ions in PTO, which would significantly affect the UCL properties.

Fig. 3. (a) TEM, (b) HRTEM, and (c) STEM images and the corresponding EDS elemental mapping results of 1% Er-PTO sample.
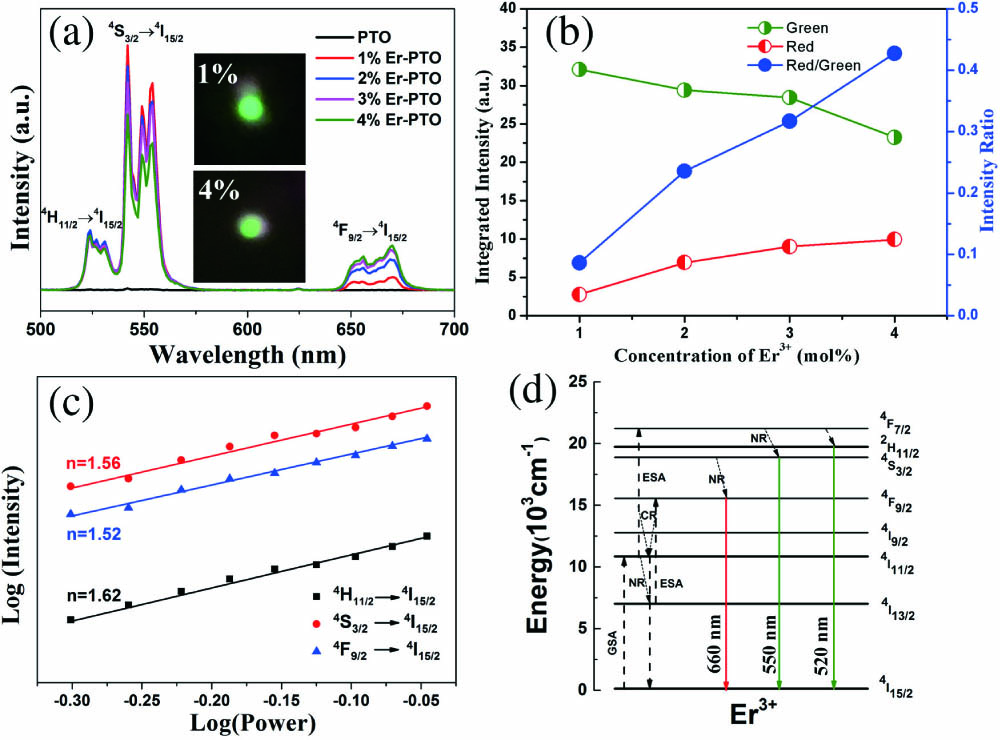
Figure 4(a) exhibits the UCL spectra of Er-PTO samples with doping concentration from 0 to 4% at room temperature, which are excited by a diode laser of 980 nm with the power of 500 mW. Apparently, no emission peak exists in the pristine PTO sample, which is similar to our previous work[30]. Interestingly, the UCL spectra of Er-PTO samples have two dominating emissions peaking at the center of 550 nm and 520 nm, originating from and states to transitions of ions. A faint red emission at 660 nm corresponds to the transition from state to . In order to intuitively observe the color change of the Er-PTO nanocrystals as the doping concentration increased, the digital photographs of 1% Er-PTO and 4% Er-PTO samples are added into Fig. 4(a). Both samples are green, which could be easily seen by the naked eye. But, the one with dopant content of 1% gets more stable green color output. Additionally, after a careful comparison, the intensity of these UCL emissions strictly depends on the doping concentration of ions. For the green emission, the integrated intensity is calculated from the range of , including and transitions. Meanwhile, the integrated intensity of the red emission centered at 660 nm is calculated from 640 nm to 680 nm. Firstly, we normalized the strength of two parts and then integrated the corresponding area of each part. The integrated intensity of samples and intensity ratio comparisons of red/green have been given in Fig. 4(b). The green emission intensity is gradually decreased as the concentration increased from 1% to 4%. In contrast, the intensity of the red one is increased slightly. As a result of the loss of intra ions and energy migration, the red/green intensity ratios exhibit an obviously increasing trend when the dopant concentration increased. In fact, the UC emission intensity and color of lanthanide-doped nanocrystals can be modified by controlling the nanocrystal size and the dopant concentration[8]. Generally, the smaller the particle size is, the larger the specific surface area is. Thus, the samples with small particle size will have larger specific surface area along with more surface defects, which may facilitate the non-radiative energy transfer processes and further suppress the UCL. Combined with the SEM and UCL results, the variation of UCL intensity should be attributed to two aspects: one is the particle size, and the other is the doping concentration, but the latter one is dominated. In order to investigate the energy migration process, the pump power dependent emission intensities of 1% Er-PTO phosphors are detected, as displayed in Fig. 4(c). It is worth noting that the UC intensities of the green emissions centered at 520 nm and 550 nm are calculated from the range of and , respectively. The relationship of the UC intensity and infrared excitation power for an unsaturated UC process can be calculated by the function of , where expresses the number of pump photons absorbed per photon emitted, and is the input laser power. The double logarithmic plots of pump power dependent emission intensities exhibit that the gradients of green and red emissions are 1.56, 1.62, and 1.52, respectively. This result indicates that two photons are employed to populate the , , and the transitions. However, the values of three slopes are much lower than the theoretical value of two. This could be explained by considering the cross-relaxation process. For example, two ions in level share their energy in such a way that one goes to the level, whereas the other goes to the level. Therefore, a part of the energy of the level is transferred back to the level, leading to the decrease of the slope value. Moreover, due to the pump power in our work ranging from 500 to 900 mW, a formation of heat may happen, and a part of the excitation energy will be lost[16].

Fig. 4. (a) Room temperature UCL spectra of Er-PTO (0, 1%, 2%, 3%, and 4%). The inset is the digital photographs of the 1% Er-PTO and 4% Er-PTO. (b) Plots of the integrated intensities versus the concentration of
To describe the energy transfer mechanisms of UC emissions in the prepared Er-PTO samples, the simplified energy-level diagram is presented in Fig. 4(d). At first, via a ground state absorption (GSA) process, the ions are excited from the ground state to . Subsequently, several extra nuclear electrons of ions in fall to the level via the non-radiative relaxation (NR) process and then are excited to the state through the GSA process. At the same time, the ions in the level would rise to the level by absorbing another 980 nm photon by an excited state absorption (ESA) process. Then, multiphoton relaxation (MPR) processes occurred, accompanied by NR of electrons to the , , or levels. Lastly, the electrons in the , , and levels drop to directly via a radiative process, resulting in the green (520 nm and 550 nm) and red emissions (660 nm).
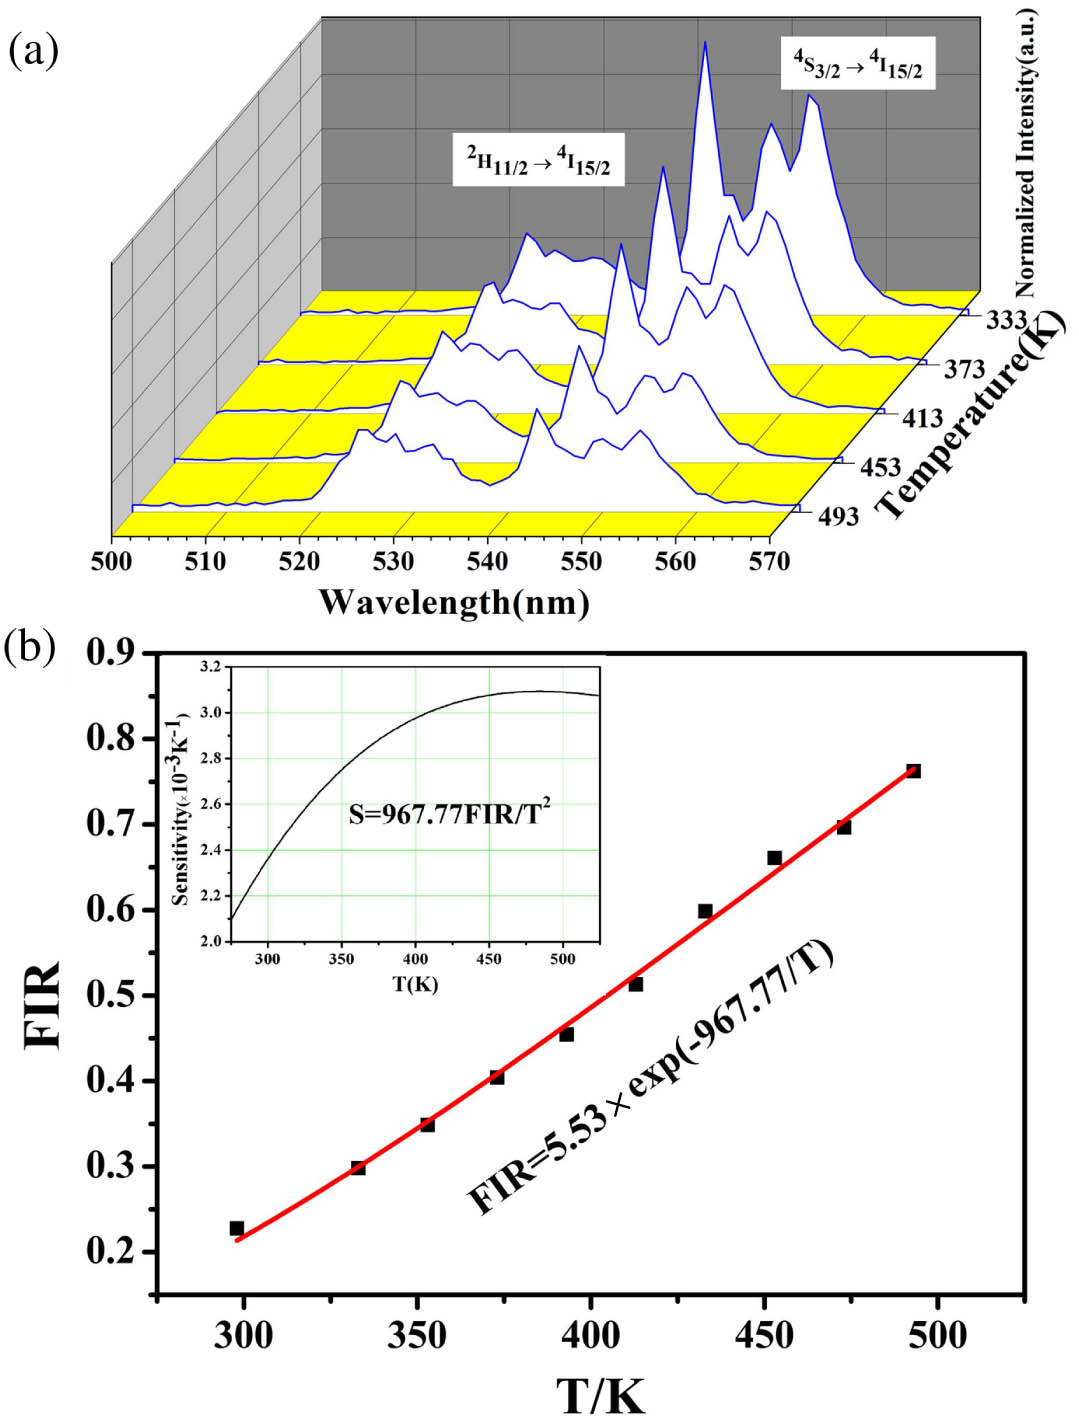
Generally, temperature plays an important role in the optical properties of UCL materials. As depicted in Fig. 5(a), the UCL spectra of 1% Er-PTO sample excited by 980 nm excitation are obtained with an environment temperature region of 333 K to 493 K. The (520 nm) and (550 nm) transitions are taken to investigate the sensing characteristic because of the thermal coupling. When the environment temperature rises to 493 K, the luminescence intensity of the 1% Er-PTO sample is reduced sharply, implying that the Er-PTO sample has a highly temperature-sensitive UCL performance.

Fig. 5. (a) Fluorescence emission spectra of 1% Er-PTO sample excited by 980 nm excitation with temperature from 333 K to 493 K; (b) temperature-sensing properties for 1% Er-PTO sample. The inset depicts the relationship between sensitivity and absolute temperature.
The integrated intensities ratio of and to transitions for the 1% Er-PTO sample is calculated from temperature-varied emission spectra. As presented in Fig. 5(b), a linear fitting is made for the calculated value of FIR and T. All of the experimental data in Fig. 5(a) were fitted by Eq. (1):in which and represent the integrated intensities of the and transitions, respectively; is a constant; implies the absolute temperature; means Boltzmann constant; is the energy gap between the and levels. is about , which could be calculated from the slope of the straight line.
Sensor sensitivity (S) is an essential factor to evaluate the function of the temperature sensors, which is delimited by Eq. (2):
According to Eq. (2), the sensitivity S is temperature dependent. The maximum senor sensitivity of the 1% Er-PTO sample is defined to be at 475 K [inset of Fig. 5(b)]. The result is similar to the S of other reported optical materials, especially the RE-doped ferroelectric oxides[16,27,31,32]. These results represent that the Er-PTO particles are good candidates for temperature sensing.
4. Conclusions
In summary, UCL Er-PTO samples without any impurities were prepared by the hydrothermal method. The introduced ions could replace the ions firstly and then the ions in PTO. The UCL spectra of Er-PTO phosphors revealed that all of the samples show two strong green emissions and a weak red emission under an excited 980 nm laser, which could originate from the , , and states to transitions of ions. Notably, the UC intensities were significantly dependent on the doping concentration. When the dopant concentration was 1%, the intensity ratio G/R exhibited a maximum value. Moreover, 1% Er-PTO sample has a high sensitivity of at 475 K. The excellent UCL performance and thermal sensitivity of Er-doped ferroelectric materials indicated great potential for multifunctional applications.
Article Outline
Jing Zhu, Shiqing Xu, Lei Lei, Feifei Huang, Zhen Xiao. Empowering perovskite PbTiO3 nanoparticles with enhanced up-conversion luminescence and thermal sensitivity by introducing Er3+ dopant[J]. Chinese Optics Letters, 2021, 19(2): 021601.


