Chinese Optics Letters, 2017, 15 (8): 081101, Published Online: Jul. 20, 2018   

Time-resolved multiple imaging by detecting photons with changeable wavelengths Download: 787次

Author Affiliations
1 MOE Key Laboratory of Weak Light Nonlinear Photonics and School of Physics, Nankai University, Tianjin 300071, China
2 National Laboratory of Solid State Microstructures and School of Physics, Nanjing University, Nanjing 210093, China
3 Collaborative Innovation Center of Advanced Microstructures, Nanjing University, Nanjing 210093, China
Abstract
Transporting information is one of the important functions of photons and is also the essential duty of information science. Here, we realize multiple imaging by detecting photons with changeable wavelengths based on time-resolved correlation measurements. In our system, information from multiple objects can be transported. During this process, the wavelength of the photons illuminating the objects is different from the wavelength of the photons detected by the detectors. More importantly, the wavelength of the photons that are utilized to record images can also be changed to match the sensitive range of the used detectors. In our experiment, images of the objects are reconstructed clearly by detecting the photons at wavelengths of 650, 810, and 1064 nm, respectively. These properties should have potential applications in information science.

Imaging is a general way of transporting information. For traditional imaging, a lens (or a set of lenses) is utilized to collect the photons passing through the object to a screen (or detector). Under a suitable geometric arrangement of the object, lens, and screen, a clear image will be obtained on the screen.

In 1995, as a new imaging method, ghost imaging, was demonstrated by using entangled two-photon pairs (signal and idler) created by spontaneous parametric downconversion (SPDC)[1]. Later, this imaging method was also theoretically and experimentally explored by using an unentangled light source[220" target="_self" style="display: inline;">20]. For ghost imaging, two (reference and test) beams with strong spatial correlations are used. The test beam meets the object first, while the reference beam without interacting with the object reaches a pixelated detector directly. Then a “bucket” detector with no spatial resolution is used to collect the photons that have passed through the object in the test beam. An image of the object is obtained by a coincidence measurement between the signals coming from the pixelated detector and the “bucket” detector. Compared with traditional imaging, ghost imaging has its own advantages such as it allows the objects to be located in optically harsh or noisy environments without influencing the quality of the image[2123" target="_self" style="display: inline;">–23]. This unique feature is very useful in some applications, such as satellite and aircraft-to-ground-based distant imaging[24].

Recently, Lemos et al. realized a novel imaging system with undetected photons based on induced coherence without induced emission[25,26]. Two nonlinear crystals are used. The first nonlinear crystal is pumped to create photon pairs (idler and signal) from the SPDC process[27]. The idler photon produced from the first nonlinear crystal passes through the object and then overlaps with the idler photons created by the second nonlinear crystal. The image of the object can be extracted from the interference pattern of the signal photons coming from the two nonlinear crystals. Different from traditional imaging, photons for imaging collected by the detector are not the photons that have passed through the object. This is the reason why this process is very interesting. The nonlinear process in the second nonlinear crystal is regarded as induced coherence without induced emission[2831" target="_self" style="display: inline;">31].

In this work, we present and demonstrate an imaging method of detecting photons with variable wavelengths based on time-resolved correlation measurements. In our experiment, the wavelength of the photons detected by the detectors is different from that illuminating the objects. Since two nonlinear beta barium borate (BBO) crystals are used as the wavelength converters, the wavelength of the photons that are utilized to record images can be changed to match the sensitive range of the used detectors. Images of the objects have been reconstructed successfully by detecting the photons at wavelengths of 650, 810, and 1064 nm, respectively.

To describe our idea clearly, studying some properties of the time-resolved correlation of the laser pulses will be helpful. A femtosecond (fs) pulsed laser (Coherent, Inc.) as the light source has a central wavelength of 810 nm, a pulse duration of 140fs, and a repetition rate 80MHz (the interval between two pulses is 12.5ns). The result of the coincidence measurement between two paths is shown by the inset in Fig. 1, where the scatters are experimental data and the red curve is the corresponding Gaussian fit. Its profile is similar to the experimental coincidence measurement result in Ref. [32]. It should be noted that the Gaussian profile of our coincidence measurement comes from the fact that the light source is a fs pulsed laser. For a continuous-wave coherent light source, however, the coincidence measurement curve should be a straight line. When the two paths have the same optical length, the peak of the data profile will locate at Δt=0. When the two paths have different optical lengths, the peak of the data profile will move away from Δt=0. The width of the shadow area Δτ, which corresponds to the full width at half-maximum (FWHM) of the Gaussian profile, is 0.8ns. The resolution of our coincidence counter is 0.15ns. In our experiment, we set the time window Δτwin to be equal to the FWHM (Δτwin=Δτ=0.8ns). The experimental data in the shadow area are counted for extracting the information of objects in our experiment.

Fig. 1. Experimental setup for time-resolved multiple imaging with undetected photons. The light source is a fs pulsed light source at a central wavelength of 810 nm with a pulse duration of 140fs and a repetition rate of 80MHz (the interval between two pulses is 12.5ns). Two BBO crystals are used to realize the wavelength conversion. The process of second-harmonic generation happening in BBO1 will transform the wavelength from 810 to 405 nm. SPDC occurs in BBO2 and transforms the wavelength from 405 nm to the one that we need. DMs are used to remove the unwanted light. Here, DM1 transmits 405 nm light (96%) and reflects 810 nm light (97%). The other dichotic mirrors reflect 405 nm light (96%). There are three objects. O1 is letter “N”, O2 is letter “K”, and O3 is letter “U”. Plane “1” is the object plane; plane “2”, plane “3”, and plane “3” are the image planes of the object. (a) The scanning imaging system arrangement, where the detector D2 needs to scan step by step to reconstruct the images of the objects. (b) The imaging with the ICCD and the image preserving delay compensation system arrangement. Insert: Rotation of BBO2 to generate the photons with the needed wavelength from SPDC. When α=0.75°, photons with a 1064 nm wavelength can be collected by D2. When α=1.04°, the wavelength of photons that we can collect is 650 nm. Inset: Measurement of the time-resolved correlation of the fs pulsed laser used, experimental data (blue symbols) and Gaussian fitting profile (red curve).

下载图片 查看所有图片

In our experiment below, we set the time window Δτwin to be Δτwin=Δτ=0.8ns. Our experimental setup is shown in Fig. 1. After passing through a half-wave plate (HWP), light from the fs source is divided into two paths by a polarization beam splitter (PBS1). The reflected light is detected directly by a “bucket” detector D1, and its electrical signal output is used as a trigger to perform the coincidence measurement. The transmitted light with a power of 2W is focused by a lens to pump a nonlinear crystal (BBO1 with a dimension of 1.5mm×5mm×5mm) to generate the second harmonic with a power of 350mW at a central wavelength of 405 nm. Then a dichroic mirror (DM1) reflects the residual pump light at 810 nm. After collimated by a lens and passing through an HWP, the 405 nm light is divided into three paths by PBS2 and a beam splitter (BS). Three objects, O1 (letter “N”), O2 (letter “K”), and O3 (letter “U”), are inserted in the three paths, respectively. We assume the optical path length to be L for the PBS2-O1-PBS3 path, (L+ΔL) for the PBS2-O2-PBS3 path, and (L+2ΔL) for the PBS2-O3-PBS3 path. The 405 nm light in the PBS2-O2-PBS3 and PBS2-O3-PBS3 paths will lose a half of energy by another BS. The 405 nm light in the three paths is recombined on PBS3, and then passes through a 4f system composed of two lenses. It should be noted that all the three objects inserted into the three paths are located at the front focal plane of the 4f system (plane “1”) and the second nonlinear crystal (BBO2 with dimensions of 1mm×5mm×5mm) is located at plane “2,” which is the back focal plane of the 4f system. That is to say these three objects are imaged onto BBO2. The 405 nm light carrying the information of the three objects pumps BBO2. Under type-I degenerate collinear phase matching, entangled photon pairs with the same polarization and the same wavelength (810 nm) are generated by SPDC. After passing through BBO2, the 405 nm light is reflected by another DM. The entangled photon pairs pass through the second 4f system whose front focal plane is exactly located at the back focal plane of the first 4f system. Finally, the objects are imaged from plane “2” onto detection plane “3”. In the front of detector D2, an intermediate frequency (IF) with a 10 nm bandwidth centered at 810 nm is inserted to remove the unwanted light. The sensitive area of D2 is a circle with a diameter of 50 μm.

Because there are three paths that can be chosen to propagate from PBS2 to PBS3 for photons, the time difference between the electrical signals output from D1 and D2 should have three possible values, corresponding to the three peaks contained in our experimental results [Fig. 2(a)]. The time interval between two peaks is determined by the corresponding optical path difference. During our experiment, the PBS1-D1 and PBS1-PBS2-O1-PBS3-D2 optical paths have the same length. So the three peaks locate at Δt=0, 4, and 8 ns, corresponding to the time difference Δτpeak=ΔL/c=4ns, where ΔL=1.2m and c is the speed of light. The FWHM of every peak [width of the shadow area in Fig. 2(a)] is 0.8ns, which is the same as that in the inset of Fig. 1. The information carried by the three peaks contains the images of three objects (“N”, “K”, “U”), respectively. We set three coincidence windows centered at Δt=0, 4, and 8 ns, respectively. The information of each peak is extracted by recording only the counts within each window. By scanning the position of D2, we can finally reconstruct the images of the three objects. During each step, detector D2 will cover 50 μm. To record a frame image, the single-pixel detector D2 is scanned by 40×40=1600 steps. The experimental results are shown in Figs. 2(b1)2(b3). It should be noted that the 405 nm photons pass through the objects, while the 810 nm photons are used to extract the images. If we combine all of the information contained in the three peaks at each scanning step, the image reconstructed [Fig. 2(b4)] is a mixed image of the three objects.

Fig. 2. (Color online) Experimental results. (a) is an example of coincidence measurement between detector D1 and D2 for the scanning imaging system arrangement. (b1), (b2), and (b3) are images of the three objects reconstructed from the coincidence measurement. 40×40=1600 scanning steps are needed. Measurement time is about 5 seconds for each step. (b4) is a mixed image of the three objects achieved by extracting all information containing in the three peaks at each scanning step. (c1), (c2), and (c3) are images of the three objects by using the ICCD and image preserving delay compensation system arrangement. (c4) is the mixed image of the three objects recorded by triggering the ICCD with an internal pulse generator. (d) The red circles and the blue circles are the partial data of (b1) (along the red line) and (c1) (along the dark blue line), respectively, and the red and blue curves are the fitting results corresponding to the data shown by the red and blue circles.

下载图片 查看所有图片

As a comparison, we utilize another arrangement [Fig. 1(b)] to record the images, where an ICCD camera (a multi-megapixel array) is used. The intensifier of the ICCD camera can be triggered by using either an external pulse or an internal pulse generator. When it is triggered by an internal pulse generator, the ICCD is just like a normal CCD, but has a higher sensitivity. If it is triggered by an external signal, its gate width is set by the width of the input transistor-transistor logic (TTL) pulse from a single photon avalanche detector (15ns). To ensure that the photons detected by D1 and the ICCD camera are from the same pulse, the electrical delay in the ICCD triggering must be compensated by introducing the additional optical path in the ICCD path. In our experiment, a 20 m free-space delay line [composed of mirrors and lenses in Fig. 1(b)] is used to compensate for this electrical delay[33,34]. The electrical signal coming from D1 triggers the detection of the time-resolved photons by the ICCD. The images of three objects are recorded with the exposure time of 60 s and a TTL width of 3 ns at a ICCD chip temperature of 25°C. The photosensitive area of the ICCD was set to be 200×200pixels (corresponding to an area of 2.6mm×2.6mm, a size of 13μm×13μm per pixel). Inasmuch as there are three different optical paths from PBS1 to the plane “3”, the time delays are set to be 3ns for imaging O1 (letter “N”), 7ns for imaging O2 (letter “K”), and 11ns for imaging O3 (letter “U”), respectively. Thus, the time difference Δτdelay between O1 and O2 or between O2 and O3 is 4ns, which is the same as the time difference Δτpeak. Clearly, as the experimental results show in Figs. 2(c1)2(c3), three images have been obtained. However, if the ICCD is not triggered by the signal coming from D1, but triggered by an internal pulse generator, information about the three objects cannot be read out clearly because a mixed image of three objects is obtained [Fig. 2(c4)]. To compare our two imaging arrangements [Figs. 1(a) and 1(b)], the visibilities of the images for the letter “N”, obtained by the scanning imaging arrangement [Fig. 2(b1)] and recorded by the ICCD arrangement [Fig. 2(c1)], are calculated. The red circles and the blue circles in Fig. 2(d) show the experimental data corresponding to the red line in Fig. 2(b1) and the blue line in Fig. 2(c1), respectively. The red curve and the blue curve in Fig. 2(d) are the fitting results by combining the Gaussian and square-wave functions together. The experimental data gives a visibility of 83% for the red circles and 65% for the blue circles, respectively.

To further confirm our idea, we select the detected photons at two different wavelengths from 810 nm. We rotate BBO2 to change the phase-matching angle of BBO2. Thus, we can generate the photon pairs (idler and signal) at the different wavelengths we need. As mentioned above, when the 405 nm pump light is normally incident on BBO2, degenerate photon pairs at 810 nm will be generated. By rotating BBO2 with an angle of α=1.04°, the generated photon pairs have wavelengths of 650 and 1074.5 nm, respectively (a similar calculation process can be found in Ref. [35]). Considering that the single-photon counting module (Excelitas’ SPCM-AQRH Series) D2 had the highest detection efficiency of 65% at a wavelength of 650 nm, we choose the 650 nm SPDC signal photons for imaging, while the 1074.5 nm idler photons are blocked by using the IF with 10 nm bandwidth centered at 650 nm. The experimental procedure (as described previously) is performed to obtain the images of the three objects by detecting the 650 nm photons, and the experimental results are shown in Figs. 3(a1)3(a3). As a comparison, the three images reconstructed by the ICDD arrangement are shown in Figs. 3(b1)3(b3). Furthermore, we also explore the experimental results [Figs. 3(c1)3(c3)] by recording the 1064 nm SPDC idler photons (α=0.75°), because the id400 single-photon counting module (ID Quantique Int.) as detector D2 had the highest detection efficiency of 30% at a wavelength of 1064 nm. Clearly, as shown in Figs. 2 and 3, we can see that the images obtained by detecting photons at different wavelengths are very similar.
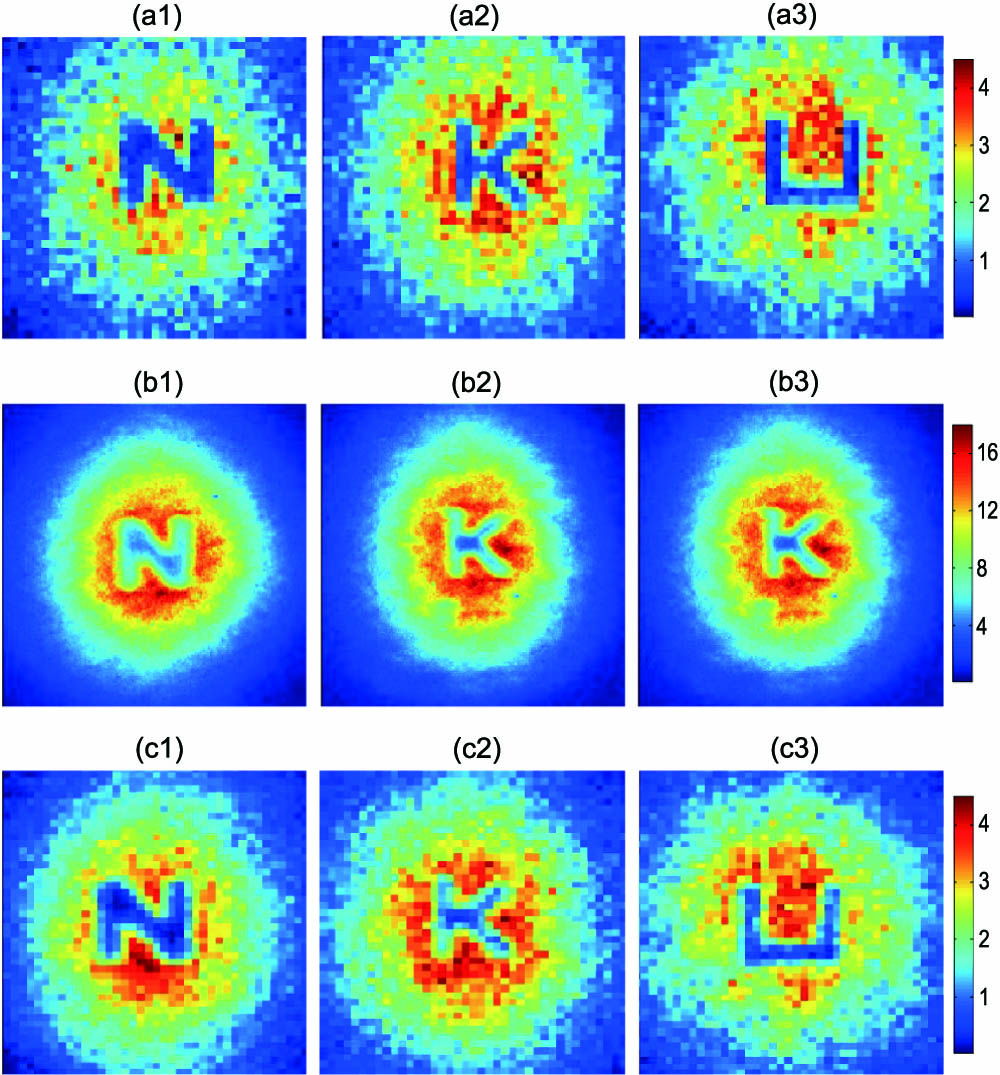
Fig. 3. (Color online) Experimental results. (a1), (a2), and (a3) are images of the three objects reconstructed by detecting photons at 650 nm with the same dimension of 40×40 scanning steps, and the measurement time is 5s for each step. (b1), (b2), and (b3) are images of the three objects by using the ICCD arrangement at 650 nm with a dimension of 200×200pixels corresponding to an area of 2.6×2.6mm2. (c1), (c2), and (c3) are images of the three objects reconstructed by detecting photons at 1064 nm with the same dimension of 40×40 scanning steps, and the measurement time is 5s for each step.

下载图片 查看所有图片

In conclusion, by using the time-resolved property of the fs pulsed laser, correlation imaging by detecting photons with variable wavelengths are realized. Two nonlinear crystals are used to convert the wavelength of the photons. In our experiment, three objects (letters, “N”, “K”, and “U”) can be recorded at the same time. It should be noted that the wavelength of the photons illuminating the objects is different from that detected by the detectors during imaging, and the wavelength of the photons detected by the detectors can also be changed to match the sensitive range of the used detectors. In our current experiment, images of the objects are reconstructed clearly by detecting the photons at wavelengths of 650, 810, and 1064 nm, respectively. What is more, two schemes are used to achieve the multiple imaging. In the first scheme shown in Fig. 1(a), a single-photon detector D2 is used to perform the coincidence measurement with detector D1, three coincidence-count peaks carrying the information of three objects are obtained. By scanning the detector step by step, the images of three objects are reconstructed. In the second scheme shown Fig. 1(b), an ICCD, which replaces D2 with no spatial resolution in the first scheme, is used, and scanning is no longer needed due to the function of spatial resolution. As long as we set the appropriate delay time, the three images can be obtained one by one. We also investigate the imaging by detecting photons with different wavelengths, and obtain almost the same images. So we can flexibly choose the photon wavelength depending on the sensitive range of the detectors used. Further, our work also proves that information carried by the pump light can survive and be transferred to the light generated from the SPDC process[36].

References

[1] PittmanT. B.ShihY. H.StrekalovD. V.SergienkoA. V., Phys. Rev. A52, R3429 (1995).

[2] BenninkR. S.BentleyS. J.BoydR. W., Phys. Rev. Lett.89, 113601 (2002).PRLTAO0031-9007

[3] GattiA.BrambillaE.BacheM.LugiatoL. A., Phys. Rev. A70, 013802 (2004).

[4] GattiA.BrambillaE.BacheM.LugiatoL. A., Phys. Rev. Lett.93, 093602 (2004).PRLTAO0031-9007

[5] ValenciaA.ScarcelliG.D’AngeloM.ShihY. H., Phys. Rev. Lett.94, 063601 (2005).PRLTAO0031-9007

[6] ZhangD.ZhaiY. H.WuL. A.ChenX. H., Opt. Lett.30, 2354 (2005).OPLEDP0146-9592

[7] KongL. J.LiY. N.QianS. X.LiS. M.TuC. H.WangH. T., Phys. Rev. A88, 013852 (2013).

[8] ScarcelliG.BerardiV.ShihY. H., Phys. Rev. Lett.96, 063602 (2006).PRLTAO0031-9007

[9] BasanoL.OttonelloP., Appl. Phys. Lett.89, 091109 (2006).APPLAB0003-6951

[10] ScarcelliG.BerardiV.ShihY. H., Appl. Phys. Lett.88, 061106 (2006).APPLAB0003-6951

[11] MeyersR.DeaconK. S.ShihY. H., Phys. Rev. A77, 041801 (2008).

[12] FerriF.MagattiD.SalaV. G.GattiA., Appl. Phys. Lett.92, 261109 (2008).APPLAB0003-6951

[13] ZhouY.SimonJ.LiuJ.ShihY. H., Phys. Rev. A81, 043831 (2010).

[14] YaoX.LiuX.YuW.ZhaiG., Chin. Opt. Lett.13, 010301 (2015).CJOEE31671-7694

[15] XuX.LiE.ShenX.HanS., Chin. Opt. Lett.13, 071101 (2015).CJOEE31671-7694

[16] SunM.HeX.LiM.WuL., Chin. Opt. Lett.14, 040301 (2016).CJOEE31671-7694

[17] LiQ.DuanZ.LinH.GaoS.SunS.LiuW., Chin. Opt. Lett.14, 111103 (2016).CJOEE31671-7694

[18] YangC.WangC.GuanJ.ZhangC.GuoS.GongW.GaoF., Photon. Res.4, 281 (2016).

[19] ChanK. W. C., Opt. Lett.37, 2739 (2012).OPLEDP0146-9592

[20] DuJ.GongW.HanS., Opt. Lett.37, 1067 (2012).OPLEDP0146-9592

[21] MeyersR. E.DeaconK. S.ShihY., Appl. Phys. Lett.100, 131114 (2012).APPLAB0003-6951

[22] MeyersR. E.DeaconK. S.ShihY., Appl. Phys. Lett.98, 111115 (2011).APPLAB0003-6951

[23] XueY. L.WanR. G.FengF.ZhangT. Y., Appl. Opt.53, 3035 (2014).APOPAI0003-6935

[24] LiD.LiX.QinY.ChengY., IEEE Trans. Geosci. Remote Sens.52, 2261 (2014).IGRSD20196-2892

[25] LemosG. B.BorishV.ColeG. D.RamelowS.LapkiewiczR.ZeilingerA., Nature512, 409 (2014).

[26] LahiriM.LapkiewiczR.LemosG. B.ZeilingerA., Phys. Rev. A92, 013832 (2015).

[27] HongC. K.MandelL., Phys. Rev. A31, 2409 (1985).

[28] ZouX. Y.WangL. J.MandelL., Phys. Rev. Lett.67, 318 (1991).PRLTAO0031-9007

[29] WangL. J.ZouX. Y.MandelL., Phys. Rev. A44, 4614 (1991).

[30] WangL. J.ZouX. Y.MandelL., J. Opt. Soc. Am. B8, 978 (1991).JOBPDE0740-3224

[31] WisemanH. M.MølmerK., Phys. Lett. A270, 245 (2000).PYLAAG0375-9601

[32] BrendelJ.MohlerE.MartienssenW., Phys. Rev. Lett.66, 1142 (1991).PRLTAO0031-9007

[33] TascaD. S.AspdenR. S.MorrisP. A.AndersonG.BoydR. W.PadgettM. J., Opt. Express21, 30460 (2013).OPEXFF1094-4087

[34] MorrisP. A.AspdenR. S.BellJ. E. C.BoydR. W.PadgettM. J., Nat. Commun.6, 5913 (2014).NCAOBW2041-1723

[35] KwonO.ChoY. W.KimY. H., Phys. Rev. A78, 053825 (2008).

[36] MonkenC. H.RibeiroP. H. S.PáduaS., Phys. Rev. A57, 3123 (1998).

Lingjun Kong, Rui Liu, Yu Si, Zhouxiang Wang, Chenghou Tu, Yongnan Li, Huitian Wang. Time-resolved multiple imaging by detecting photons with changeable wavelengths[J]. Chinese Optics Letters, 2017, 15(8): 081101.


本文已被 1 篇论文引用
被引统计数据来源于中国光学期刊网
引用该论文: TXT   |   EndNote

相关论文

加载中...

关于本站 Cookie 的使用提示

中国光学期刊网使用基于 cookie 的技术来更好地为您提供各项服务,点击此处了解我们的隐私策略。 如您需继续使用本网站,请您授权我们使用本地 cookie 来保存部分信息。
全站搜索
您最值得信赖的光电行业旗舰网络服务平台!