Chinese Optics Letters, 2017, 15 (12): 121602, Published Online: Jul. 18, 2018
Synthesis and photoluminescence properties of Sr4La(PO4)3O:RE3+(RE=Eu/Tb/Ce) phosphors
Figures & Tables
Fig. 1. XRD patterns of (a) SLPO : x Eu 3 + x = 0 – 0.17 SLPO : x Tb 3 + x = 0 – 0.17 SLPO : x Ce 3 + x = 0 – 0.17
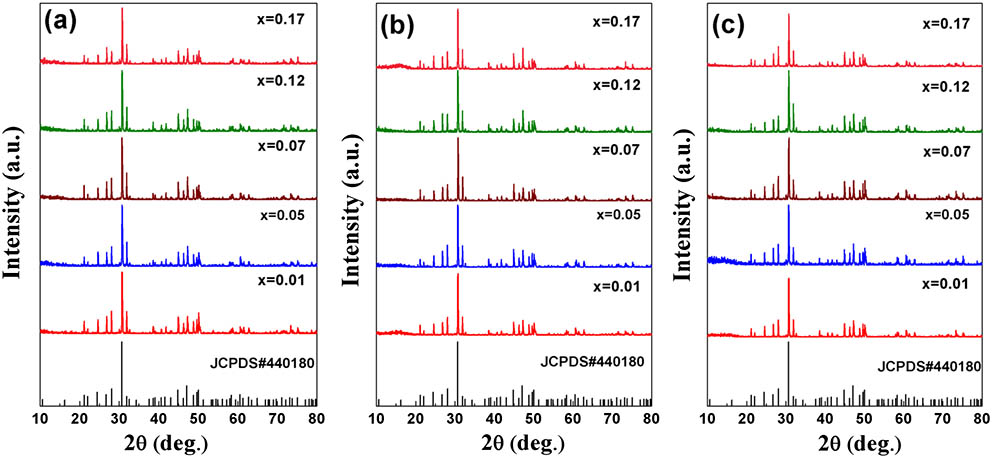
Fig. 2. (Color online) PLE (λ em = 611 nm λ ex = 394 nm SLPO : 0.05 Eu 3 +

Fig. 3. (Color online) (a) Emission spectra of SLPO : x Eu 3 + x = 0.01 x Eu 3 + I / x Eu 3 + SLPO : x Eu 3 + Eu 3 +

Fig. 4. (Color online) PLE (λ em = 539 nm λ ex = 379 nm SLPO : 0.07 Tb 3 +

Fig. 5. (Color online) (a) Emission spectra of SLPO : x Tb 3 + x = 0.01 x Tb 3 + I / x Tb 3 + SLPO : x Tb 3 + Tb 3 +

Fig. 6. (Color online) (a) PLE (λ em = 482 nm λ ex = 337 nm SLPO : 0.12 Ce 3 + λ ex = 337 nm SLPO : x Ce 3 + x = 0.01 x Ce 3 + x ≤ 0.17) as function of Ce 3 + Ce 3 + SLPO : x Ce 3 +

Fig. 7. (Color online) Normalized (a) PL and (b) PLE spectra of SLPO : 0.01 Ce 3 +

Fig. 8. (Color online) PL spectra of (a) SLPO : 0.05 Eu 3 + λ ex = 394 nm SLPO : 0.07 Tb 3 + λ ex = 379 nm SLPO : 0.12 Ce 3 + λ ex = 337 nm SLPO : 0.12 Ce 3 +

Fig. 9. SEM images of (a) SLPO : 0.05 Eu 3 + SLPO : 0.07 Tb 3 + SLPO : 0.12 Ce 3 +

Fig. 10. CIE chromaticity diagram for SLPO : 0.05 Eu 3 + SLPO : 0.07 Tb 3 + SLPO : 0.12 Ce 3 + SLPO : 0.05 Eu 3 + SLPO : 0.07 Tb 3 + SLPO : 0.12 Ce 3 +

Table1. CIE Coordinates, Peak Emission Wavelength of PL Spectra for Eu3+, Tb3+, and Ce3+-Doped SLPO Samples
|
Ju Cheng, Jia Zhang, Hongchao Zhang, Sardar Maryam, Xintian Bian, Zhonghua Shen, Xiaowu Ni, Jian Lu. Synthesis and photoluminescence properties of Sr4La(PO4)3O:RE3+(RE=Eu/Tb/Ce) phosphors[J]. Chinese Optics Letters, 2017, 15(12): 121602.


 PDF全文
PDF全文

