卫星和地基遥感观测资料约束下的核-壳态气溶胶光学特性模拟研究
Light-absorbing aerosols have a huge impact on visibility. The atmospheric pollution they cause can pose serious risks to human health. Quantitatively assessing the optical properties and spatiotemporal distribution of light-absorbing aerosols is of vital importance for decision-making in the management and control of complex air pollution. The dynamic changes in the physicochemical properties of light-absorbing aerosols, along with their temporal and spatial heterogeneity, introduce significant uncertainties in simulating their radiative forcing. The challenges arise from difficulties in accurately estimating particle size distribution, chemical composition, and mixed state, impeding precise retrievals through satellite remote sensing, with common model simulations and radiative transfer equations assuming the presence of external mixing for light-absorbing aerosols. However, research indicates that, especially in regions prone to pollution events like East Asia, South Asia, and Southeast Asia, a "core-shell" mixed state, with black carbon as the core and scattering aerosols like sulfates and nitrates as the shell, best represents the prevailing state of light-absorbing aerosols. Rough assumptions about aerosol states not only introduce significant errors in simulating aerosol number and mass concentrations in the atmosphere but also lead to substantial uncertainties in estimating overall radiative forcing.
Data from both satellite and in situ measurements are employed in the present study. First, we employ the AERONET aerosol optical depth (AOD) dataset to identify polluted days at three selected sites, and we match it in space and time with the single scattering albedo (SSA) dataset combined with the TROPOMI ultraviolet (UV) SSA dataset. Second, we utilize the Mie optical model across various combinations of core and shell sizes to establish a preliminary SSA map. Subsequently, we use SSA data from six different wavebands to constrain the SSA output from the Mie model. All calculations are conducted at a daily and grid-level resolution. Upon obtaining probability distributions for core size, shell size, and their corresponding SSA and absorption coefficient (ABS) values, we then apply spatial relationships between the column total absorbing aerosol optical depth (AAOD) from TROPOMI, single-particle absorption, and size distribution. This allows us to assess the column value of black carbon mass concentration and particle number concentration.
Spatial distribution of the mean absorption coefficient obtained from the Mie model simulations during periods of severe pollution shows that the absorption coefficient of the Beijing station is generally higher, with values mainly concentrated between 0.05 and 0.07. This indicates a higher presence of light-absorbing aerosols during this period. For the Hong Kong station, most of the absorption coefficients are below 0.1, with the majority falling below 0.2 and a low standard deviation of less than 0.02. Factors related to topography and wind patterns are the primary reasons for the lower values observed in the Hong Kong station (Fig. 3). After applying spatial relationships between the column total AAOD from TROPOMI, the results show that the particle concentrations in the column at the Beijing station generally fall within the range of 3×10¹⁹-5×10¹⁹ grid-1. The number concentrations in Hong Kong are relatively lower than those in Beijing. Except for a few grid points where concentrations reach 2.5×10¹⁹ grid-1, the overall value range in Hong Kong between 1×10¹⁹ and 2×10¹⁹ grid-1. For the Seoul station, particle concentration range is from 1.5×10¹⁹ to 3.0×10¹⁹ grid-1 (Fig. 4). By considering the particle size distribution of black carbon aerosols under the "core-shell" mixed state simulated by the Mie model, the results of the spatial distribution of black carbon aerosol column mass concentration at each grid point (Fig. 6) shows that over 60% of the area of Beijing have concentrations exceeding 500 kg/grid. In the Hong Kong area, apart from certain regions within the Pearl River Delta urban cluster where black carbon column mass exceeds 500 kg/grid, the values in other areas are below 300 kg/grid. In addition, Seoul has an overall column mass concentration of less than 300 kg/grid.
Present study utilizes constrained particle size information and absorption coefficients to calculate the spatial distribution of atmospheric column mass concentration of light-absorbing aerosols and black carbon at various stations. It presents a novel method for simulating the optical parameters of light-absorbing aerosols and the spatial distribution of black carbon aerosol column mass concentration. The simulated black carbon mass concentration results have a good correlation with the Karman Filter emission inventory, with the estimated black carbon lifetime ranging from one to four days, which accords with the existence state of black carbon in the real atmosphere. The calculation results of black carbon mass concentration based on the Mie model proposed in this study are great and have certain application potential in the future. By comparing the model-constrained particle size distribution and absorption coefficient results before and after incorporating TROPOMI UV satellite observational data, it is demonstrated that by incorporating UV wavelength observational data as constraints, compared with results without UV constraints, the outcomes not only encompass the scattering effect of smaller-sized particles on the atmosphere but also calculate the total column mass concentration of aerosols across a broader particle size spectrum. Additionally, this approach covers a wider range of information on the spatial distribution of black carbon mass concentration.
1 引言
消光性气溶胶能够影响能见度,其导致的大气污染,如,1952年伦敦烟雾事件、洛杉矶光化学烟雾事件以及我国改革开放后常发生的大规模重度空气污染事件等,会对人体健康造成严重危害[1-3]。除此之外,消光性气溶胶可通过直接和间接辐射效应影响气候[4-5]。因此,定量评估消光性气溶胶的光学特性及时空分布对复合型大气污染防治和治理决策制定来说有重要意义。
由于消光性气溶胶物理化学特性的动态变化以及时间与空间上的不均匀分布,对其辐射强迫的模拟存在很大不确定性[6-7]。而黑碳气溶胶作为最重要的消光性气溶胶,其在大气中发生的一系列物理[8-9]与化学过程[10-11]使其在全球范围内的时空分布差异性显著[12-14],难以准确定量估算其粒径分布、化学组分与混合形态,给卫星遥感的精确反演带来了较大困难[15]。其中部分原因在于:现今主流的大气模型或遥感观测原始数据处理算法将气溶胶的粒径分布特征分为粗模态与细模态,且粒径的分布遵循单峰对数正态分布,与实际情况存在一定差异[16-17]。除此之外,普遍的模式模拟和辐射传输方程均假设消光性气溶胶以外混态形式存在[18-19],而研究表明,特别是在污染事件发生频繁的地区(东亚、南亚及东南亚等),以黑碳为核心,硫酸盐、硝酸盐等散射性气溶胶为涂层的“核-壳”混合态最能代表消光性气溶胶的存在状态[20-21]。对气溶胶存在状态的粗略假设不仅会令大气中气溶胶数密度与质量浓度的模拟结果存在很大误差,还会给整体辐射强迫的估计带来较大不确定性。
因此,准确量化大气中消光性气溶胶的光学特性及黑碳气溶胶柱总信息有助于分析大气中的污染物来源,掌握气溶胶成分及区域污染特征。本研究基于“核-壳”假设(黑碳为“核”,硫酸盐或硝酸盐为“壳”)下的米散射模型,结合多波段(340、388、440、675、870、1020 nm)地基和卫星遥感观测数据对消光性气溶胶的光学特性进行模拟和约束,准确量化了黑碳气溶胶的空间分布特征,提出了一套精细化的黑碳气溶胶质量浓度空间分布格局模拟方案,为高精度本地化黑碳排放清单的制定及空气质量问题改善提供理论支撑。
2 研究区域与数据
2.1 研究区域
本研究主要集中于东亚的三个区域:1)京津冀区域。该区域消光性气溶胶的主要来源包括工业源、交通源和生物质燃烧源,同时区域输送也存在显著影响。2)珠三角区域。该区域普遍存在区域性大气复合污染。3)首尔。该区域消光性气溶胶来源以交通源为主,其次为工业、能源及生物质燃烧。以AERONET的三个站点北京、香港、首尔为中心,在其200 km范围区域内展开研究。
2.2 TROPOMI卫星数据
Sentinel-5P是欧洲航空局(ESA)于2017年10月13日发射的一颗全球大气污染监测卫星。卫星搭载有对流层观测仪(TROPOMI,http://www.tropomi.eu/),该观测仪在三大光谱内有7个通道:UV(ultraviolet)-1(光谱范围为270~330 nm,光谱分辨率为0.50 nm)、UV-2(光谱范围为300~320 nm,光谱分辨率为0.50 nm)、U-VIS(光谱范围为310~405 nm,光谱分辨率为0.55 nm)、VIS(visible,光谱范围为405~495 nm,光谱分辨率为0.55 nm)、NIR1(near infrared 1,光谱范围为675~725 nm,光谱分辨率为0.50 nm)、NIR2(光谱范围为725~775 nm,光谱分辨率为0.50 nm)以及SWIR(short-wave infrared,光谱范围为2305~2385 nm,光谱分辨率为0.25 nm)。TROPOMI包含三个不同级别的数据产品:Level-0为无时间重叠的原始卫星观测数据,主要用于大气校准测量,不向公众提供;Level-1B为地理定位和辐射校正的大气层顶部所有光谱波段的地球辐射以及太阳辐照度数据;Level-2包括地理定位的云和气溶胶信息(例如气溶胶光学厚度及单向粒子散射系数等),可以有效地观测全球各地大气中的痕量气体成分,加强对气溶胶和云的观测。
本研究采用2018年至2020年东亚地区紫外波段(340、388 nm)的TROPOMI Level-2吸收性气溶胶光学厚度(AAOD)及单向粒子反照率(SSA)数据集,空间分辨率为7.0 km × 3.5 km。由于黑碳气溶胶在紫外波段存在相比可见光与近红外波段更加显著的吸收作用,加入TROPOMI紫外波段观测数据可以在更广的波段范围内得到黑碳气溶胶更完善的模拟结果;且基于米散射的前提假设(颗粒物的粒径大小约等于入射光波长),联合TROPOMI紫外波段观测数据也可以有效拓宽所研究的粒子谱,使约束后的结果包含更小粒径颗粒物的信息。
为更好地体现数据的空间分布,利用双线性插值的方法将TROPOMI卫星数据重采样为0.05°×0.05°,并以AERONET站点为中心,在以200 km为半径的区域内对其进行裁剪。
2.3 AERONET地基数据
AERONET(AErosol Robotic NETwork,https://aeronet.gsfc.nasa.gov)全球观测网是由美国国家航空航天局(NASA)与LOA-PHOTONS(CNRS)联合建立的地基气溶胶遥感观测网。它将Cimel太阳自动光度计作为基本测量仪器,基于“朗伯-比尔定律”,使用在地面测得的直射太阳辐射在特定波长上对气溶胶光学厚度等光学参数进行计算。除此之外,AERONET还可提供结合不同主平面资料反演得到的在4个波长(440、675、870、1020 nm)上的AAOD、SSA等信息。AERONET可以提供全球分布的气溶胶光学厚度(AOD)反演产品。最新版本的数据产品具有三个质量水平:Level 1.0(未经过过滤云处理和验证的数据)、Level 1.5(经过过滤云处理和质量控制的数据)和Level 2.0(经过过滤云处理且经过验证的数据)。AERONET对于研究全球气溶胶的传输和辐射效应以及校验卫星遥感气溶胶结果来说均具有重要作用。
本研究使用AERONET Version 3中基于太阳直射与反演算法的Level 2.0数据产品,选取的数据集包括SSA、extinction AOD与absorption AOD(均为日均值)。为将其与卫星数据匹配,研究仅使用2018年后的数据结果。选取的站点信息、时间范围及筛选后的样本量如
表 1. 筛选后的站点信息
Table 1. Filtered site information
|
3 研究方法
3.1 米散射模型
本研究利用“核-壳”气溶胶结构下的米散射光学模型开展消光性气溶胶辐射参数计算。该模型基于米散射理论,将光波看作电子波,在一定的颗粒物形状和尺寸决定的边界条件下,对颗粒内部和外部区域的麦克斯韦方程求解,米散射理论即是在这种情况下对均匀介质球形颗粒计算其在单色平面波照射下远场的精确解。米散射理论在大气领域中对通过光散射测量颗粒大小(激光测粒仪)以及计算不同化学组分颗粒物的光学参数方面起着非常重要的作用。例如,在已知颗粒物化学组分及粒径大小的条件下计算颗粒物的散射系数、吸收系数、消光系数、非对称因子等。
对于半径为r,复折射指数为m的单个球形粒子来说,当被波长为λ的光照射时,米散射系数的计算公式为
式中:
其中,Jn与Yn为第一与第二阶贝塞尔函数。此时粒子的散射系数为
消光系数为
式中,Re(·)表示取实数。
在与气溶胶光学特性和粒径分布相关的数值模拟研究中,最广泛使用的理论是瑞利散射和米散射理论[22-23]。前者假设被测颗粒的粒径远远小于入射光波长(例如:可见光作用于臭氧分子或者无线电波作用于沙尘气溶胶);后者假设入射光波长约等于粒子粒径(而非远大于或远小于)。考虑到太阳辐射的能量主要集中在可见光到近红外波段,沙尘、雨滴、煤烟型气溶胶等颗粒物与太阳辐射的相互作用则遵循米散射模型下的米式解[24]。本研究利用基于“核-壳”假设的米散射模型,即假设粒子的形态是以黑碳气溶胶为核心,以硫酸盐或硝酸盐为壳的双层粒子结构[25],研究表明这最符合如东亚、南亚以及东南亚等地区污染严重时气溶胶的存在状态[20,26-27]。
3.2 星地观测时空匹配
TROPOMI可以提供过境时推扫区域的AAOD与SSA值,而AERONET可提供基于单个站点的连续观测数据。在一定的数据匹配与筛选条件下,联合TROPOMI卫星数据可将AERONET中SSA的观测结果在空间上进行拓展,实现区域内每个格点都存在6个波段的观测数据对模型结果进行约束的目标,进而得到逐格点的粒径分布与光学信息。为了保证卫星遥感数据与地基观测数据在研究区域的可比性,首先将站点实测数据与卫星数据进行精准的时空匹配:时间上,选择与TROPOMI过境时间一致的AERONET实测数据;空间上,借鉴TROPOMI官方验证数据时采用的方法(TROPOMI validation report of the Aerosol Optical Thickness product,https://data-portal.s5p-pal.com/product-docs/aot/s5p_aot_vr_v1.0.0_2022-02-10_signed.pdf),即,将以AERONET为中心,半径为200 km范围内,经过一定质量筛选后的TROPOMI卫星观测与AERONET地基观测数据以格点为单位联合使用。
然后,对三个区域内的TROPOMI与AERONET数据进行筛选与质量匹配,具体匹配原则如下:TROPOMI的SSA数据需要满足条件
其中,AERONET的SSA观测数据的误差范围为-0.03~+0.03[28],同时假设波段差异(388 nm与440 nm)导致的观测差异为0.01。当数据满足
3.3 观测约束的模式模拟方法
选取50~500 nm(每10 nm为一个步长)为“核”的粒径范围,50~800 nm(每10 nm为一个步长)为“壳”的粒径范围,在逐个粒径组合下开展米散射模型的模式模拟,得到三个站点的逐日光学参数分布图(未约束,如
气溶胶柱内的颗粒物数量的计算公式表示为
式中:Ncol为气溶胶柱内粒子数密度;σabs为单个粒子吸收系数;AAAOD,TROPOMI为来自TROPOMI的AAOD数据。气溶胶柱内粒子质量的计算公式表示为
式中:M为单个黑碳颗粒的质量;Mcol为气溶胶柱内粒子总质量。首先结合
3.4 一阶箱模型(first-order box model)
箱模型是一种基本的大气扩散模型,可用于计算某种大气污染物的地面质量浓度。箱模型的基本假设为:排放到大气中的污染物在“箱体”中与空气均匀混合,且产生的物质化学性质稳定。其基本公式表示为
式中:C为整个箱体内的污染物质量浓度,单位为g/m3;Cin为进入箱体的污染物质量浓度,单位为g/m3;Q为单位面积污染源的污染物排放率,单位为g/m2·s-1;V为箱子体积,单位为m3;A为水平面积(L×W),单位为m2;t为时间,单位为s;W为箱体宽度,单位为m;L为箱体长度,单位为m;H为箱体高度,单位为m;U为水平风速,单位为m/s;u为风速,单位为m/s。
故在单位箱体内(A=1、L=1、W=1、H=1),假设水平风速为0,简化后的一阶箱模型公式为
式中:M为质量浓度;
式中:
4 结果与讨论
4.1 基于AERONET AOD的极端污染事件识别
为了将污染天数与洁净天数分开,利用方差最大化方法对AERONET的AOD日均值数据产品进行划分。具体实施方式为:定义大于平均值加一倍标准差的数据为当次计算的峰值,将峰值通过该种方法再次进行计算,并重复迭代三次。三次迭代后的结果如

图 2. AERONET AOD的时间序列及分类结果。(a)北京;(b)香港;(c)首尔
Fig. 2. Time series and classification results of AERONET AOD. (a)Beijing; (b)Hong Kong; (c)Seoul
4.2 米散射模拟结果
基于站点污染严重天数的分类结果(

图 3. 米散射模型反演得到的吸收系数(σabs)均值空间分布。(a)北京;(b)香港;(c)首尔
Fig. 3. Spatial distributions of the mean of absorption coefficient σabs from Mie model. (a) Beijing; (b)Hong Kong; (c) Seoul
4.3 消光性气溶胶柱内数量空间分布
利用上述计算得到的消光性气溶胶吸收系数,结合TROPOMI AAOD紫外波段数据集,基于

图 4. 气溶胶柱内颗粒物数量空间分布。(a)北京;(b)香港;(c)首尔
Fig. 4. Spatial distributions of particulate matter quantity in aerosol column. (a) Beijing; (b) Hong Kong; (c) Seoul
4.4 黑碳气溶胶柱内质量空间分布模拟结果验证与分析
结合Cohen等[26](2014)提出的卡尔曼滤波(KF)黑碳排放清单和简化后的一阶箱模型公式间接验证计算得到的黑碳气溶胶柱内质量空间分布结果的可靠性。

图 5. 黑碳气溶胶(BC)柱内质量与排放清单分布柱状图。(a)北京;(b)香港;(c)首尔
Fig. 5. Distributions of column mass and emission inventory of black carbon (BC). (a) Beijing; (b) Hong Kong; (c) Seoul
得到三个站点的气溶胶柱内颗粒物数量空间分布后,结合米散射模型模式模拟得到的“核-壳”混合态下黑碳气溶胶的粒径分布(
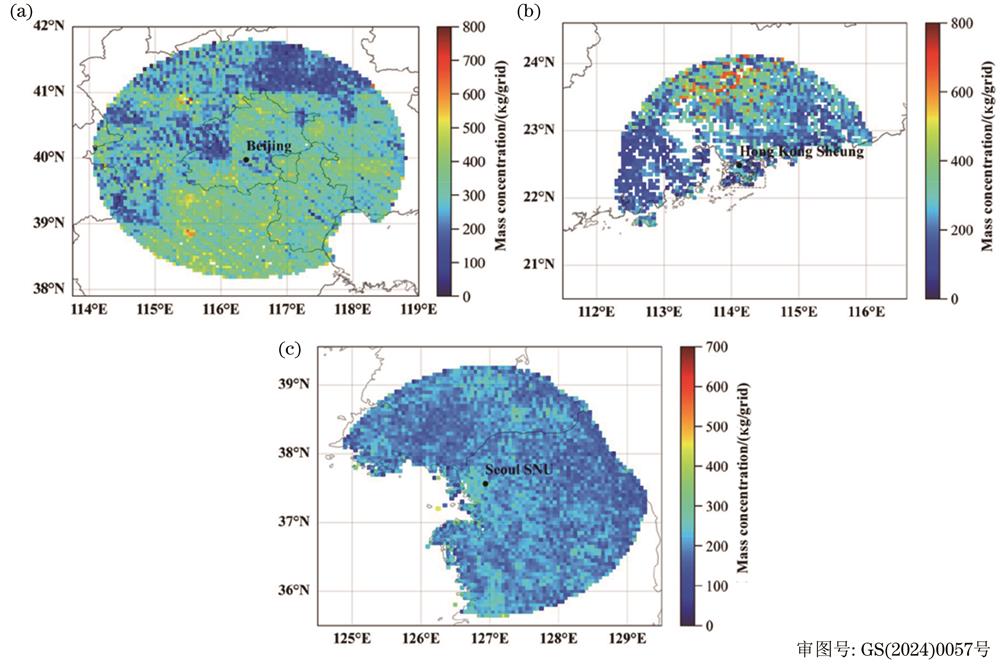
图 6. 黑碳气溶胶柱内质量浓度空间分布。(a)北京;(b)香港;(c)首尔
Fig. 6. Spatial distributions of column mass concentration of black carbon. (a) Beijing; (b) Hong Kong; (c) Seoul
为体现TROPOMI紫外波段数据对模拟结果的增强作用,对比仅利用AERONET观测数据、联合AERONET与TROPOMI紫外波段数据两种情况下的模型约束结果。图
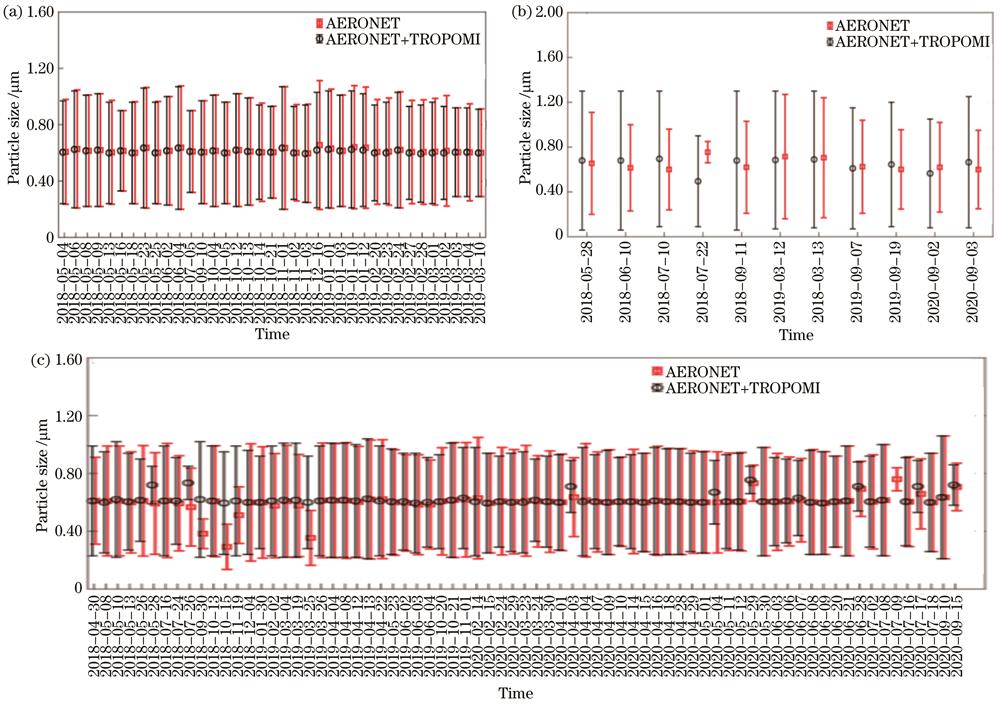
图 7. 联合TROPOMI紫外波段数据与仅用AERONET观测数据对米散射模型结果进行约束的气溶胶粒径时间分布对比。(a)北京;(b)香港;(c)首尔
Fig. 7. Comparison of aerosol particle size distributions between combined TROPOMI UV observation data and only AERONET observation data to constrain the results of the Mie model. (a) Beijing; (b) Hong Kong; (c) Seoul
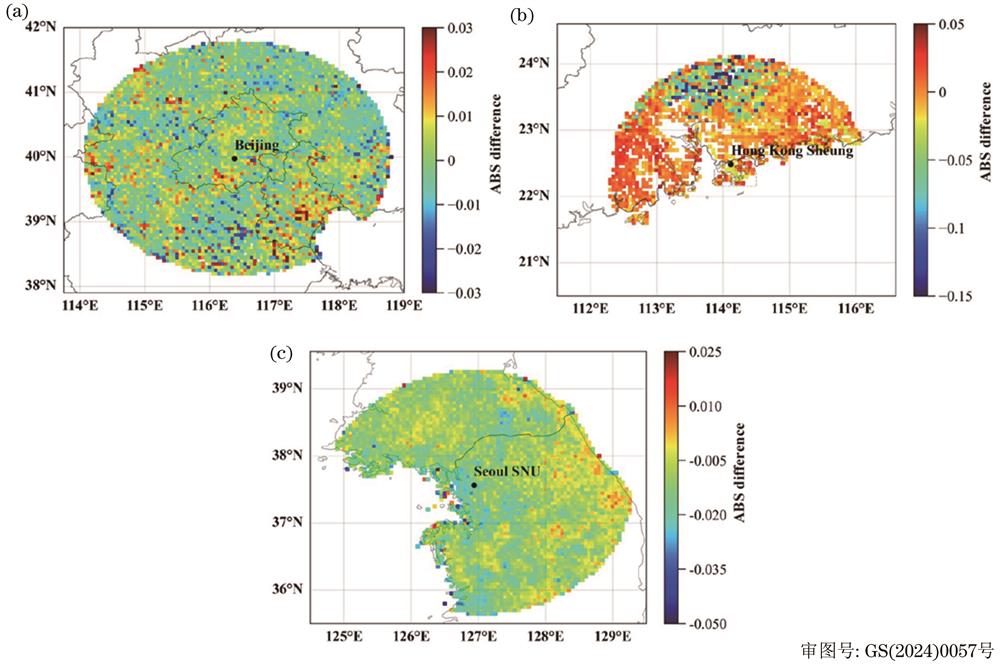
图 8. 联合TROPOMI紫外波段数据与仅用AERONET 4个波段观测数据对米散射模型结果进行约束的吸收系数(ABS)差值分布(正值代表加入TROPOMI观测数据约束后的ABS结果小于仅用AERONET观测数据约束的ABS结果。正值格点占比:北京93%、香港88%、首尔98%)。(a)北京;(b)香港;(c)首尔
Fig. 8. Difference distributions of absorption coefficient (ABS) between incorporated TROPOMI UV observation data and AERONET observation data only to constrain the results of Mie model (Positive value indicates that the ABS results constrained by incorporated TROPOMI observation data are smaller than those constrained by AERONET observation data only. Percentage of positive grid points: Beijing 93%, Hong Kong 88%, Seoul 98%). (a) Beijing; (b) Hong Kong; (c) Seoul
根据
5 结论
本文设计了一种全新的模拟消光性气溶胶光学参数及黑碳气溶胶质量空间分布的方法。将TROPOMI卫星观测数据与AERONET地基观测数据作为约束标准,选取北京、香港、首尔三个站点,首先运行米散射模型计算了三个站点上万个不同粒径组合下的散射系数及吸收系数,利用TROPOMI与AERONET的SSA观测数据对模型模拟结果进行约束;然后利用约束后的粒径信息与吸收系数计算各个站点消光性气溶胶的大气柱内数量空间分布与黑碳质量空间分布。
研究结果表明:1)联合TROPOMI卫星紫外观测数据有助于提升黑碳气溶胶质量浓度和柱内颗粒物数密度计算的精度,在一定条件下还可以将地基数据在空间上进行拓展。但是,紫外波段的卫星观测数据产品及其不确定性的相关研究仍不完善,如何克服卫星遥感估算中算法的局限性,实现黑碳气溶胶质量浓度的高精度模拟有待进一步研究。2)所提黑碳气溶胶质量浓度空间模拟方案具有较好的可靠性和应用前景,计算得到的黑碳气溶胶生命周期符合其在大气中的真实状态。但该方案在一定程度上仍然依赖于观测数据的准确性(已有相关研究提出AERONET SSA观测数据的不确定性范围,但尚缺少对TROPOMI紫外波段SSA观测数据不确定性范围的研究结果),在后续研究中,需要基于更多的观测资料对模型结果进行优化。3)所使用的“核-壳”假设在污染较严重天数中具有较好的代表性(本研究集中于东亚地区),但该混合态并不能无条件使用,例如,沙尘气溶胶这种以非球形为主的气溶胶便不再适用米散射的球形粒子假设(本研究已剔除)。未来可考虑更多不同气溶胶成分情况下的应用。
[1] Charlson R J. Atmospheric visibility related to aerosol mass concentration: review[J]. Environmental Science & Technology, 1969, 3(10): 913-918.
[2] Tiwari S, Payra S, Mohan M J, et al. Visibility degradation during foggy period due to anthropogenic urban aerosol at Delhi, India[J]. Atmospheric Pollution Research, 2011, 2(1): 116-120.
[3] Anderson E L, Turnham P, Griffin J R, et al. Consideration of the aerosol transmission for COVID-19 and public health[J]. Risk Analysis, 2020, 40(5): 902-907.
[4] Hansen J, Sato M, Ruedy R. Radiative forcing and climate response[J]. Journal of Geophysical Research: Atmospheres, 1997, 102(D6): 6831-6864.
[5] Sokolik I N, Toon O B. Direct radiative forcing by anthropogenic airborne mineral aerosols[J]. Nature, 1996, 381(6584): 681-683.
[6] Sun H, Pan Z T, Liu X D. Numerical simulation of spatial-temporal distribution of dust aerosol and its direct radiative effects on East Asian climate[J]. Journal of Geophysical Research: Atmospheres, 2012, 117(D13): D13206.
[7] Vester B P, Ebert M, Barnert E B, et al. Composition and mixing state of the urban background aerosol in the Rhein-Main area (Germany)[J]. Atmospheric Environment, 2007, 41(29): 6102-6115.
[8] Mann G W, Carslaw K S, Reddington C L, et al. Intercomparison and evaluation of global aerosol microphysical properties among AeroCom models of a range of complexity[J]. Atmospheric Chemistry and Physics, 2014, 14(9): 4679-4713.
[9] Spracklen D V, Pringle K J, Carslaw K S, et al. A global off-line model of size-resolved aerosol microphysics: I. Model development and prediction of aerosol properties[J]. Atmospheric Chemistry and Physics, 2005, 5(8): 2227-2252.
[10] Moise T, Flores J M, Rudich Y. Optical properties of secondary organic aerosols and their changes by chemical processes[J]. Chemical Reviews, 2015, 115(10): 4400-4439.
[11] Su T N, Li Z Q, Li C C, et al. The significant impact of aerosol vertical structure on lower atmosphere stability and its critical role in aerosol–planetary boundary layer (PBL) interactions[J]. Atmospheric Chemistry and Physics, 2020, 20(6): 3713-3724.
[12] Cohen J B, Prinn R G, Wang C E. The impact of detailed urban-scale processing on the composition, distribution, and radiative forcing of anthropogenic aerosols[J]. Geophysical Research Letters, 2011, 38(10): L10808.
[13] Kim D H, Sohn B J, Nakajima T, et al. Aerosol optical properties over East Asia determined from ground-based sky radiation measurements[J]. Journal of Geophysical Research: Atmospheres, 2004, 109(D2): D02209.
[14] Kim S W, Yoon S C, Kim J, et al. Seasonal and monthly variations of columnar aerosol optical properties over East Asia determined from multi-year MODIS, LIDAR, and AERONET Sun/sky radiometer measurements[J]. Atmospheric Environment, 2007, 41(8): 1634-1651.
[15] Kaufman Y J, Tanré D, Remer L A, et al. Operational remote sensing of tropospheric aerosol over land from EOS moderate resolution imaging spectroradiometer[J]. Journal of Geophysical Research: Atmospheres, 1997, 102(D14): 17051-17067.
[16] Yuan Y, Yi H L, Shuai Y, et al. Inverse problem for aerosol particle size distribution using SPSO associated with multi-lognormal distribution model[J]. Atmospheric Environment, 2011, 45(28): 4892-4897.
[17] Wu X A, Seigneur C, Bergstrom R W. Evaluation of a sectional representation of size distributions for calculating aerosol optical properties[J]. Journal of Geophysical Research: Atmospheres, 1996, 101(D14): 19277-19283.
[18] Koch D, Schulz M, Kinne S, et al. Evaluation of black carbon estimations in global aerosol models[J]. Atmospheric Chemistry and Physics, 2009, 9(22): 9001-9026.
[19] Bond T C, Doherty S J, Fahey D W, et al. Bounding the role of black carbon in the climate system: a scientific assessment[J]. Journal of Geophysical Research: Atmospheres, 2013, 118(11): 5380-5552.
[20] Wang S, Wang X Y, Cohen J B, et al. Inferring polluted Asian absorbing aerosol properties using decadal scale AERONET measurements and a MIE model[J]. Geophysical Research Letters, 2021, 48(20): L094300.
[21] Peng J F, Hu M, Guo S, et al. Markedly enhanced absorption and direct radiative forcing of black carbon under polluted urban environments[J]. Proceedings of the National Academy of Sciences of the United States of America, 2016, 113(16): 4266-4271.
[22] Dubovik O, Holben B N, Lapyonok T, et al. Non-spherical aerosol retrieval method employing light scattering by spheroids[J]. Geophysical Research Letters, 2002, 29(10): L014506.
[23] Harczuk I, Vahtras O, Ågren H. Modeling Rayleigh scattering of aerosol particles[J]. The Journal of Physical Chemistry B, 2016, 120(18): 4296-4301.
[24] 毛飞跃, 徐维维, 臧琳, 等. 地基Mie散射激光雷达反演的研究进展与挑战[J]. 光学学报, 2023, 43(18): 1899907.
[25] 毛前军, 杨开雁. 核壳结构粒子与群粒子光学散射特性研究[J]. 激光与光电子学进展, 2023, 60(21): 2129001.
Mao Q J, Yang K Y. Optical scattering properties of particle and group particles with core-shell structure[J]. Laser & Optoelectronics Progress, 2023, 60(21): 2129001.
[26] Cohen J B, Wang C. Estimating global black carbon emissions using a top-down Kalman Filter approach[J]. Journal of Geophysical Research: Atmospheres, 2014, 119(1): 307-323.
[27] Ueda S, Nakayama T, Taketani F, et al. Light absorption and morphological properties of soot-containing aerosols observed at an East Asian outflow site, Noto Peninsula, Japan[J]. Atmospheric Chemistry and Physics, 2016, 16(4): 2525-2541.
[28] Schafer J S, Eck T F, Holben B N, et al. Intercomparison of aerosol single-scattering albedo derived from AERONET surface radiometers and LARGE in situ aircraft profiles during the 2011 DRAGON-MD and DISCOVER-AQ experiments[J]. Journal of Geophysical Research: Atmospheres, 2014, 119(12): 7439-7452.
[29] Boiyo R, Kumar K R, Zhao T L, et al. A 10-year record of aerosol optical properties and radiative forcing over three environmentally distinct AERONET sites in Kenya, East Africa[J]. Journal of Geophysical Research: Atmospheres, 2019, 124(3): 1596-1617.
[30] 张西雅, 扈海波. 京津冀地区气溶胶时空分布及与城市化关系的研究[J]. 大气科学, 2017, 41(4): 797-810.
Zhang X Y, Hu H B. Spatio-temporal characteristics of aerosol optical depth and their relationship with urbanization over Beijing-Tianjin-Hebei region[J]. Chinese Journal of Atmospheric Sciences, 2017, 41(4): 797-810.
[31] 王海林, 刘琼, 陈勇航, 等. MODIS C006气溶胶光学厚度产品在京津冀典型环境背景下的适用性[J]. 环境科学, 2019, 40(1): 44-54.
Wang H L, Liu Q, Chen Y H, et al. Applicability of MODIS C006 aerosol products in a typical environmental area of the Beijing-Tianjin-Hebei region[J]. Environmental Science, 2019, 40(1): 44-54.
[32] 黄文声, 李真, 李权镐, 等. 香港及珠三角地区MODIS高分辨率气溶胶光学厚度的反演[J]. 环境科学学报, 2009, 29(7): 1372-1380.
Huang W S, Li Z, Li Q G, et al. Retrieval of aerosol optical thickness over Hong Kong and Pearl River Delta region using MODIS satellite data[J]. Acta Scientiae Circumstantiae, 2009, 29(7): 1372-1380.
[33] 贾臣, 孙林, 王永吉, 等. 京津冀地区1 km分辨率AOD产品精度验证及与大气污染的相关性分析[J]. 激光与光电子学进展, 2020, 57(23): 232802.
[34] 陈颢元, 王晓琦, 程水源, 等. 京津冀和长三角地区一次重霾过程气象成因及传输特征[J]. 中国环境科学, 2021, 41(6): 2481-2492.
Chen H Y, Wang X Q, Cheng S Y, et al. Analysis of meteorological causes and transmission characteristics of a heavy haze process in Beijing Tianjin Hebei and Yangtze River Delta[J]. China Environmental Science, 2021, 41(6): 2481-2492.
[35] 邵玄逸, 王晓琦, 钟嶷盛, 等. 京津冀典型城市冬季人为源减排与气象条件对PM2.5污染影响[J]. 环境科学, 2021, 42(9): 4095-4103.
Shao X Y, Wang X Q, Zhong Y S, et al. Impacts of anthropogenic emission reduction and meteorological conditions on PM2.5 pollution in typical cities of Beijing-Tianjin-Hebei in winter[J]. Environmental Science, 2021, 42(9): 4095-4103.
[36] 刘玉婷, 邬明权, 牛铮, 等. 2005—2018年北京市地基气溶胶光学厚度趋势分析[J]. 遥感信息, 2022, 37(4): 73-79.
Liu Y T, Wu M Q, Niu Z, et al. Trend analysis of ground-based aerosol optical thickness in Beijing from 2005 to 2018[J]. Remote Sensing Information, 2022, 37(4): 73-79.
[37] 刘晨曦, 何成, 何国文, 等. 冷高压影响下高层水平输送对珠海市三维臭氧浓度分布的影响分析[J]. 环境科学学报, 2023, 43(1): 119-127.
Liu C X, He C, He G W, et al. Analysis of the influence of high-level horizontal transportation on three-dimensional ozone concentration distribution in Zhuhai under the influence of cold and high pressure[J]. Acta Scientiae Circumstantiae, 2023, 43(1): 119-127.
[38] 周学思, 廖志恒, 王萌, 等. 2013—2016年珠海地区臭氧浓度特征及其与气象因素的关系[J]. 环境科学学报, 2019, 39(1): 143-153.
Zhou X S, Liao Z H, Wang M, et al. Characteristics of ozone concentration and its relationship with meteorological factors in Zhuhai during 2013-2016[J]. Acta Scientiae Circumstantiae, 2019, 39(1): 143-153.
[39] Li J, Wang Z F, Xiang W L. Daytime atmospheric oxidation capacity of urban Beijing under polluted conditions during the 2008 Beijing Olympic games and the impact of aerosols[J]. SOLA, 2011, 7: 73-76.
[40] Wu D, Mao J T, Deng X J, et al. Black carbon aerosols and their radiative properties in the Pearl River Delta region[J]. Science in China Series D: Earth Sciences, 2009, 52(8): 1152-1163.
[41] Samset B H, Myhre G, Herber A, et al. Modelled black carbon radiative forcing and atmospheric lifetime in AeroCom Phase II constrained by aircraft observations[J]. Atmospheric Chemistry and Physics, 2014, 14(22): 12465-12477.
[42] Wang L, Zhang F Y, Pilot E, et al. Taking action on air pollution control in the Beijing-Tianjin-Hebei (BTH) region: progress, challenges and opportunities[J]. International Journal of Environmental Research and Public Health, 2018, 15(2): 306.
[43] Liu J, Kiesewetter G, Klimont Z, et al. Mitigation pathways of air pollution from residential emissions in the Beijing-Tianjin-Hebei region in China[J]. Environment International, 2019, 125: 236-244.
[44] Wang Q Y, Huang R J, Cao J J, et al. Contribution of regional transport to the black carbon aerosol during winter haze period in Beijing[J]. Atmospheric Environment, 2016, 132: 11-18.
[45] Li J Y, Gao W K, Cao L M, et al. Effects of different stagnant meteorological conditions on aerosol chemistry and regional transport changes in Beijing, China[J]. Atmospheric Environment, 2021, 258: 118483.
[46] Zhang Z S, Engling G, Lin C Y, et al. Chemical speciation, transport and contribution of biomass burning smoke to ambient aerosol in Guangzhou, a mega city of China[J]. Atmospheric Environment, 2010, 44(26): 3187-3195.
[47] Cao J J, Lee S C, Ho K F, et al. Characteristics of carbonaceous aerosol in Pearl River Delta Region, China during 2001 winter period[J]. Atmospheric Environment, 2003, 37(11): 1451-1460.
[48] Duan J C, Tan J H, Cheng D X, et al. Sources and characteristics of carbonaceous aerosol in two largest cities in Pearl River Delta Region, China[J]. Atmospheric Environment, 2007, 41(14): 2895-2903.
[49] Park M H, Kim Y P, Kang C H, et al. Aerosol composition change between 1992 and 2002 at Gosan, Korea[J]. Journal of Geophysical Research: Atmospheres, 2004, 109(D19): D19-13.
Article Outline
王新莹, 秦凯, Cohen Jason, 王硕. 卫星和地基遥感观测资料约束下的核-壳态气溶胶光学特性模拟研究[J]. 光学学报, 2024, 44(6): 0628002. Xinying Wang, Kai Qin, Cohen Jason, Shuo Wang. Analysis of Core-Shell Mixed Aerosol Optical Properties Constrained by Satellite and Ground-Based Remote Sensing Observations[J]. Acta Optica Sinica, 2024, 44(6): 0628002.
