Chinese Optics Letters, 2021, 19 (8): 083001, Published Online: Jul. 19, 2021
VIPA-based two-component detection for a coherent population trapping experiment  Download: 754次
Figures & Tables
Fig. 1. Λ-type energy structure of the CPT experiment. (a) The simple three-level model. (b) The energy levels involved in the real experiment. The main transitions are the D1 transitions of 87Rb.
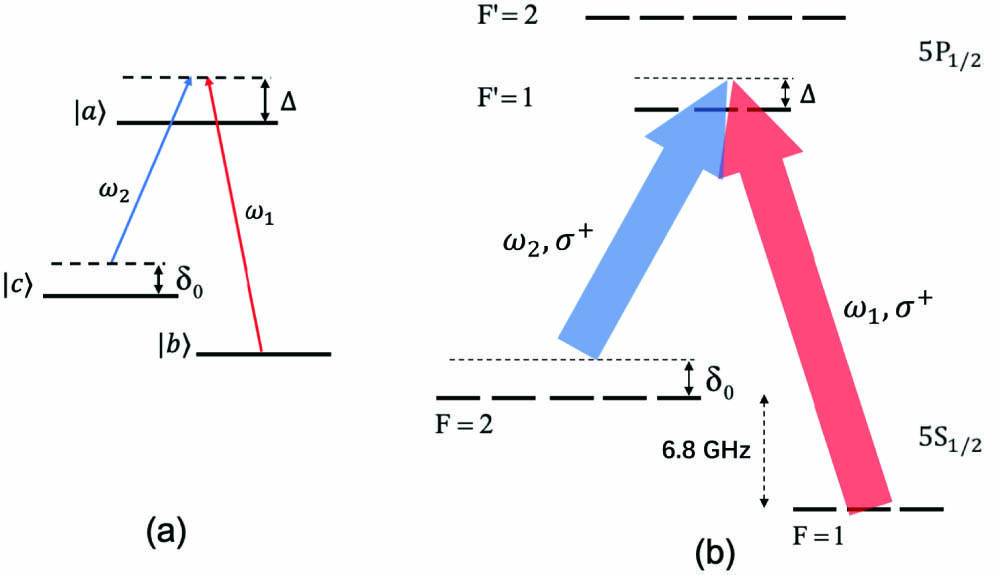
Fig. 2. Experimental setup. (a) The main part of the CPT experiment. In order to change the single-photon detuning, the laser double passes an AOM before entering the Rb buffer-gas cell. After the cell, the laser is coupled into a fiber. (b) The detection part of our experiment. Lights with different frequencies are spatially separated by a VIPA. The pictures show the spatial distribution of lights. Three detectors are set to measure I1, I2, and Itotal, respectively. PBS, polarization beam splitter; BS, beam splitter; PD, photodetector; DAVLL, dichroic atomic vapor laser lock; VCSEL, vertical cavity surface emitting laser; VIPA, virtually imaged phased array; AOM, acoustic-optical modulator.

Fig. 3. Numerical results with the simple three-level model. The simulation parameters are Γ/2π = 2000 MHz, γ1/2π = 1000 Hz, and γ2/2π = 5000 Hz. (a) Typical CPT signals for I1, I2, and Itotal when Δ/2π = −300 MHz, Ωab = 0.002Γ, Ωac = 0.001Γ. They are shifted vertically for a better visibility. (b)–(d) The center frequencies versus Δ when Ωab/Ωac equals (b) 1:1, (c) 1:1.5, and (d) 2:1. The results show that fave is insensitive against the change of Δ and Ωab/Ωac.

Fig. 4. Experimental data. (a) Typical CPT signals for I1, I2, and Itotal versus δ0 when Δ/2π = −190 MHz and Ωab/Ωac = 1:0.55. They are shifted vertically for better visibility. Both I1 and I2 show strong asymmetry, while Itotal is more symmetric. (b) The center frequencies versus Δ. Both f1 and f2 are very sensitive to Δ, but fave is insensitive to Δ. The slope of fave is smaller than that of ftotal.


Aihua Deng, Zixuan Zeng, Jianliao Deng. VIPA-based two-component detection for a coherent population trapping experiment[J]. Chinese Optics Letters, 2021, 19(8): 083001.


 PDF全文
PDF全文

