Chinese Optics Letters, 2019, 17 (3): 032601, Published Online: Mar. 8, 2019
Enhanced nonlinearity for filamentation in gold-nanoparticle-doped water  Download: 628次
Figures & Tables
Fig. 1. Schematic diagram of the experimental setup. The laser pulses were focused by a fused silica lens F1 (
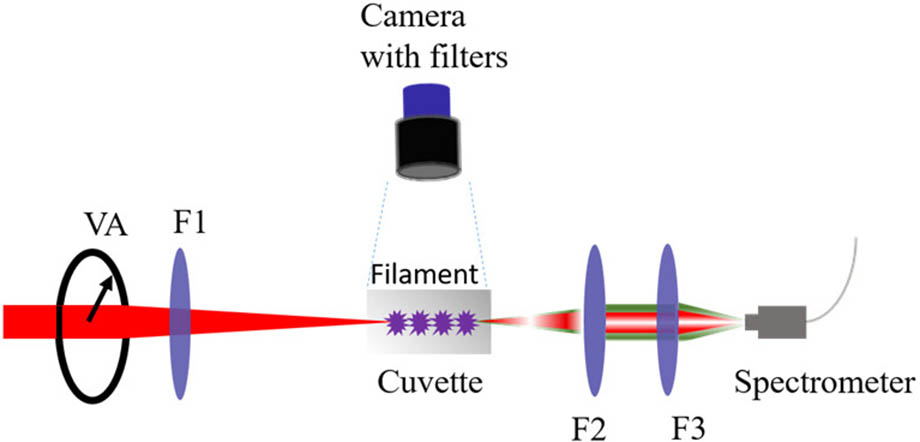
Fig. 2. Top views of light channel (top row) and the corresponding longitudinal white light intensity distribution in gold-nanoparticle-doped water (bottom row) with input pulse energy of (a), (b) 5.49 μJ and (c), (d) 9.86 μJ and in pure water with pulse energy of (e), (f) 9.72 μJ.

Fig. 3. Starting position of multifilaments as a function of 1 .

Fig. 4. Spectra obtained for the propagation of the laser pulse in gold-nanoparticle-doped water (green and dark yellow solid curves) as compared with those in pure water (pink and red solid curves) under (a) low and (b) high average input energy. The spectra are normalized to the intensity of the signal at 800 nm.

Table1. Measured Critical Power (Pcr) and Nonlinear Refractive Index (n2) in Gold-nanoparticle-doped Water and Pure Water Under Different Input Pulse Energy
|
Shuai Yuan, Lirong Wang, Fengjiang Liu, Fengquan Zhou, Min Li, Hui Xu, Yuan Nie, Junyi Nan, Heping Zeng. Enhanced nonlinearity for filamentation in gold-nanoparticle-doped water[J]. Chinese Optics Letters, 2019, 17(3): 032601.


 PDF全文
PDF全文

