Matter and Radiation at Extremes, 2020, 5 (4): 047201, Published Online: Nov. 25, 2020   

Experiments on the characteristics of underwater electrical wire explosions for reservoir stimulation

Author Affiliations
1 School of Physics, Beijing Institute of Technology, Beijing 100081, China
2 State Key Laboratory of Electrical Insulation and Power Equipment, Xi’an Jiaotong University, Xi’an 710049, China
3 Global Energy Interconnection Development and Cooperation Organization, Beijing 100031, China
4 Systems Engineering Research Institute, Beijing 100094, China
Abstract
Underwater shock waves generated by pulsed electrical discharges are an effective, economical, and environmentally friendly means of stimulating reservoirs, and this technology has received much attention and intensive research in the past few years. This paper reviews the main results of recent work on underwater electrical wire explosion (UEWE) for reservoir stimulation. A platform is developed for microsecond single-wire explosions in water, and diagnostics based on a voltage probe, current coil, pressure probe, photodiode, and spectrometer are used to characterize the UEWE process and accompanying shock waves. First, the UEWE characteristics under different discharge types are studied and general principles are clarified. Second, the shock-wave generation mechanism is investigated experimentally by interrupting the electrical energy injection into the wire at different stages of the wire-explosion process. It is found that the vaporization process is vital for the formation of shock waves, whereas the energy deposited after voltage collapse has only a limited effect. Furthermore, the relationships between the electrical-circuit and shock-wave parameters are investigated, and an empirical approach is developed for estimating the shock-wave parameters. Third, how the wire material and water state affect the wire-explosion process is studied. To adjust the shock-wave parameters, a promising method concerning energetic material load is proposed and tested. Finally, the fracturing effect of the pulsed-discharge shock waves is discussed, as briefly are some of the difficulties associated with UEWE-based reservoir stimulation.

1 I. INTRODUCTION

Electrical explosion of a metal wire driven by a pulsed current is a common method for generating (i) a plasma with relatively high temperature and density, (ii) pulsed electromagnetic radiation, and (iii) shock waves (SWs), and this method is used widely in the fields of Z-pinch plasma confinement, warm dense matter, nano-powder preparation, and reservoir stimulation, among others.1–5 For a wire exploded in a denser medium (e.g., air or water), the pulsed current passes through the metal wire and heats the load in a short period, resulting in fast phase transitions, non-ideal plasmas (coupling parameter Γ ≥ 1), optical emission, and strong SWs, among other outcomes.6–8 Specifically, in the case of underwater electrical wire explosion (UEWE), strong SWs (gigapascal level) can be found in the vicinity of the exploding wire.9,10 As the most obvious phenomenon accompanying UEWE, SWs via pulsed discharges are mentioned frequently in connection with shock compression, electrohydraulic forming, non-thermal food processing, and reservoir stimulation, among others.11–15

Naturally, different SW parameters are required for different applications. By changing the stored energy, circuit parameters, or wire load, SWs with different parameters can be obtained. For a specific circuit with fixed stored energy, in most cases there is an optimal mode with the largest energy deposition and strongest SW generation.16 For reservoir stimulation, the SW energy should be as large as possible, and a simple way of achieving that is to increase the wire size and stored energy. Although a nanosecond pulsed current can heat the wire to a higher pressure and temperature state,10 the diameter and length of the wire are limited by the skin effect and electrical insulation level of the system. Moreover, a nanosecond pulsed power source with large current output capability usually needs a pulse-compression stage. Thus, the total resistance of the loop is large, and it is quite difficult to explode thick wires with smaller resistance.69 Therefore, a microsecond pulsed current source could be an appropriate choice for meeting industrial demands for the generation of strong SWs, this being because of its simplicity (capacitor discharge) and high energy-deposition efficiency for thicker and longer wires.

Since 2010, with the aim of developing the technology of controllable SWs based on underwater pulsed discharge for reservoir stimulation (coalbed methane, shale gas, etc.), a series of investigations has been conducted at Xi’an Jiaotong University led by Professors Aici Qiu and Yongmin Zhang. To address the growing demands from practical engineering, three generations of repetitive SW sources have been proposed and put into practice in the past few years, with the maximum SW energy of a single shot reaching more than 8 kJ.17,18 Our first attempt involved using the electrohydraulic effect of a water gap. Later, to improve the strength and stability of the SWs, UEWE was adopted and successfully applied in several practical projects. However, the most obvious shortcoming of these two approaches is that the total SW energy has an upper limit of perhaps several hundred joules.19 In fact, a reservoir stratum under high static pressure (dozens of megapascals) requires hundreds of UEWE shots to create effective cracks. Although the pressure of the discharge channel (DC) surface can reach several gigapascals,10,20,21 which is comparable with the pressure of a detonation wave front,22 the attenuation of UEWE-generated SWs can be considerable given the insufficient subsequent energy deposition after the explosion. In other words, after the explosion, the load is either a high-resistance aerosol or conducting plasma, and thus the energy deposition is suppressed, thereby decreasing the DC expansion rate. For such circumstances, a third type of SW source was proposed, one in which an energetic material (EM) layer (covering the wire) is used to strengthen the SWs.19 For each of the three SW sources, the most essential and fundamental knowledge is that about the characteristics of the wire explosion, especially the estimation of SWs under different conditions, which is very important for both the UEWE and EM methods.19

In this review, we present the main results of our recent work on microsecond wire explosions for reservoir stimulation. We describe the technical details of an experimental setup that we established for researching microsecond wire explosions. On this platform, various wire loads have been exploded by different pulsed currents, and we have detected and analyzed the main processes, such as SWs and optical emission. We also summarize how the parameters of (i) the pulsed power source, (ii) the wire, and (iii) the medium influence the wire-explosion characteristics, and we present general principles and regulation methods for discharge type, energy deposition, SWs, and optical radiation. This review is intended to provide a better understanding of the characteristics of UEWE and to act as a reference for engineering aimed at producing underwater SWs in wells or oceans.

The rest of this is review is arranged as follows. In Sec. II, we introduce the platform that we have developed. In Sec. III, we discuss the characteristics of UEWE under different discharge types. In Sec. IV, we discuss the generation mechanisms and general characteristics of SWs in UEWE. In Sec. V, we provide information about exploding different metallic wires, and we analyze the influence of an ambient water medium. In Sec. VI, we introduce and discuss the method for enhancing or adjusting SWs based on pulsed discharges. In Sec. VII, we list briefly some cases involving the fracturing effect of SWs, and we discuss the advantages and difficulties of this technology in practical engineering. Finally, we conclude in Sec. VIII.

2 II. EXPERIMENTAL SETUP AND DIAGNOSTICS

2.1 A. Platform for exploding a wire under water

An experimental setup (Single Wire Explosion platform 2, abbreviated as SWE-2) designed for microsecond wire explosions was established at Xi’an Jiaotong University.23 It contains a sub-microsecond pulsed current source (source 1), two microsecond pulsed current sources (sources 2 and 3), a structure for placing loads, a stainless-steel chamber, and a diagnostic system. Schematics of SWE-2 in two circuit configurations are presented in Fig. 1.

Fig. 1. Schematics of structure of SWE-2 when connected to source (a) 1 and (b) 2 or 3. Reproduced with permission from Han et al., Rev. Sci. Instrum. 88, 103504 (2017). Copyright 2017 AIP Publishing LLC.

下载图片 查看所有图片

As shown in Fig. 1(a), source 1 comprises a two-stage Marx generator that can produce sub-microsecond pulses. When charged to 50 kV, this pulsed power source delivers to the wire load a pulsed current with an amplitude up to 25 kA with a rise time of ∼500 ns (dI/dt ≤ 50 A/ns). Regarding source 2, a 6-µF pulse capacitor connected to a coaxial triggered switch is used to provide a current pulse with an amplitude up to 70 kA and a rise time of ∼4 µs (dI/dt ≤ 20 A/ns), when charged to 30 kV. Similarly, for source 3, an 18-µF pulse capacitor is selected and the current pulse can reach 100 kA with a rise time of ∼7 µs (dI/dt ≤ 15 A/ns), when charged to 30 kV. Figure 2 shows the setup and diagnostic system. Most of the experiments are performed in this 40-mm-thick, 377 mm (d) × 400 mm (l) stainless-steel chamber, but a larger chamber with a 1200-mm-diameter is used when researching the propagation characteristics of SWs. Because the discharge is on a sub-microsecond or microsecond timescale, it is relatively easy to measure the discharge parameters. The voltage is measured directly with a North Star PVM-5 high-voltage probe (bandwidth of 80 MHz), and the current waveform is obtained with a 101 Pearson coil (bandwidth of 4 MHz). An optical fiber spectrometer (Avantes, 200 nm–1100 nm) is used to collect the emission spectrum. Also, silicon photodetectors (ET-2030) are used to evaluate the light intensity, reflecting the variation of radiation power during a UEWE. Regarding the underwater SWs, a Müller polyvinylidene fluoride (PVDF) needle probe or PCB138A11 probe is used to record their pressure waveforms.

Fig. 2. Schematics of SWE-2: (a) connection of pulsed power source and chamber; (b) arrangement of diagnostic and auxiliary systems. Reproduced with permission from Han et al., Rev. Sci. Instrum. 88, 103504 (2017). Copyright 2017 AIP Publishing LLC.

下载图片 查看所有图片

2.2 B. Methods for extracting related electrical, optical, and mechanical parameters

Some of the detected data must be processed before being analyzed. The voltage signal U obtained via the probe isU=RwI+d(LwI)dt+LsdIdt,where RW and LW are the resistance and inductance, respectively, of the wire load, Ls is the inductance of the reflux structure from the measuring point to the wire, and I is the circuit current. To analyze the energy deposition and resistance, the required resistive voltage drop UR is calculated asUR=RwI=Ud(LwI)dtLsdIdtULwdIdtLsdIdt.

For the optical emission spectroscopy, the nonlinear absorption effects are corrected as24Ireal(λ)=I(λ)obtk(λ)eα(λ)L,where Ireal is the real emission intensity from the DC–water boundary, Iobt is the intensity recorded by the calibrated spectrometer, k is the nonlinear absorption coefficient of the filters, α is the nonlinear absorption efficiency of water, and L is the path length for the light passing through the water.

For the SWs, the sharp front is difficult to detect, thereby causing distortion. Consequently, the pressure waveforms of the SWs must be reconstructed.25 Suppose that the pressure waveform of an SW is of the formprec={0,t<t0ppeake(tt0τ),t0t<t0+τ1e[1(τtp)1.5]ppeakτt[1(tt0tp)1.5],tt0+τ,where ppeak is the reconstructed peak pressure, τ is the decay time constant, and the time constant tp is 5τ in this study. Then, by applying frequency-domain analysis, the main SW can be reconstructed and presented more precisely.25

3 III. UEWE BEHAVIORS UNDER DIFFERENT DISCHARGE TYPE (MODE)

3.1 A. Concept of discharge type

Different combinations of wire and pulsed-current parameters result in different discharge types, namely distinct differences in phase transitions, optical emission, and SWs. In the 1950s, Chace and Moore26 proposed and observed five typical discharge types according to the features of the discharge current; later, people also observed different types (at least five) of UEWE via many experiments. The three most common types are illustrated in Fig. 3, where type A refers to a wire explosion with a current pause, while in types B and C the circuit current is in a periodic and aperiodic (overdamped) mode, respectively.

Fig. 3. Three representative discharge types of underwater electrical-wire explosion (UEWE) as represented by the current waveform.

下载图片 查看所有图片

The past two decades have seen great progress regarding the dynamics of exploding products, which helps understand the formation mechanisms of different discharge types. For example, Tkachenko et al.27–29 investigated insightfully the distribution of conducting and non-conducting matter in DCs formed by wire explosions in vacuum and air, and by using imaging diagnostics of high spatiotemporal resolution, they demonstrated the restrike process clearly.29 Shi et al. took laser shadow images of UEWEs with a current pause and saw multilayer weak shocks after the restrike,30 and Chung et al.31 used numerical means to simulate wire explosions under different discharge types. Although different combinations of pulsed-current and wire parameters result in different discharge types, the latter might be understood via a universal concept, namely the time sequence of current cut-off and breakdown. According to Wang,32 if the current pause is short enough (i.e., if the secondary breakdown (restrike) happens before the cut-off of the first current pause), then type A can evolve into type B. If the majority of the stored energy goes into vaporizing the wire, then breakdown may not happen, resulting in a single current pause, namely from type A to type C.

3.2 B. Characteristics of UEWE under three typical discharge types

Although the physics of discharge type is understood relatively clearly in the laboratory, most investigations concern particular phenomena for particular purposes. For instance, the type-A current pause separates vaporization and breakdown (ionization) and so is common in some physical research. Type B often appears when metal plasma is focused. Because the majority of the stored energy goes into vaporizing the wire, type C is used is phase-transition studies and to generate strong SWs, which is important for SW physics and the properties of warm dense matter.33 However, the existing data are non-intuitive for practical engineering, thereby necessitating a more systematic report on UEWE behavior under different discharge types. This section reports on the explosions of 4-cm-long Cu and W wires with diameters of 50 μm, 100 μm, 200 μm, and 300 µm to form UEWEs of types A, B, and C under a stored energy of 500 J. The related waveforms are shown in Fig. 4.

Fig. 4. Discharge parameters and light-intensity waveforms for UEWEs with four sizes of wire (labeled in the figures) under a stored energy of 500 J. Each row [(a) and (b), (c) and (d), (e) and (f), (g) and (h)] depicts the same discharge, but display different timescales of the x-coordinate. Reproduced with permission from Han et al., J. Appl. Phys. 122, 033302 (2017). Copyright 2017 AIP Publishing LLC.

下载图片 查看所有图片

Figure 4 shows that upon increasing d from 50 μm to 300 µm, the discharge type evolves from type A to B and then to C, and the light intensity (peak) decreases by two orders of magnitude. After the voltage peak, if breakdown happens then the current pause does not appear, as illustrated in Fig. 4(f). If not, then the explosion products keep expanding as an aerosol until a breakdown happens inside it, as seen in Figs. 4(a) or 4(c). The optical emission intensity differs evidently among these three discharge types. Specifically, for type A, strong optical emission starts from the restrike (secondary breakdown) and reaches its peak with increasing current. However, for type B from Figs. 4(c)–4(f), the optical emission obviously lags behind the discharge process, which is known as lagging radiation (late-time radiation).10,34 According to Grinenko et al.,10 the main factor for this phenomenon is the slower expansion of the DC in water.

The peak and duration of the optical-emission waveforms are illustrated and summarized in Fig. 5. For both Cu and W, the light-intensity peak decreases with increasing d. By contrast, the duration for Cu increases initially and then decreases, whereas for W it increases consistently. The reason for the above difference might be the expansion rate and plasma state of the DC, such as its opacity. For example, the density distribution may influence the radiation from inside the DC. Moreover, increasing the wire mass decreases the energy deposition in each atom during the plasma phase.

Fig. 5. (a) Peak and (b) duration for optical-emission process of Cu and W wire explosions with four sizes under a stored energy of 500 J. Reproduced with permission from Han et al., J. Appl. Phys. 122, 033302 (2017). Copyright 2017 AIP Publishing LLC.

下载图片 查看所有图片

For a deeper understanding of the above phenomenon, related time-integrated spectra of the above UEWEs are shown in Fig. 6. Associated with a wire explosion is a strong spectrum in the region of visible light. For each UEWE, there is an almost continuous spectrum from 350 nm to 950 nm. According to Fedotov et al.,35 the radiation from the DC is screened by the DC–water interface, leading to this black-body-like spectrum. Consequently, those spectra afford little information about the DC plasma.

Fig. 6. Time-integrated spectra for Cu wire explosions. Reproduced with permission from Han et al., J. Appl. Phys. 122, 033302 (2017). Copyright 2017 AIP Publishing LLC.

下载图片 查看所有图片

The temporal evolution of the emission spectra is understood using narrow bandpass filters and photodiodes whose wavelengths are 402 nm, 480 nm, 523 nm, 530 nm, and 637 nm. The light intensities for those five wavelengths are shown in Fig. 7. With increasing d, we have that (i) the peak value decreases and the emission process lasts for longer and (ii) stronger intensity is found for 637 nm, which corresponds to the tendency in Fig. 6. The latter phenomenon also indicates that the temperature of the DC–water interface is lower when the wire diameter is larger.

Fig. 7. Light intensity at five wavelengths in Cu wire explosion with d = (a) 50 µm, (b) 100 µm, and (c) 200 µm. Reproduced with permission from Han et al., J. Appl. Phys. 122, 033302 (2017). Copyright 2017 AIP Publishing LLC.

下载图片 查看所有图片

In terms of the resulting SWs, the three discharge types lead to distinctly different features. The pressure waveforms associated with the discharge waveforms are shown in Fig. 8. Type A gives rise to two SWs separated by the current pause. Without the current pause, only one main SW can be measured, as seen in types B and C. Note that the sensor unit of the Müller PVdF needle probe is not electromagnetically shielded, therefore the pressure signals may be coupled to high-frequency electromagnetic interference, as shown in Figs. 8(a) and 8(b).

Fig. 8. Pressure waveforms of types (a) and (b) A, (c) B, and (d) C. Reproduced with permission from Han et al., J. Appl. Phys. 122, 033302 (2017). Copyright 2017 AIP Publishing LLC.

下载图片 查看所有图片

Combing the results of discharge, optical emission, and SW parameters gives a rough picture of the UEWE discharge type, which is determined mainly by how the DC ionization develops. The breakdown process is accompanied by optical emission and further DC expansion. From type A to C, a larger amount of energy is used in the vaporization stage, thereby resulting in stronger SWs and weaker optical emission.

Different discharge types have different purposes. Type-A discharges tend to be used only to investigate the effects of two successive SWs in the laboratory. For practical UEWE engineering, type B is suitable for igniting EMs, and type C generates the strongest SW for a given stored energy. Although most of the stored energy goes into vaporizing the wire under type C, the stored energy should exceed the atomization enthalpy for the particular wire material to prevent pseudo-explosion36 due to overheating.6

4 IV. GENERATION PROCESS AND CHARACTERISTICS OF SHOCK WAVES

4.1 A. Brief review of shock-wave generation in UEWE

It is well known that the SW in a UEWE is produced by the fast expansion of the DC. In 2005, Grinenko et al.20 introduced a hydrodynamic piston model to describe the SWs produced by Cu wires exploding in water. A magnetohydrodynamics (MHD) simulation was then developed to describe UEWE behavior.10,37 That simulation method was used to study meticulously how the DC and DC–water interface evolve, including the variations of temperature, pressure, radiation, and instability, among others.10,38–40 Also, experiments with high-spatiotemporal-resolution diagnostics were conducted to reveal the details of the DC and SWs. Grinenko et al.10 and Fedotov et al.35 undertook systematic research on the plasma state and emission spectra of the DC, and Rososhek et al.33 made in-depth observations of the weak SWs related to phase transitions before the explosion. Recently, Yanuka et al.41,42 used synchrotron radiography to diagnose the DC structure and DC–SW interactions.

In general, how a UEWE generates SWs is clear in the laboratory, but the relationships between the electrical and SW parameters are yet to be established systematically. For practical engineering, estimating the SW parameters roughly based on the input parameters (stored energy, wire configuration, etc.) would be of great importance. In our previous work, we have sought to connect the input parameters and the output SW parameters, and the main results are as follows.

4.2 B. Experimental verification of generation mechanism

It is known that SWs are generated by the continuous expansion of the DC during a wire explosion. However, the contribution of the vaporization or ionization process to the formation of SWs is not clear. Therefore, an experiment was designed to verify the importance of vaporization for SWs.43 Two structures (as seen in Fig. 9) were designed for bypassing the wire load at different moments. The first structure has a water gap near the high-voltage electrode: when the voltage of the electrode reaches a certain level, the water gap breaks down and the wire is bypassed. The second structure has a bypass switch around the wire: when the load expands to a certain extent, the DC contacts the tab and shorts the lower half of the wire.

Fig. 9. Two types of energy-bypass device. Reproduced with permission from Han et al., Phys. Plasmas 24, 063511 (2017). Copyright 2017 AIP Publishing LLC.

下载图片 查看所有图片

To facilitate comparison with previous experiments, a metal Cu wire with a diameter of 200 µm and a length of 4 cm was selected, and the experiment was performed under a stored energy of 500 J. This metal wire was chosen because the type-B discharge involves all stages (from solid to plasma) of an electrical explosion. Given that the load voltage of a Cu-wire electrical explosion in its early stage increases monotonically with time, adjusting the gap distance of the water gap is a convenient way to achieve breakdown at different moments before the voltage peak. However, the high dielectric strength of water makes it difficult to achieve a breakdown in the plasma stage at low voltage. Therefore, using a bypass switch in conjunction with the water gap allows the wire load to be bypassed at different stages of the entire discharge process. The corresponding voltage and current waveforms are shown in Fig. 10. The waveforms labeled with an asterisk in the key indicate the shots with a bypass switch; otherwise, the water gap is used. The numbers represent either the water-gap distance or the diameter of the hole of the bypass switch.

Fig. 10. Typical (a) and (b) voltage and (c) and (d) current waveforms when water gap or bypass switch acts at different moments. Reproduced with permission from Han et al., Phys. Plasmas 24, 063511 (2017). Copyright 2017 AIP Publishing LLC.

下载图片 查看所有图片

The light-intensity waveforms from the above experiment are shown in Fig. 11. If the energy deposition is interrupted before the current peak time [Figs. 10(a) and 10(c)], then the signal received by the photodetector is very weak [Fig. 11(a)]. When the energy-deposition process is interrupted after the voltage peak [Figs. 10(b) and 10(d)], stronger optical radiation is detected [Fig. 11(b)]. It can be inferred that the ionization and plasma processes have a decisive effect on the light radiation generated by (i) the plasma during the discharge process and (ii) the high-temperature explosion products after the discharge process. If the explosion products are not ionized, then the light radiation is extremely weak.

Fig. 11. Typical light-intensity waveforms when water gap or bypass switch acts at different moments. Reproduced with permission from Han et al., Phys. Plasmas 24, 063511 (2017). Copyright 2017 AIP Publishing LLC.

下载图片 查看所有图片

The pressure waveforms of the SWs in the above experiment are shown in Fig. 12. If the energy injection is cut off during the liquification stage, then the generated SW is very weak; the pressure peak is only around 0.8 MPa and may indicate a pseudo-explosion,1 namely when the initial stored energy is insufficient to vaporize the wire. Metallic vapor remains after the wire has liquefied, forming coexisting gas and liquid droplets. This state produces weak volume expansion and a weak SW,20 which also increases the pressure peak of the detected SW to around 2.2 MPa. However, once the explosion happens, the peak SW pressure increases drastically from 2.2 MPa to 6.8 MPa from the gas–liquid coexisting state to the gas–liquid mixed phase, although the deposition energy increases from 36.7 to only 53.8 J. Nevertheless, as the gap distance increases from 0.3 mm to 0.9 mm, although the deposition energy increases from 53.8 J to 141.4 J, the peak SW pressure increases from 6.8 MPa to only 9.4 MPa. Furthermore, shutting down the energy injection after the voltage peak has only a slight effect on the peak pressure.

Fig. 12. Typical pressure waveforms of shock waves (SWs) when water gap or bypass switch acts at different moments. Reproduced with permission from Han et al., Phys. Plasmas 24, 063511 (2017). Copyright 2017 AIP Publishing LLC.

下载图片 查看所有图片

To conclude, the explosion occurring after vaporization is significant for the SW strength. First, the energy deposition for phase transitions matters for SW only when the explosion happens. Once the explosion occurs, the DC expands rapidly and relatively strong SWs are generated. Second, the energy deposition from the moment of explosion to the voltage collapse helps to maintain the DC volume expansion, thereby increasing the SW energy until the SW front separates from the DC. Third, the energy deposited into the developed plasma channel may have a limited effect on the SWs, but it is significant for the plasma radiation. The results above verify the contribution that vaporization makes to the generation of strong SWs in a UEWE. For a given stored energy, the strongest SWs arise when the electrical energy is absorbed before the voltage collapse (type C).

4.3 C. Characteristics of underwater shock waves

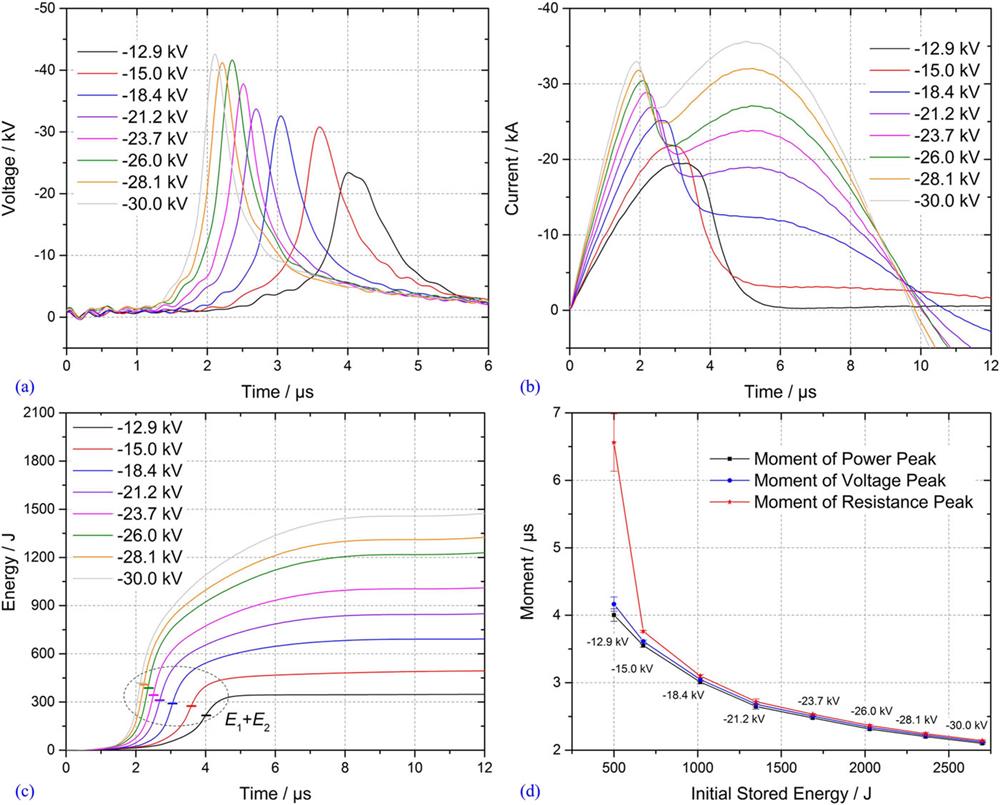
The aforementioned experiments revealed how light radiation and SWs are generated in a UEWE. Nevertheless, predicting the SW parameters is a sophisticated process, even with the help of numerical simulations. Given that SWs are extremely important in engineering, further characterization research is needed. To facilitate comparison with previous experiments, a 4-cm-long metal Cu wire with a diameter of 300 µm was selected, and the stored energy (charging voltage) in the system for electrical explosion was 500 J (−12.9 kV), 675 J (−15.0 kV), 1016 J (−18.4 kV), 1348 J (−21.2 kV), 1688 J (−23.7 kV), 2028 J (−26.0 kV), 2363 J (−28.1 kV), and 2700 J (−30.0 kV).44 In these above eight cases, the initial stored energy ratio was around 0.74:1:1.5:2:2.5:3:3.5:4.

Figure 13 shows typical waveforms of voltage, current, and deposited energy in each of the eight electrical explosions, along with the timings of the peak power, voltage and resistance. With increasing stored energy, (i) the energy injection rate (electrical power) increases, (ii) the explosion timing decreases from around 4 µs to nearly 2 µs, (iii) the voltage peak increases from around 23 kV and stabilizes at around 42 kV, (iv) the average rate of current rise before the explosion increases from 8.5 A/ns to 21.1 A/ns, and (v) the peak electrical power increases from around 320 MW–1288 MW. Also, the load deposition energy before the voltage peak is correlated positively with the stored energy of the system. Except for the case of 500 J (−12.9 kV), the peak load resistance decreases from around 2.2 Ω to around 1.4 Ω with increasing stored energy.

Fig. 13. Typical (a) voltage, (b) current, (c) deposition energy, and (d) timings of power, voltage, and resistance peaks for exploding a 300-μm-diameter, 4-cm-long Cu wire under a stored energy of from 500 J (−12.9 kV) to 2700 J (−30.0 kV). The marks in (c) show the deposited energy at the voltage peak. Reproduced with permission from Han et al., Phys. Plasmas 24, 093506 (2017). Copyright 2017 AIP Publishing LLC.

下载图片 查看所有图片

The complexity of the electrical explosion process means that as well as the voltage and current waveforms, one must also analyze the relationships between the discharge and SW parameters, for example the influence of energy deposition at different stages of the UEWE. The energy deposition at different stages is defined as E1=t0texURIdtE2=textupeakURIdtE3=tupeaktspinURIdt,and E4=tspintzeroURIdt, where E1, E2, E3, and E4 are the deposition energies of the wire load before the explosion, during the explosion, during the ionization stage, and after the ionization stage to the first zero-crossing point of the current, respectively. Furthermore, t0, tex, tupeak, tspin, and tzero are the start time of the discharge, the start time of the explosion, the inflection point where the slope of the voltage drops from steep to gentle, and the first zero-crossing point of the current, respectively. Also, we define the deposition energy of the wire at the peak electrical power as Ep, the deposition energy at the peak resistance as ER, and the stored energy of the system as E0.
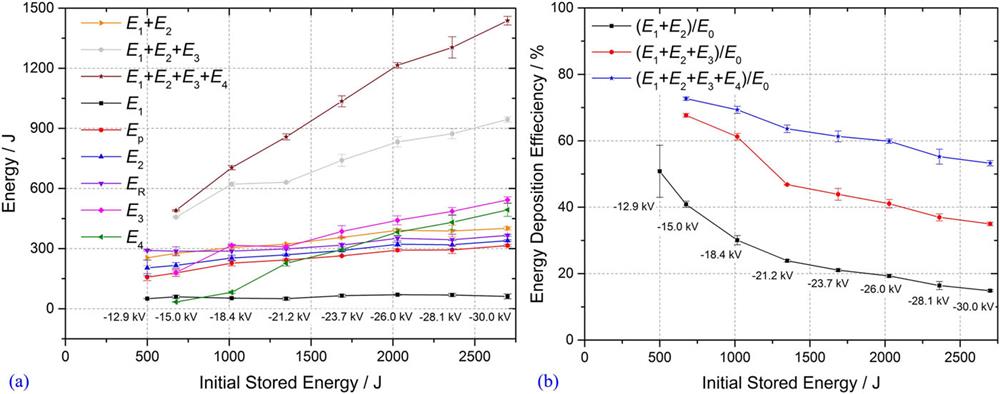
Figure 14 shows how the aforementioned deposited energies vary with increasing stored energy E0. Figure 14(a) shows that E1 remains almost unchanged, whereas Ep, E2, and ER have slightly upward trends. By contrast, both E3 (magenta line) and E4 (olive line) increase obviously with increasing E0, but they are not synchronized. As for the energy deposition efficiency, Fig. 14(b) shows that with increasing E0, the ratio of the deposited energy before and after the voltage peak decreases continuously. In general, with increasing E0, the energy deposited before the voltage peak does not change much, whereas that after the voltage peak increases obviously, thereby varying the distribution of energy deposition.

Fig. 14. (a) Deposited energy and (b) energy deposition efficiency vs initial stored energy. Reproduced with permission from Han et al., Phys. Plasmas 24, 093506 (2017). Copyright 2017 AIP Publishing LLC.

下载图片 查看所有图片

Figure 15 shows the relationship between the SW parameters and the electrical parameters. The SW parameters were obtained from the reconstructed SWs.25 As well as the peak pressure ppeak, the energy ESW and impulse Jimpulse are calculated asJimpulse=0tpprec(t)dt,Eshock4πl20tpprec(t)2ρ0c0dt,where ρ0 is the density of the water medium, c0 is the speed of sound in water, and l is the distance from the wire to the probe.

We also introduce the parameter Π from the research by Grinenko et al.,10 namelyΠ=ρ0lwire(dploaddt)max,where lwire and pload are the wire length and the electrical power of the load, respectively.

Except for the almost linear relationship between the impulse Jimpulse and the parameter Π in Fig. 15(d), there is no satisfactory linear relationship between the SW parameters and the above electrical parameters.
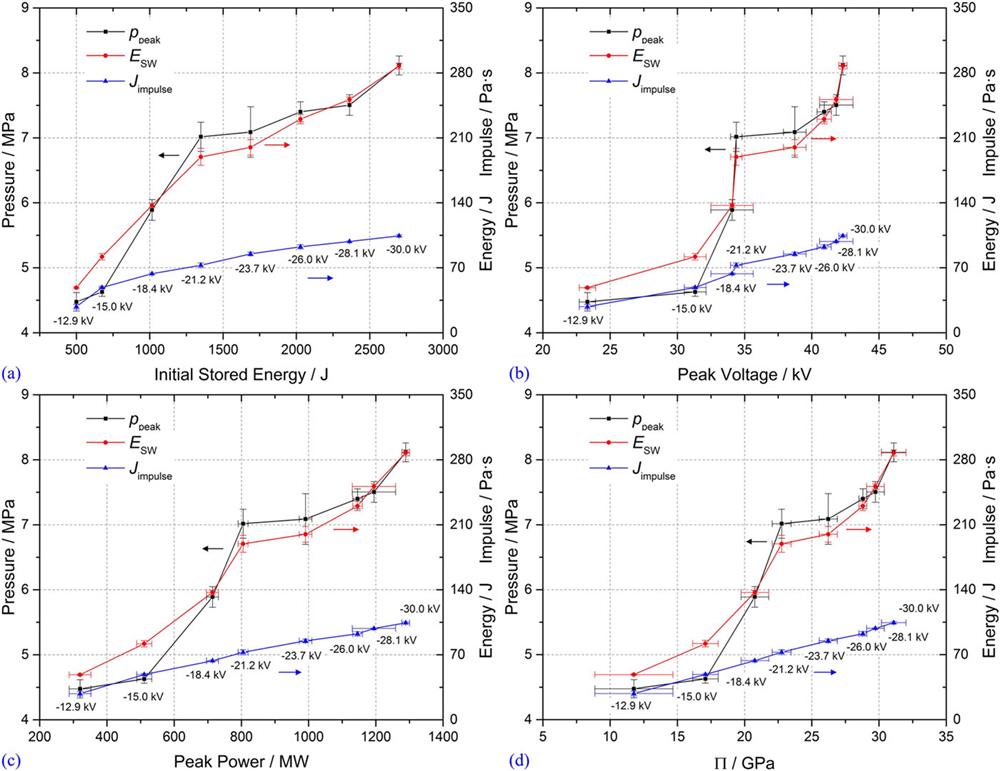
Fig. 15. Relationships between SW parameters and electrical parameters of UEWE. Reproduced with permission from Han et al., Phys. Plasmas 24, 093506 (2017). Copyright 2017 AIP Publishing LLC.
下载图片 查看所有图片

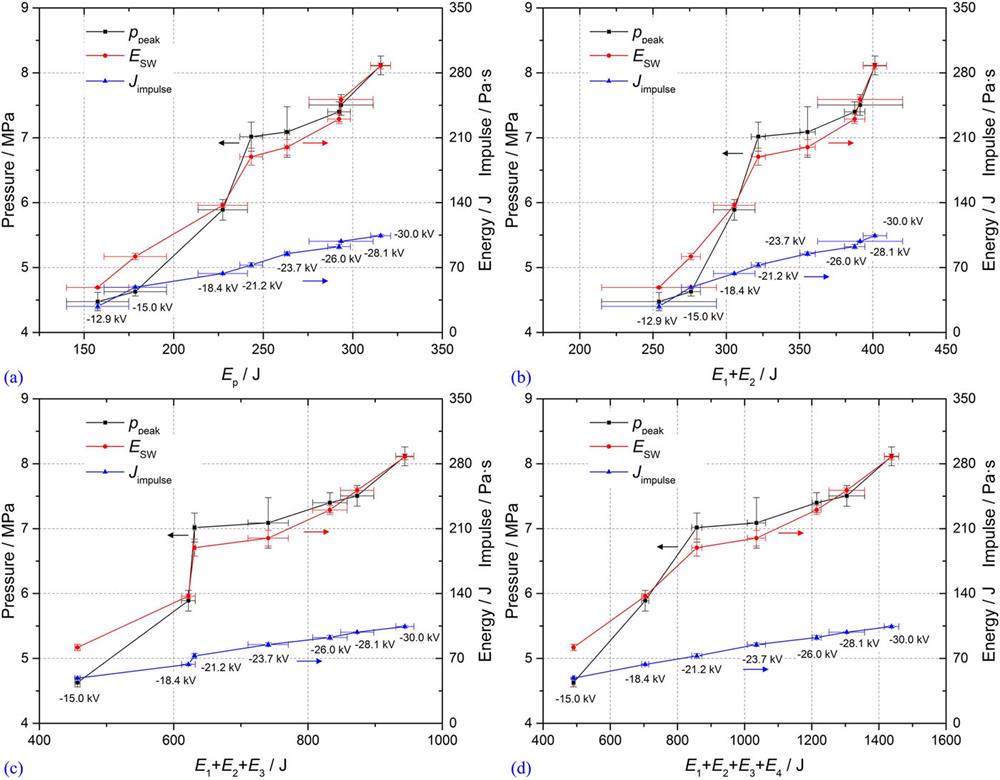
Figure 16 shows the relationships between the SW parameters and energy deposition at different stages. Similar to the results in Fig. 15, except that now there is an approximately linear relationship between the impulse Jimpulse and the deposition energy E1 + E2 + E3 + E4, there is no strict linear relationship between any of the SW parameters and the deposition energies. Both the main SW pressure peak and energy rise sharply after −18.4 kV and stop at −21.2 kV like a “step.” This phenomenon is also observed in Fig. 15.

Fig. 16. Relationship between SW parameters and deposition energy in different stages of eight types of UEWE. Reproduced with permission from Han et al., Phys. Plasmas 24, 093506 (2017). Copyright 2017 AIP Publishing LLC.

下载图片 查看所有图片

The above results suggest that there is no simple relationship between the SW and electrical parameters. Although the impulse Jimpulse appears to have a linear relationship with Π or the energy deposition E1 + E2 + E3 + E4, the pressure distribution of the SW does not follow a simple pattern. Accordingly, the DC expansion undergoes a complex variation with increasing stored energy. The SW amplitude should be determined mainly by the deposition energy when the SW front separates from the DC. The deposition energy from the moment of separation to the zero-crossing point of the current goes mainly into generating optical radiation and slowing the attenuation of the expansion rate of the explosion product. Increasing the stored energy from 500 J to 2700 J results in nonlinear enhancement of energy deposition in different stages non-uniformly. Therefore, the DC expansion and SWs cannot be described simply by any of the discharge parameters.

4.4 D. Empirical approach for estimating shock-wave parameters (Cu wire)

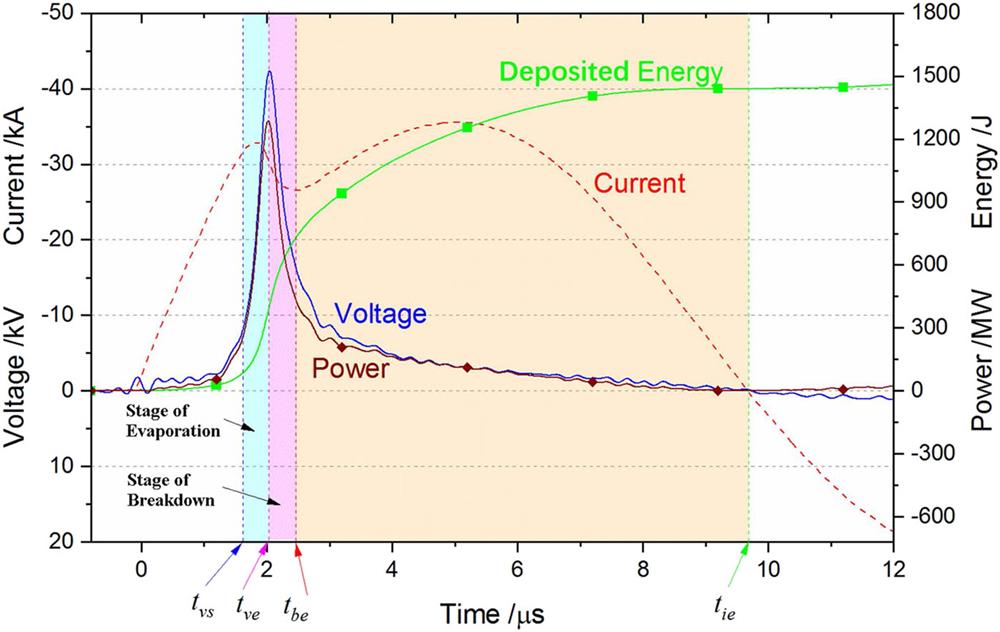
Although there is no simple relationship between the SW and electrical parameters, the SW strength tends to increase with increasing stored energy. Therefore, empirical formulas could be used to describe the relationships between SW and discharge parameters, and thus one could estimate the SWs from the measured discharge parameters, which would be significant for practical engineering.45 After all, in the field it is much easier to obtain in situ voltage and current signals than pressure waveforms. In the UEWE process, the most important aspects regarding SW generation are evaporation, breakdown, and plasma discharge, as illustrated in Fig. 17. The start time of the metal-evaporation stage is tvs, and the end time of the evaporation stage and the start time of the breakdown stage are both tve. Between tvs and tve, energy Ev is absorbed by the wire to evaporate the metal. Similarly, the breakdown stage is between tve and tbe, resulting in an energy deposition of Eb. The effective plasma stage (contributing to SWs) is defined as the period from tbe to tie, with an energy deposition of Ee. Also, the average electrical power during the above three stages is defined as Pv, Pb, and Pe, respectively. The overall energy deposition and average electrical power within the three stages (tvbe) are defined as Evbe and Pvbe, respectively. Hundreds of shots were carried out on different Cu wires under various values of the initial stored energy,46 and statistics were extracted for Evbe, Pvbe, tvbe, ppeak, and ESW. The relationships between the discharge parameters (deposited energy, electrical power, characteristic time) and the SW parameters (peak pressure, energy) were fitted using the Levenberg–Marquardt method, giving rise to two empirical equations,45 namelyppeak=5.86×10⁶tvbe0.295Evbe0.596Pvbe0.028,ESW=61.78tvbe0.587Evbe1.229Pvbe0.023.

Fig. 17. Typical waveforms and stage division of discharge process. Reproduced with permission from Yao et al., Phys. Plasmas 26, 093502 (2017). Copyright 2017 AIP Publishing LLC.

下载图片 查看所有图片

5 V. INFLUENCE OF WIRE MATERIAL AND AMBIENT MEDIUM

Understanding UEWE with other metal materials would be useful for practical engineering, and UEWE in wells or oceans faces a water medium of high conductivity, pressure, and/or temperature. Therefore, in this section we present some experimental studies on the influences of the wire material and the ambient medium.

5.2 A. Exploding different metal wires in water

In Z-pinch research, the wire material plays an extremely important role in the subsequent X-ray radiation. Romanova et al.47 summarized wire-explosion phenomena in vacuum or air under nanosecond discharges and divided the metals into three groups—namely copper (first group), tungsten (second group), and nickel (third group)—according to the characteristics of the DC structure. The inference is that material properties could have a sizeable influence on the SW characteristics. An experimental study was conducted to document the UEWE characteristics involving different wires made from 15 different metals or alloys, namely Al, Ti, Fe, Ni, Cu, Nb, Mo, Ag, Ta, W, W–Re (three ratios), Pt, and Au.48 Following Romanova et al.,47 these are divided into the following three groups for testing: (1) aluminum (Al), copper (Cu), silver (Ag), and gold (Au), which are typical non-refractory metal materials; (2) niobium (Nb), molybdenum (Mo), tantalum (Ta), tungsten (W), and tungsten-rhenium alloys (WRe25, WRe20, WRe05), which are representative refractory metal materials; (3) titanium (Ti), iron (Fe), nickel (Ni), and platinum (Pt), which are intermediate between groups 1 and 2.

1. UEWE of group 1

In this group, 4-cm-long Al, Cu, Ag, and Au wires with a diameter of 200 µm were exploded under a stored energy of 500 J. The discharge parameters and optical-emission intensity are illustrated in Fig. 18. Generally, these four metals behave similarly. However, Au has the largest peak voltage and current drop after the explosion, indicating the development of the vaporization of Au is longer than other materials, which may be related to its high first ionization energy (9.2 eV). Also, Al has the strongest optical-emission intensity, which may come from the chemical reactions between Al and water.49,50
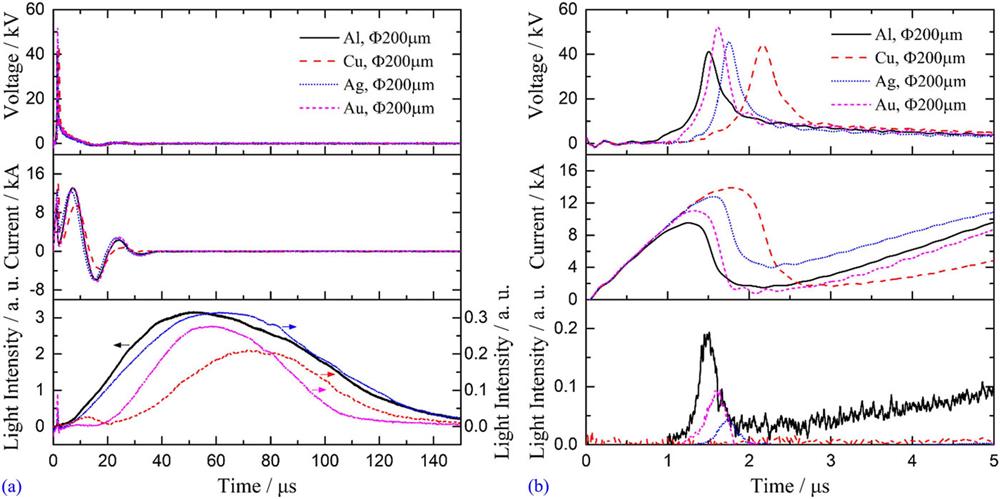
Fig. 18. Voltage, current, and light-intensity waveforms for Al, Cu, Ag, and Au wire explosions with a wire diameter of 200 µm (a) and (b), with different timescale of x-axis. Reproduced with permission from Han et al., J. Appl. Phys. 124, 043302 (2018). Copyright 2018 AIP Publishing LLC.

下载图片 查看所有图片

The measured time-integrated optical emission spectra of Al, Cu, Ag, and Au wire explosions are shown in Fig. 19. The spectrum for Al is unique given the banded spectrum between 450 nm and 550 nm; also, note the strong absorption peak around 395 nm, which is evidence for Al–water reactions.51
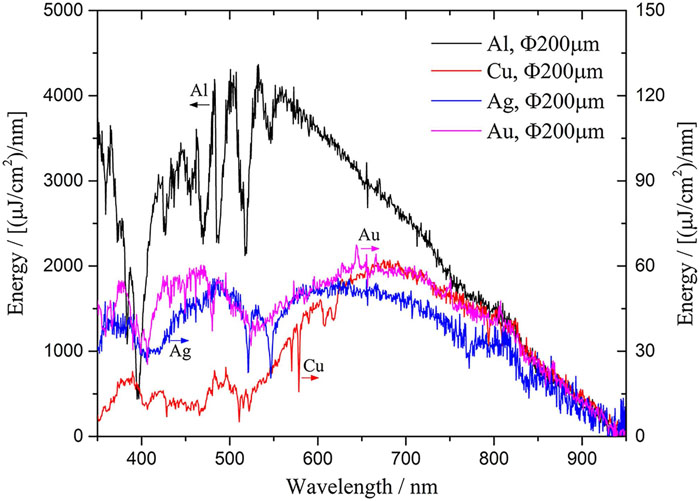
Fig. 19. Time-integrated spectra of Al, Cu, Ag, and Au explosions with a wire diameter of 200 µm. Reproduced with permission from Han et al., J. Appl. Phys. 124, 043302 (2018). Copyright 2018 AIP Publishing LLC.
下载图片 查看所有图片

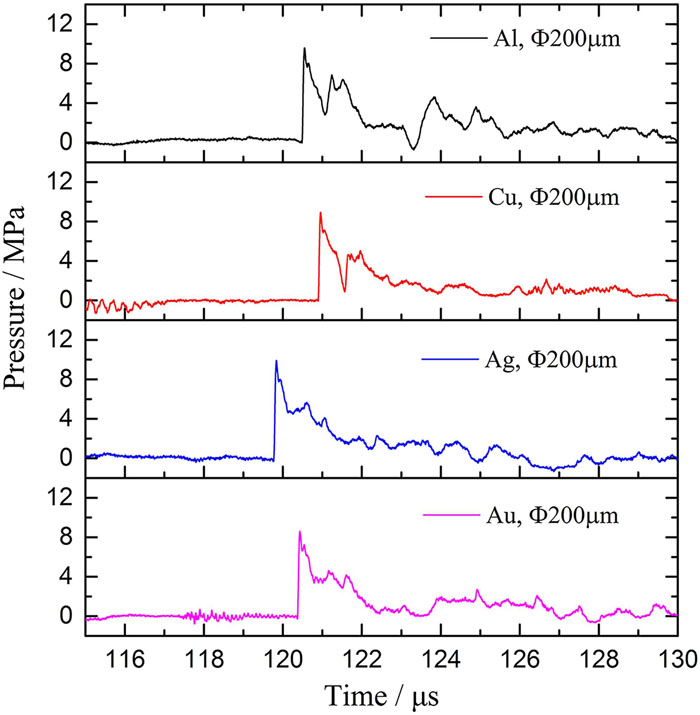
Figure 20 shows the pressure waveforms of the SWs. The weakest SW is that with Au, while the other three are stronger but similar to each other.

Fig. 20. Pressure waveforms of SWs for Al, Cu, Ag, and Au explosions with a wire diameter of 200 µm. Reproduced with permission from Han et al., J. Appl. Phys. 124, 043302 (2018). Copyright 2018 AIP Publishing LLC.

下载图片 查看所有图片

2. UEWE of group 2

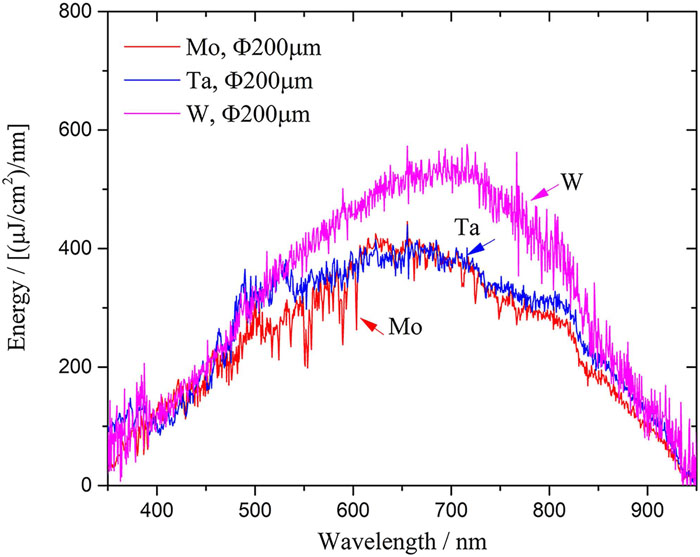
In this group, 4-cm-long Mo, Ta, and W wires with a diameter of 200 µm were exploded under a stored energy of 500 J. The discharge parameters and optical-emission intensity are shown in Fig. 21. The voltage and current waveforms of the metals exhibit different features from those of group 1. The most noticeable feature is the hump shape of the voltage waveforms, which is determined by the conductivities of these metals in liquid form.52–54 The second peak is related to the vaporization.55,56 The measured time-integrated optical emission spectra of Mo, Ta, and W wire explosions are shown in Fig. 22; the spectra of them are similar, indicating the status of the DC of Mo, Ta, and W might be similar.
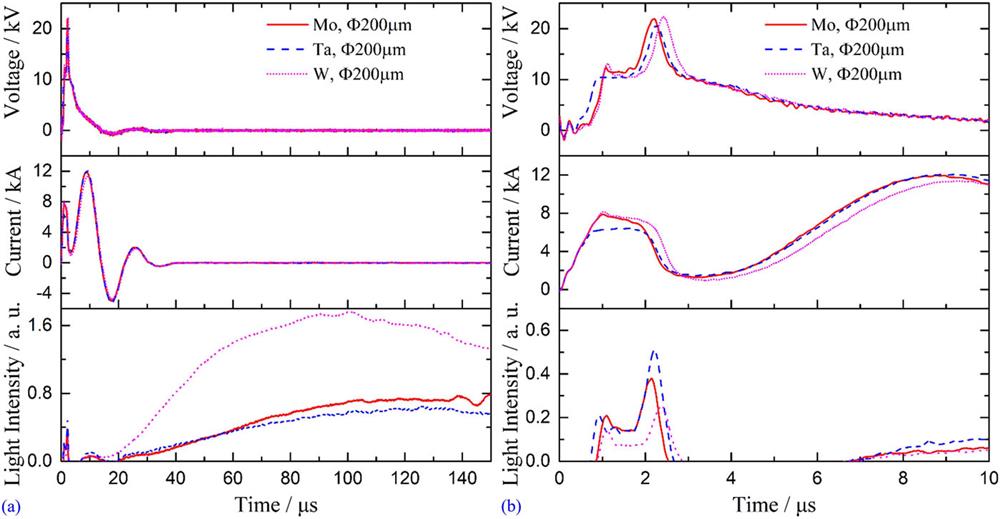
Fig. 21. Voltage, current, and light-intensity waveforms for Mo, Ta, and W explosions with a wire diameter of 200 µm (a) and (b), with different timescale of x-axis. Reproduced with permission from Han et al., J. Appl. Phys. 124, 043302 (2018). Copyright 2018 AIP Publishing LLC.
下载图片 查看所有图片

Fig. 22. Time-integrated spectra of Mo, Ta, and W explosions with a wire diameter of 200 µm. Reproduced with permission from Han et al., J. Appl. Phys. 124, 043302 (2018). Copyright 2018 AIP Publishing LLC.

下载图片 查看所有图片

3. UEWE of group 3

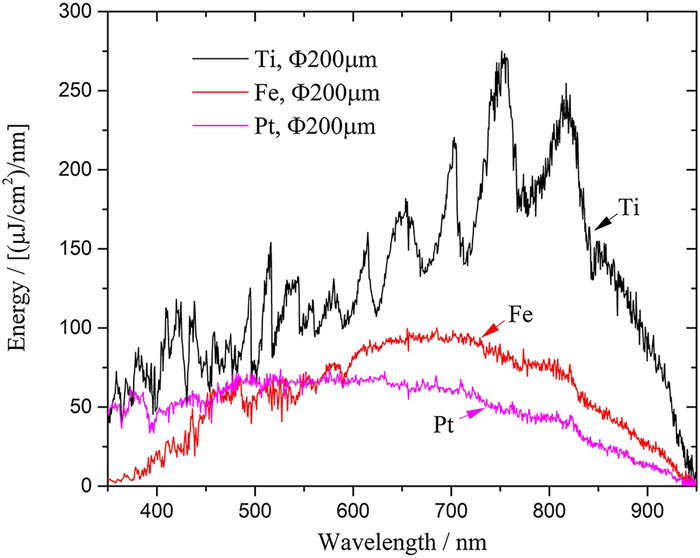
In this experiment, 4-cm-long Ti, Fe, and Pt wires with a diameter of 200 µm were evaluated under a stored energy of 500 J. The discharge parameters and optical-emission intensity are shown in Fig. 23. Generally, this group combines the features of groups 1 and 2. The measured time-integrated optical emission spectra of Ti, Fe, and Pt wire explosions are shown in Fig. 24; it can be seen that Ti and Fe react with water, giving rise to banded spectra.
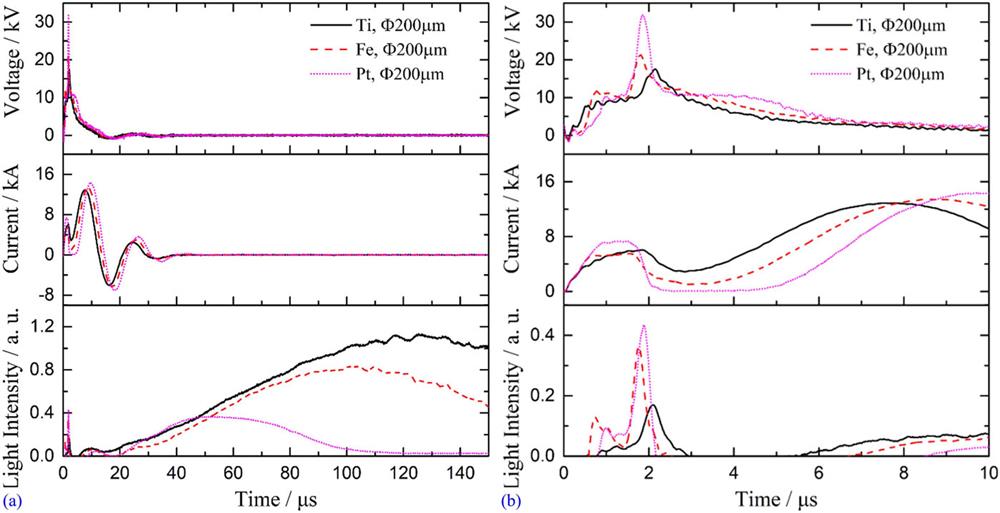
Fig. 23. Voltage, current, and light-intensity waveforms for Mo, Ta, and W explosions with a wire diameter of 200 µm (a) and (b), with different timescale of x-axis. Reproduced with permission from Han et al., J. Appl. Phys. 124, 043302 (2018). Copyright 2018 AIP Publishing LLC.
下载图片 查看所有图片

Fig. 24. Time-integrated spectra of Ti, Fe, and Pt explosions with a wire diameter of 200 µm. Reproduced with permission from Han et al., J. Appl. Phys. 124, 043302 (2018). Copyright 2018 AIP Publishing LLC.

下载图片 查看所有图片

4. A brief summary

To aid and support the discussion, the experimental parameters for the shots are summarized in Table I, where E1E4 (deposited energy for different stages) were defined in Sec. IV B, Eatom is the atomization enthalpy of a specified load, and Eopt is the optical energy density from the spectrometer, namelyEopt=350nm950nmeopt(λ)dλ.

Table 1. Summary of discharge parameters for metals in groups 1–3.

Load type (⌀200 mm)E1 + E2 (J)E3 + E4 (J)Eatom (J)Eopt (μJ/cm2)P (MPa)
Group 1Al73.6 ± 1.2266.7 ± 3.241.51 374 5519.7 ± 0.3
Cu143.9 ± 4.4231.5 ± 4.859.818 2419.4 ± 0.5
Ag88.5 ± 2.8261.1 ± 3.934.821 75010.2 ± 0.4
Au94.9 ± 0.7247.0 ± 1.845.125 3588.8 ± 0.5
Group 2Mo122.3 ± 2.1232.7 ± 3.388.7144 9046.5 ± 0.4
Ta114.5 ± 1.8242.6 ± 2.490.6157 7744.7 ± 0.5
W140.3 ± 1.4210.1 ± 1.6113.2193 7426.6 ± 1.0
Group 3Ti92.7 ± 1.3246.7 ± 3.555.875 8818.2 ± 0.2
Fe76.6 ± 1.4261.5 ± 4.773.534 3057.6 ± 0.4
Pt99.2 ± 0.7220.2 ± 2.678.129 3597.6 ± 0.1

查看所有表

When comparing different metal wires of the same size, the effects of the material properties are obvious. Regarding the discharge properties, the group-1 metals have the highest voltage peak while the group-2 ones have the lowest. The differing electrical behavior is due to the electrical and thermophysical properties of the test materials. Accordingly, the energy-deposition characteristics show different patterns. Figure 25 illustrates the ratio (E1 + E2)/Eatom, which is also known as the overheating factor.57 Group 1 has the highest ratio (∼2) and is accompanied by the strongest SWs. Therefore, to generate stronger SWs, the metals in group 1 should be considered. Also, chemical reactions are found in Al, Ti, and Fe wire explosions in water, but how those reactions affect the SW parameters requires further investigation.
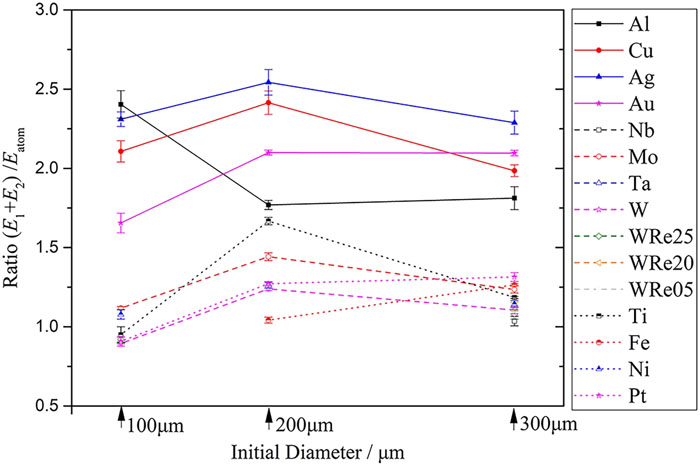
Fig. 25. Ratio (E1 + E2)/Eatom for experiments with different wire materials. Reproduced with permission from Han et al., J. Appl. Phys. 124, 043302 (2018). Copyright 2018 AIP Publishing LLC.

下载图片 查看所有图片

5.3 B. Wire explosions in water in different states

In practical engineering, the liquid in the well often has higher conductivity, hydrostatic pressure, and temperature than those of the water used in laboratory tests. Therefore, how the water parameters influence the behavior of a UEWE must be investigated. An experiment was designed to study a Cu wire explosion (200-µm diameter, 4-cm length) in water with different conductivity, hydrostatic pressure, and temperature.58

1. Exploding a wire in salt solutions (184 µS/cm–7410 µS/cm)

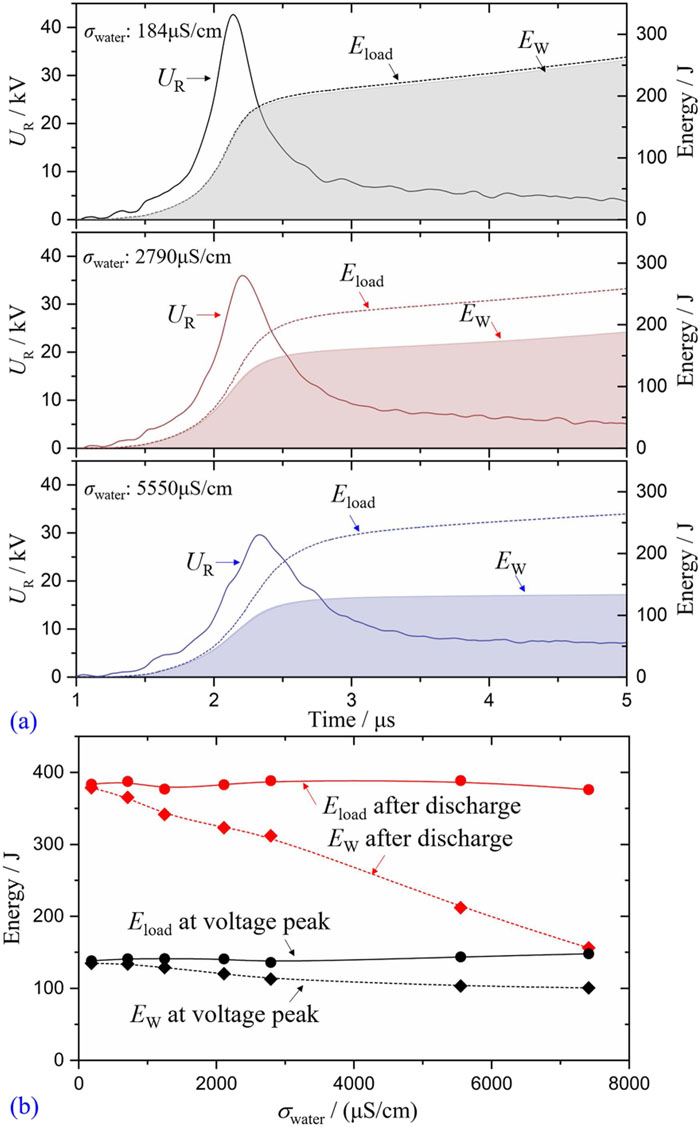
To study the influence of water conductivity, NaCl was used to prepare different salt solutions.58Figure 26 shows the energy-deposition status of the wire explosion.58 Here, we define Eload as the energy dissipated in the exploding wire and water (a parallel resistor) and EW as the energy deposited into the exploding wire itself.58 With increasing σwater (the conductivity of water), Eload remains almost unchanged whereas EW and the voltage peak both exhibit obvious decreases.58 As σwater is increased from 184 to 7410 µS/cm, the voltage peak decreases from 42.6 kV (at 2.14 µs) to 23.4 kV (at 2.46 µs).58 In this case, the overheating factor at the voltage peak decreased from around 1.9 to around 1.4.58 Therefore, the nature of the shunt effect for salt solutions is decreasing the energy injection rate into the wire, thereby changing the vaporization, ionization, and plasma process.58 Therefore, when exploding a wire in a liquid medium with high conductivity, such as seawater, the shunt effect should be considered.

Fig. 26. Energy (a) deposition process and (b) variation tendency for explosion of a 200-μm-diameter, 4-cm-long Cu wire in different salt solutions. Reproduced with permission from Han et al., Eur. Phys. J. Plus 135, 50 (2020). Copyright 2020 Springer Nature.

下载图片 查看所有图片

2. Exploding a wire under different hydrostatic pressures (0.1 MPa–0.9 MPa)

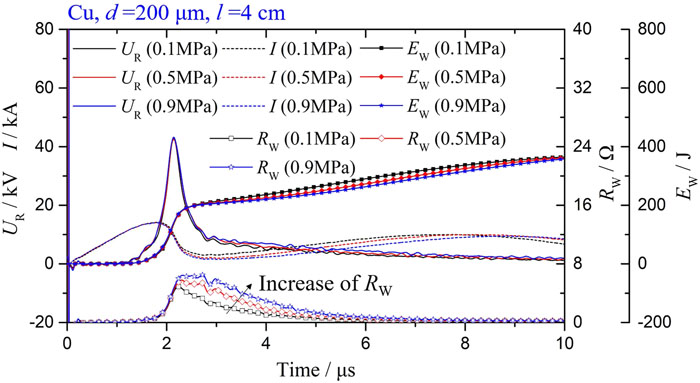
In tap water (184 µS/cm, 283 K), wires of 4-cm-long and 200-μm-diameter were exploded under hydrostatic (absolute) pressures of 0.1 MPa, 0.5 MPa, and 0.9 MPa.58Figure 27 shows the representative UR, I, EW, and RW waveforms for those wire explosions.58 Theoretically, the pressure in the DC could reach gigapascal level,10 therefore this relatively low ambient pressure may have little influence on the UEWE process.58 However, it does have an obvious influence when the wire changes from a liquid to a vapor-low-ionized plasma (fast stage of DC expansion), namely, the early stage of the electrical explosion.59 Accordingly, the voltage and current waveforms are highly consistent around the voltage peak.58 However, the variation of RW or EW reveals a discrepancy in the DC (cavity) status:58 in the later stage of DC expansion, the ambient pressure may impede the expansion of this cavity, resulting in higher resistance RW, as seen in Fig. 27.58 This phenomenon has also been observed in underwater discharges, where the ambient pressure suppresses the expansion of bubbles generated by streamers.60

Fig. 27. Load voltage UR, circuit current I, deposited energy EW, and load resistance RW waveforms (representative) for exploding a 200-μm-diameter, 4-cm-long Cu wire under different hydrostatic pressures. Reproduced with permission from Han et al., Eur. Phys. J. Plus 135, 50 (2020). Copyright 2020 Springer Nature.

下载图片 查看所有图片

3. Exploding a wire under different temperatures (283 K–323 K)

In tap water (184 µS/cm, 0.1 MPa), wires of 4-cm-long and 200-μm-diameter were exploded at temperatures of 283 K, 303 K, and 323 K.58 No obvious difference could be found among those wire explosions at different temperatures, nor do the results of the SW and optical emission.58 However, this conclusion could be different for higher temperatures (e.g., nearing the boiling point).58

6 VI. INTENSIFICATION AND REGULATION OF SHOCK WAVES

Pre-setting a wire between the two electrodes of the water gap (UEWE) can provide an initial channel for the discharge current, help reduce pre-breakdown energy loss, improve the discharge stability, and improve the SW energy conversion efficiency.61,62 However, the SW generation mechanism of UEWE depends on the expansion of the DC. The relatively high electrical conductivity of the plasma hinders further energy deposition in the DC after breakdown happens, causing the generated SW to decay rapidly. In Sec. IV B, it was verified that the vaporization process contributes significantly to the SW. Therefore, to generate stronger SWs under a specific energy storage, the mass of the wire should be as large as possible (under the premise of ensuring that the load is fully vaporized). However, the selection of wire size needs to consider factors such as skin effect, system insulation level, and MHD instability, which means that the stored energy or the wire mass may have an upper limit. Accordingly, without changing the load structure, the strength of SWs generated by UEWE would be limited.

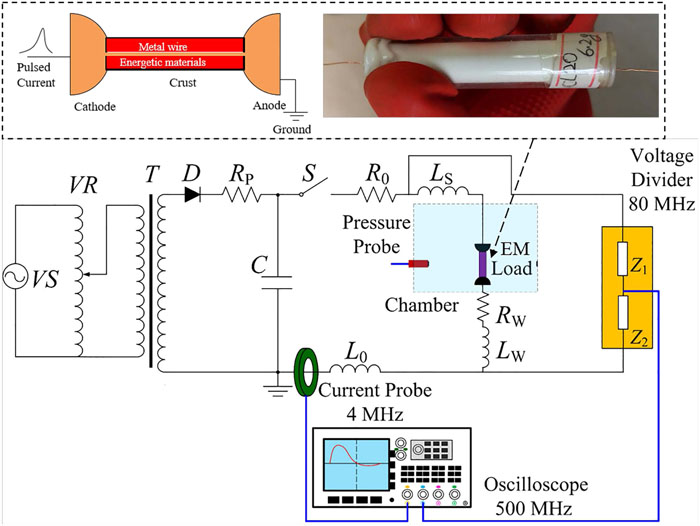
Facing the demand for stronger SWs to crack reservoirs in practical engineering,63 a straightforward method combining the advantages of both UEWE and chemical explosion was proposed, where SWs are amplified by an EM coat surrounding the metal wire.19 The structure and installation of this EM load are shown in Fig. 28. Pilot experiments were performed to study the characteristics of EM loads.17–19,64

Fig. 28. (a) Structure and real object of an energetic material (EM) load. (b) Schematic of experimental setup with an EM load. Reproduced with permission from Han et al., J. Appl. Phys. 125, 153302 (2019). Copyright 2019 AIP Publishing LLC.

下载图片 查看所有图片

With different fillers, a group of EM loads is exploded in a 2-m-diameter chamber. The SW parameters are summarized in Fig. 29. Note that these SWs were not reconstructed because the ideal SW shape is unknown for this case. Here, ppeak is the peak pressure, Ätrise and tp are the rise time and period, respectively, of the compression wave, and Jimpulse and ESW are the impulse and energy, respectively, during tp. The efficiency ç is introduced to represent the energy transfer efficiency of an SW, which is described aswhere E0 is the system stored energy and Echem is the explosion heat of the EM cover.
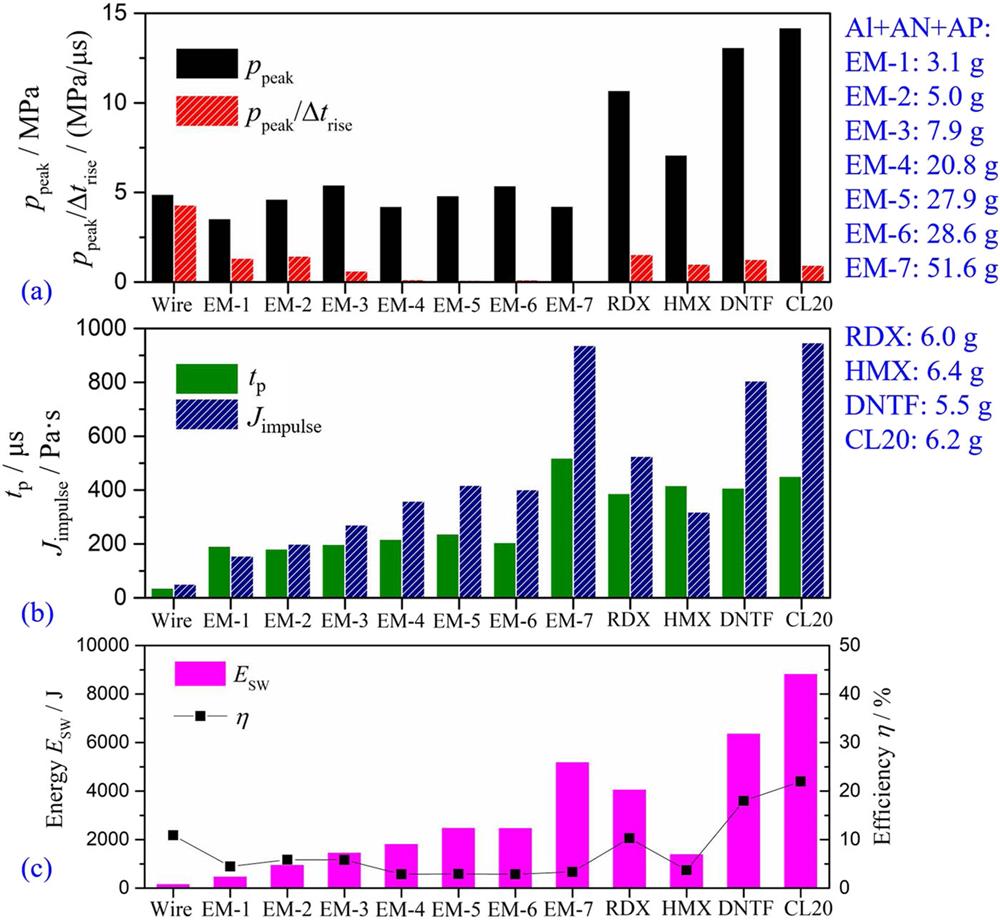
Fig. 29. Variations of SW parameters (a) ppeak and ppeaktrise, (b) tp and Jimpulse, and (c) ESW and η. EM-1 to EM-6 are filled with NH4NO3, NH4ClO4, and Al powders, and with different dimensions. Reproduced from with permission Han et al., J. Appl. Phys. 125, 153302 (2019). Copyright 2019 AIP Publishing LLC.

下载图片 查看所有图片

The experimental results in Fig. 29 show that the SW parameters varied over several orders of magnitude, therefore enhancing SWs via this method is incontrovertibly effective. More importantly, this method gives an approach for regulating the SW parameters, thereby expanding the applications of SW sources based on pulsed discharges.

As well as EM loads, wire-array explosions in water have become a research focus recently.65 Wire arrays of different types (e.g., planar, cylindrical, conical, spherical) generate different SWs. Recently, for a load of given mass, Qian et al.66 showed that a wire array generates stronger SWs than those by a single wire. Therefore, should be some potential for using wire arrays to generate stronger SWs or achieve controllable SWs.

7 VII. FRACTURING EFFECT OF SHOCK WAVES VIA WIRE EXPLOSION

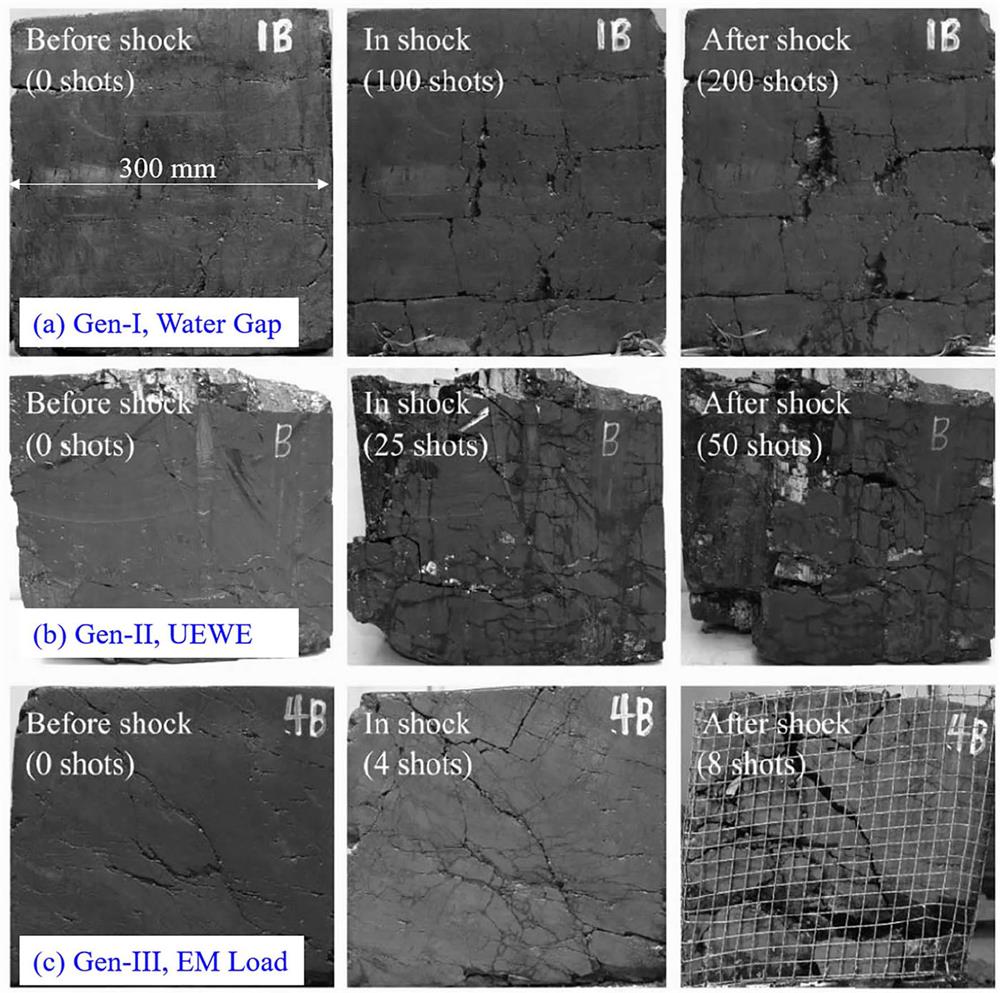
As mentioned in Sec. I, our group has proposed three generations of SW source (Gen-I, Gen-II, and Gen-III in Fig. 30) based on pulsed discharge.18 Schematics and the SW characteristics of the three techniques are shown in Fig. 30.18 The SWs were measured in a 25 × 8 × 7 m3 anechoic tank, a PCB138A11 probe was placed 3 m from the SW source, and the stored energy was 2300 J; see Ref. 18 for more details. To verify the fracturing effect, 300-mm coal cube specimens were used, and the cube center was 250 mm from the SW source.18Figure 31 shows photographs of the coal cube specimens before and after being subjected to SWs of the three types.
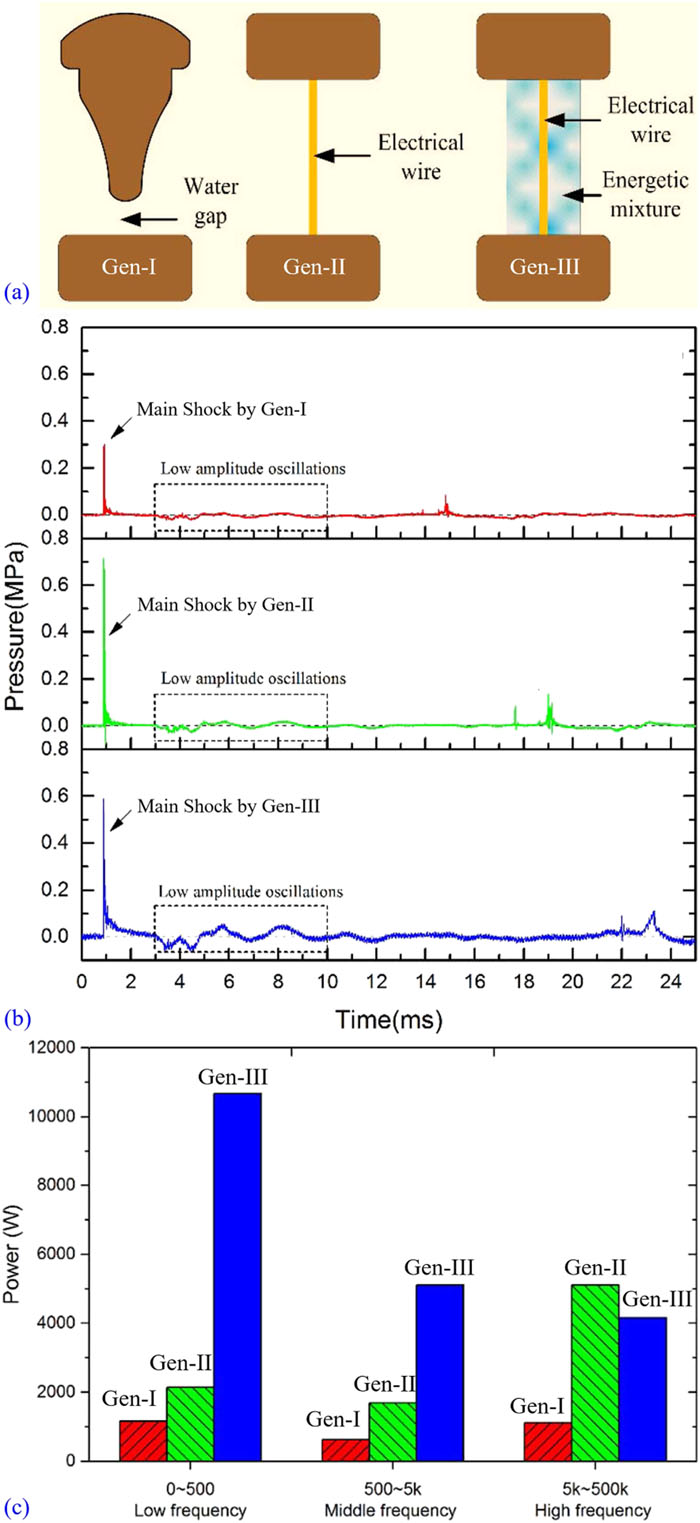
Fig. 30. (a) Schematics of three generations of underwater SW source proposed by our group. (b) Underwater SWs generated by a water gap (Gen-I), an exploding wire (Gen-II), and an EM load (Gen-III). (c) Power distribution within different frequency domains. Reproduced with permission from Zhou et al., IEEE Trans. Plasma Sci. 43, 4017–4023 (2015). Copyright 2015 IEEE.
下载图片 查看所有图片

Fig. 31. Fracturing effects of three types of SW source on coal cube specimens. Reproduced with permission from Zhou et al., IEEE Trans. Plasma Sci. 43, 4017–4023 (2015). Copyright 2015 IEEE.

下载图片 查看所有图片

The results for the fracturing effect show that the EM load is the most effective of the three approaches. Note that UEWE generates dense and uniform cracks because of its abundance of high-frequency SWs. Therefore, in the past few years, we have made many efforts to apply UEWE and EM loads in practical engineering, including developing equipment and engineering practices, among other aspects. To date, China has seen much progress in exploiting coalbed methane and shale gas, among other sources, based on UEWE or EM loads.5,67,68

To conclude, various experimental studies of UEWE have been conducted, and this review has summarized and presented a large amount of data on SW characteristics. Those data have supported dozens of engineering practices, which would also be helpful for the applications generating underwater SWs with similar methods, such as sound sources, mechanical processing, etc. However, the phenomenon of UEWE is still far from fully understood. Actually, we encountered many interesting phenomena and unsolved problems when dealing with the experiments. The main characteristics, difficulties, and challenges associated with this technology are listed in Table II.

Table 2. Main conclusions from previous studies and existing problems of UEWE for reservoir-stimulation technology.

Main characteristicsDifficulties and challenges
For generating strong SWs:For UEWE:
• Under type-C discharge• Physics behind electrical behavior
• Non-refractory metals• Role of metal–water reactions
• Low shunt effect• Explosions under high hydrostatic pressure (>10 MPa)
• Add an EM cover
For EM load ignition:For EM load:
• Under type-B discharge• Ignition process and key factors
• Strong plasma radiation• Controllable SWs

查看所有表

8 VIII. CONCLUSIONS

A review of our recent experimental work concerning UEWE aimed at reservoir-stimulation technology was presented. Facing the complex working conditions in practical applications, the characteristics of optical emission and SWs were investigated systematically, which supports the development of reservoir-stimulation technology based on UEWE. The main findings are as follows.

First, the features of UEWE under different discharge types were clarified. Different combinations of metal wire and pulsed power source lead to different discharge types and phenomena. Three typical discharge modes are realized by the electrical explosion of 4-cm-long Cu and W wires with diameters of 50 µm–300 µm under a stored energy of 500 J: type A features a current pause, type B features a periodically oscillating circuit current, and type B features an aperiodic circuit current. Experimental results revealed that the fine metal wire (the wire with smaller diameter) easily meets type A, where no ionization occurs after the explosion and the secondary breakdown eventually occurs with the expansion of the explosion product, resulting in strong optical radiation and two successive SWs. With increasing diameter of the metal wire, the current pause gradually disappears. If the remaining energy after the explosion is sufficient, UEWE will follow type B, accompanied by strong light radiation and strong SWs. If the remaining energy is insufficient, then UEWE will follow type C, resulting in weak light radiation and strong SWs.

Second, the generation mechanisms and characteristics of SWs were researched. Two energy-bypass devices were designed to stop the energy injection into the wire at different stages of UEWE. For optical radiation, if the load is short-circuited before the plasma process, then the measured optical radiation is very weak. By contrast, if the load is bypassed after the formation of plasmas, then strong optical radiation is measured. For the SWs, if the load is short-circuited before the explosion, then the measured SW amplitude is below 2.2 MPa, otherwise the SW amplitude is above 6.8 MPa. The above experiment proves that the main source of optical emission is plasma. The SW generation mechanism is the expansion of the DC. This expansion is affected by the energy-deposition process. For loads of the same specification, as the system’s energy storage increases, the SW parameters are positively related to the electrical parameters such as deposition energy. The strength of the SW is determined mainly by the energy deposited before the SW front separates from the DC.

Third, UEWEs with different metallic materials were compared and analyzed. For Nb, Mo, Ta, W, and Re, a large amount of deposited energy is used for phase transitions, and the energy deposited before the voltage peak is 1–1.5 times the atomization enthalpy. For Cu, Ag, and Au, the deposited energy is usually more than twice the atomization enthalpy. Those differences make non-refractory metal wires generate SWs that are notably stronger those generated by refractory ones. Chemically active metals such as Al, Ti, and Fe react with water during the electrical-explosion process, producing intense light radiation. The heat released by the reactions can accelerate the phase transitions. Metals with high ionization energy, such as Au and Pt, are relatively difficult to ionize, thus the light radiation and SWs are weak.

Fourth, to clarify how the surrounding medium affects a wire explosion, this research compared and analyzed wire explosions in air and water. Water is effective at impeding the expansion and ionization of explosion products, resulting in large deposited energy and weak optical emission from high-density plasmas. As for the water parameters, with increasing water conductivity, a higher proportion of the circuit current passed through the salt solution, resulting in a lower energy-deposition rate and phase-transition process. As for hydrostatic pressure, it was found that the ambient pressure had a slight effect on the fast stage of DC expansion. However, the applied hydrostatic pressure could suppress the later stage of DC expansion, resulting in a higher DC resistance. Conversely, temperatures of 283 K–323 K have a limited effect on the wire-explosion process.

Finally, as a promising method for strengthening or regulating SWs, EMs ignited by wire explosion were investigated. The energy of the SWs increased from less than 200 J (UEWE) to more than 8 kJ (high explosive) under the same stored energy. Specifically, the type, quality, and geometric size of the EM have significant effects on the SWs. The strongest SWs were produced by high-explosive loads. Ordinary EMs such as ammonium nitrate mainly lengthen the tp and impulse of SWs, when compared with the bare-wire case. The larger the energetic load mass, the larger the duration and impulse of the SWs. The larger the diameter of the EM load, the slower the SW head.

References

[1] V. A.Burtsev, N. V.Kalinin, and A. V.Luchinski, Electrical Explosion of Conductors and Its Application in Electro-Physical Installations (Energoatomizdat, Moscow, 1990).

[2] A. Frank, S. V. Lebedev, D. D. Ryutov. Exploring astrophysics-relevant magnetohydrodynamics with pulsed-power laboratory facilities. Rev. Mod. Phys., 2019, 91: 025002.

[3] L. A. Collins, M. P. Desjarlais, J. D. Kress. Electrical conductivity for warm, dense aluminum plasmas and liquids. Phys. Rev. E, 2002, 66: 025401.

[4] Y. A. Kotov. Electric explosion of wires as a method for preparation of nanopowders. J. Nanopart. Res., 2003, 5: 539-550.

[5] A. Qiu, Y. Zhang, H. Zhou, et al.. Research progress in electrical explosion shockwave technology for developing fossil energy. High Voltage Eng., 2016, 42: 1009-1017.

[6] A. Fedotov, Y. E. Krasik, D. Sheftman, et al.. Underwater electrical wire explosion. Plasma Sources Sci. Technol., 2010, 19: 034020.

[7] A. Grinenko, Y. E. Krasik, A. Sayapin, et al.. Underwater electrical wire explosion and its applications. IEEE Trans. Plasma Sci., 2008, 36: 423-434.

[8] S. A. Pikuz, V. M. Romanova, S. I. Tkachenko, et al.. Maximum energy deposition during resistive stage and overvoltage at current driven nanosecond wire explosion. IEEE Trans. Plasma Sci., 2006, 34: 2330-2335.

[9] A. Grinenko, V. T. Gurovich, A. Saypin, et al.. Strongly coupled copper plasma generated by underwater electrical wire explosion. Phys. Rev. E, 2005, 72: 066401.

[10] S. Efimov, A. Grinenko, Y. E. Krasik, et al.. Nanosecond time scale, high power electrical wire explosion in water. Phys. Plasmas, 2006, 13: 042701.

[11] S. N. Bland, Y. E. Krasik, D. Yanuka, et al.. Generation of highly symmetric, cylindrically convergent shockwaves in water. Phys. Plasmas, 2017, 24: 082702.

[12] A. J. Gillard, S. F. Golovashchenko, A. V. Mamutov. Formability of dual phase steels in electrohydraulic forming. J. Mater. Process. Technol., 2013, 213: 1191-1212.

[13] M. Barcellos, K. Grunert, J. Kügler, et al.. European consumers’ acceptance of beef processing technologies: A focus group study. Innov. Food Sci. Emerg. Technol., 2010, 11: 721-732.

[14] M. Matallah, O. Maurel, T. Reess, et al.. Electrohydraulic shock wave generation as a means to increase intrinsic permeability of mortar. Cem. Concr. Res., 2010, 40: 1631-1638.

[15] W. Chen, O. Maurel, T. Reess, et al.. Experimental study on an alternative oil stimulation technique for tight gas reservoirs based on dynamic shock waves generated by pulsed arc electrohydraulic discharges. J. Petrol. Sci. Eng., 2012, 88-89: 67-74.

[16] V. T. Gurovich, A. Virozub, D. Yanuka, et al.. Addressing optimal underwater electrical explosion of a wire. Phys. Plasmas, 2016, 23: 092708.

[17] R. Han, J. Wu, H. Zhou, et al.. Parameter regulation of underwater shock waves based on exploding-wire-ignited energetic materials. J. Appl. Phys., 2019, 125: 153302.

[18] H. Li, Y. Zhang, H. Zhou, et al.. Generation of electrohydraulic shock waves by plasma-ignited energetic materials: III. Shock wave characteristics with three discharge loads. IEEE Trans. Plasma Sci., 2015, 43: 4017-4023.

[19] R. Han, Q. Liu, H. Zhou, et al.. Generation of electrohydraulic shock waves by plasma-ignited energetic materials: I. Fundamental mechanisms and processes. IEEE Trans. Plasma Sci., 2015, 43: 3999-4008.

[20] A. Grinenko, V. T. Gurovich, A. Sayapin, et al.. Underwater electrical explosion of a Cu wire. J. Appl. Phys., 2005, 97: 023303.

[21] S. Efimov, A. Fedotov-Gefen, L. Gilburd, et al.. Generation of a 400 GPa pressure in water using converging strong shock waves. Phys. Plasmas, 2011, 18: 062701.

[22] L. P.Orlenko, Explosion Physics (Science Press, Beijing, 2011), translated by C.Sun.

[23] R. Han, A. Qiu, J. Wu, et al.. A platform for exploding wires in different media. Rev. Sci. Instrum., 2017, 88: 103504.

[24] R. Han, J. Wu, H. Zhou, et al.. Characteristics of exploding metal wires in water with three discharge types. J. Appl. Phys., 2017, 122: 033302.

[25] R. Han, Y. Zhang, H. Zhou, et al.. Signal analysis and waveform reconstruction of shock waves generated by underwater electrical wire explosions with piezoelectric pressure probes. Sensors, 2016, 16: 573.

[26] W. G.Chace and H. K.Moore, Exploding Wires (Plenum Press, 1959), Vol. 1.

[27] D. V. Barishpoltsev, G. V. Ivanenkov, S. I. Tkachenko, et al.. Analysis of the discharge channel structure upon nanosecond electrical explosion of wires. Phys. Plasmas, 2007, 14: 123502.

[28] A. R. Mingaleev, V. M. Romanova, S. I. Tkachenko. Distribution of matter in the current-carrying plasma and dense core of the discharge channel formed upon electrical wire explosion. Plasma Phys. Rep., 2009, 35: 734-753.

[29] V. M. Romanova, T. A. Shelkovenko, S. I. Tkachenko, et al.. Laser imaging of secondary breakdown upon nanosecond electrical explosion of wire. IEEE Trans. Plasma Sci., 2008, 36: 1292-1293.

[30] Y. Fan, H. Shi, G. Yin, et al.. Multilayer weak shocks generated by restrike during underwater electrical explosion of Cu wires. Appl. Phys. Lett., 2019, 115: 084101.

[31] K.-J. Chung, Y. S. Hwang, K. Lee, et al.. Numerical model for electrical explosion of copper wires in water. J. Appl. Phys., 2016, 120: 203301.

[32] X. Wang. Research at Tsinghua University on electrical explosions of wires. Matter Radiat. Extremes, 2019, 4: 017201.

[33] S. Efimov, A. Rososhek, S. V. Tewari, et al.. Phase transitions of copper, aluminum, and tungsten wires during underwater electrical explosions. Phys. Plasmas, 2018, 25: 102709.

[34] G. S. Sarkisov, P. V. Sasorov, K. W. Struve, et al.. State of the metal core in nanosecond exploding wires and related phenomena. J. Appl. Phys., 2004, 96: 1674-1686.

[35] A. Fedotov, V. T. Gurovich, D. Sheftman, et al.. Spectroscopic research of underwater electrical wire explosion. Phys. Plasmas, 2008, 15: 082704.

[36] W. G. Chace, M. A. Levine. Classification of wire explosions. J. Appl. Phys., 1960, 31: 1298.

[37] R. L.Doney, G. B.Vunni, and J. H.Niederhaus, “Experiments and simulations of exploding aluminum wires: Validation of ALEGRA-MHD,” Technical Report No. ARL-TR-5299, Army Research Laboratory, Aberdeen Proving Ground, MD, USA, 2010.

[38] S. A. Chaikovsky, V. I. Oreshkin, N. A. Ratakhin, et al.. Water bath effect during the electrical underwater wire explosion. Phys. Plasmas, 2007, 14: 102703.

[39] R. B. Baksht, A. Y. Labetsky, V. I. Oreshkin, et al.. Study of metal conductivity near the critical point using a microwire electrical explosion in water. Tech. Phys., 2004, 49: 843-848.

[40] A. Rososhek, S. Theocharous, D. Yanuka, et al.. X-ray radiography of the overheating instability in underwater electrical explosions of wires. Phys. Plasmas, 2019, 26: 050703.

[41] A. Rososhek, S. Theocharous, D. Yanuka, et al.. Multi frame synchrotron radiography of pulsed power driven underwater single wire explosions. J. Appl. Phys., 2018, 124: 153301.

[42] S. N. Bland, S. P. Theocharous, D. Yanuka, et al.. Use of synchrotron-based radiography to diagnose pulsed power driven wire explosion experiments. Rev. Sci. Instrum., 2019, 90: 013504.

[43] R. Han, J. Wu, H. Zhou, et al.. Experimental verification of the vaporization’s contribution to the shock waves generated by underwater electrical wire explosion under microsecond timescale pulsed discharge. Phys. Plasmas, 2017, 24: 063511.

[44] R. Han, J. Wu, H. Zhou, et al.. Relationship between energy deposition and shock wave phenomenon in an underwater electrical wire explosion. Phys. Plasmas, 2017, 24: 093506.

[45] R. Han, W. Yao, H. Zhou, et al.. An empirical approach for parameters estimation of underwater electrical wire explosion. Phys. Plasmas, 2019, 26: 093502.

[46] H.Zhou, “Study on shock wave generation mechanism and energy conversion characteristics of underwater Cu-wire microsecond explosion,” Ph.D. thesis, Xi’an Jiaotong University, 2017.

[47] G. V. Ivanenkov, A. R. Mingaleev, V. M. Romanova, et al.. Electric explosion of fine wires: Three groups of materials. Plasma Phys. Rep., 2015, 41: 617-636.

[48] R. Han, A. Qiu, J. Wu, et al.. Electrical explosions of Al, Ti, Fe, Ni, Cu, Nb, Mo, Ag, Ta, W, W-Re, Pt, and Au wires in water: A comparison study. J. Appl. Phys., 2018, 124: 043302.

[49] Y. E. Krasik, A. Rososhek, D. Yanuka. Comparison of electrical explosions of Cu and Al wires in water and glycerol. Phys. Plasmas, 2017, 24: 053512.

[50] R. D. Ford, W. M. Lee. Pressure measurements correlated with electrical explosion of metals in water. J. Appl. Phys., 1988, 64: 3851-3854.

[51] M. Q. Brewster, M. R. Jones. Radiant emission from the aluminum-water reaction. J. Quant. Spectrosc. Radiat. Transfer, 1991, 46: 109-118.

[52] T. J.Tucker and R. P.Toth, “EBW1: A computer code for the prediction of the behavior of electrical circuits containing exploding wire elements,” Technical Report No. SAND-75-0041, Sandia National Laboratory, Albuquerque, NM, USA, 1975.

[53] S. V. Lebedev, A. I. Savvatimskiĭ. Metals during rapid heating by dense currents. Sov. Phys. Usp., 1984, 27: 749.

[54] P. Tolias. Analytical expressions for thermophysical properties of solid and liquid tungsten relevant for fusion applications. Nucl. Mater. Energy, 2017, 13: 42-57.

[55] A. E. Vlastós. Restrike mechanisms of exploding wire discharges. J. Appl. Phys., 1968, 39: 3081-3087.

[56] S. A. Pikuz, V. M. Romanova, S. I. Tkachenko, et al.. Overvoltage pulse development upon electrical explosion of thin wires. J. Phys. D: Appl. Phys., 2007, 40: 1742-1750.

[57] S. E. Rosenthal, G. S. Sarkisov, K. W. Struve, et al.. Joule energy deposition in exploding wire experiments. AIP Conf. Proc., 2002, 651: 213.

[58] R. Han, J. Wu, H. Zhou, et al.. Effects of water states on the process of underwater electrical wire explosion under microsecond timescale pulsed discharge. Eur. Phys. J. Plus, 2020, 135: 50.

[59] S. Efimov, V. Gurovich, A. Rososhek, et al.. Evolution of a shock wave generated by underwater electrical explosion of a single wire. Phys. Plasmas, 2019, 26: 042302.

[60] Y. F. Huang, L. C. Zhang, X. L. Zhu, et al.. Development of a simple model for predicting the spark-induced bubble behavior under different ambient pressures. J. Appl. Phys., 2016, 120: 043302.

[61] G. Bazalitski, S. Efimov, V. T. Gurovich, et al.. Addressing the efficiency of the energy transfer to the water flow by underwater electrical wire explosion. J. Appl. Phys., 2009, 106: 073308.

[62] S. Liu, Y. Liu, Y. Ren, et al.. Comparison and analysis of shockwave characteristics between underwater pulsed discharge and metal wire explosion. Phys. Plasmas, 2020, 27: 033503.

[63] W. Ding, R. Han, Q. Liu, et al.. Fracturing effect of electrohydraulic shock waves generated by plasma-ignited energetic materials explosion. IEEE Trans. Plasma Sci., 2017, 45: 423-431.

[64] R. Han, Q. Liu, H. Zhou, et al.. Generation of electrohydraulic shock waves by plasma-ignited energetic materials: II. Influence of wire configuration and stored energy. IEEE Trans. Plasma Sci., 2015, 43: 4009-4016.

[65] S. Efimov, Y. E. Krasik, D. Sheftman, et al.. Underwater electrical explosion of wires and wire arrays and generation of converging shock waves. IEEE Trans. Plasma Sci., 2016, 44: 412-431.

[66] L. X. Li, Z. G. Liu, D. Qian, et al.. Enhancement of shock wave generated by underwater electrical wire-array explosion at a fixed energy and mass of wire-array. IEEE Trans. Plasma Sci..

[67] Y. Qin, A. Qiu, Y. Zhang. Principle and engineering practices on coal reservoir permeability improved with electric pulse controllable shock waves. Coal Sci. Technol., 2017, 45: 79-85.

[68] Z. Meng, Y. Qin, Y. Zhang, et al.. Innovative engineering practice of soft coal seam permeability enhancement by controllable shock wave for mine gas extraction: A case of Zhongjing mine, Shuicheng, Guizhou Province, China. J. China Coal Society, 2019, 44: 2388-2400.

[69] X.Wang, private communication (24 May 2018).

Ruoyu Han, Jiawei Wu, Haibin Zhou, Yongmin Zhang, Aici Qiu, Jiaqi Yan, Weidong Ding, Chen Li, Chenyang Zhang, Jiting Ouyang. Experiments on the characteristics of underwater electrical wire explosions for reservoir stimulation[J]. Matter and Radiation at Extremes, 2020, 5(4): 047201.
本文已被 1 篇论文引用
被引统计数据来源于中国光学期刊网
引用该论文: TXT   |   EndNote

相关论文

加载中...

关于本站 Cookie 的使用提示

中国光学期刊网使用基于 cookie 的技术来更好地为您提供各项服务,点击此处了解我们的隐私策略。 如您需继续使用本网站,请您授权我们使用本地 cookie 来保存部分信息。
全站搜索
您最值得信赖的光电行业旗舰网络服务平台!