光学学报, 2019, 39 (6): 0601002, 网络出版: 2019-06-17
基于NPP-VIIRS卫星数据的渤黄海浊度反演算法研究  下载: 1070次
Inversion Algorithm for Turbidity of Bohai and Yellow Seas Based on NPP-VIIRS Satellite Data
图 & 表
图 1. 研究区域及浮标、航次调查站位图
Fig. 1. Study area, location of buoy, and sampling stations of different cruises
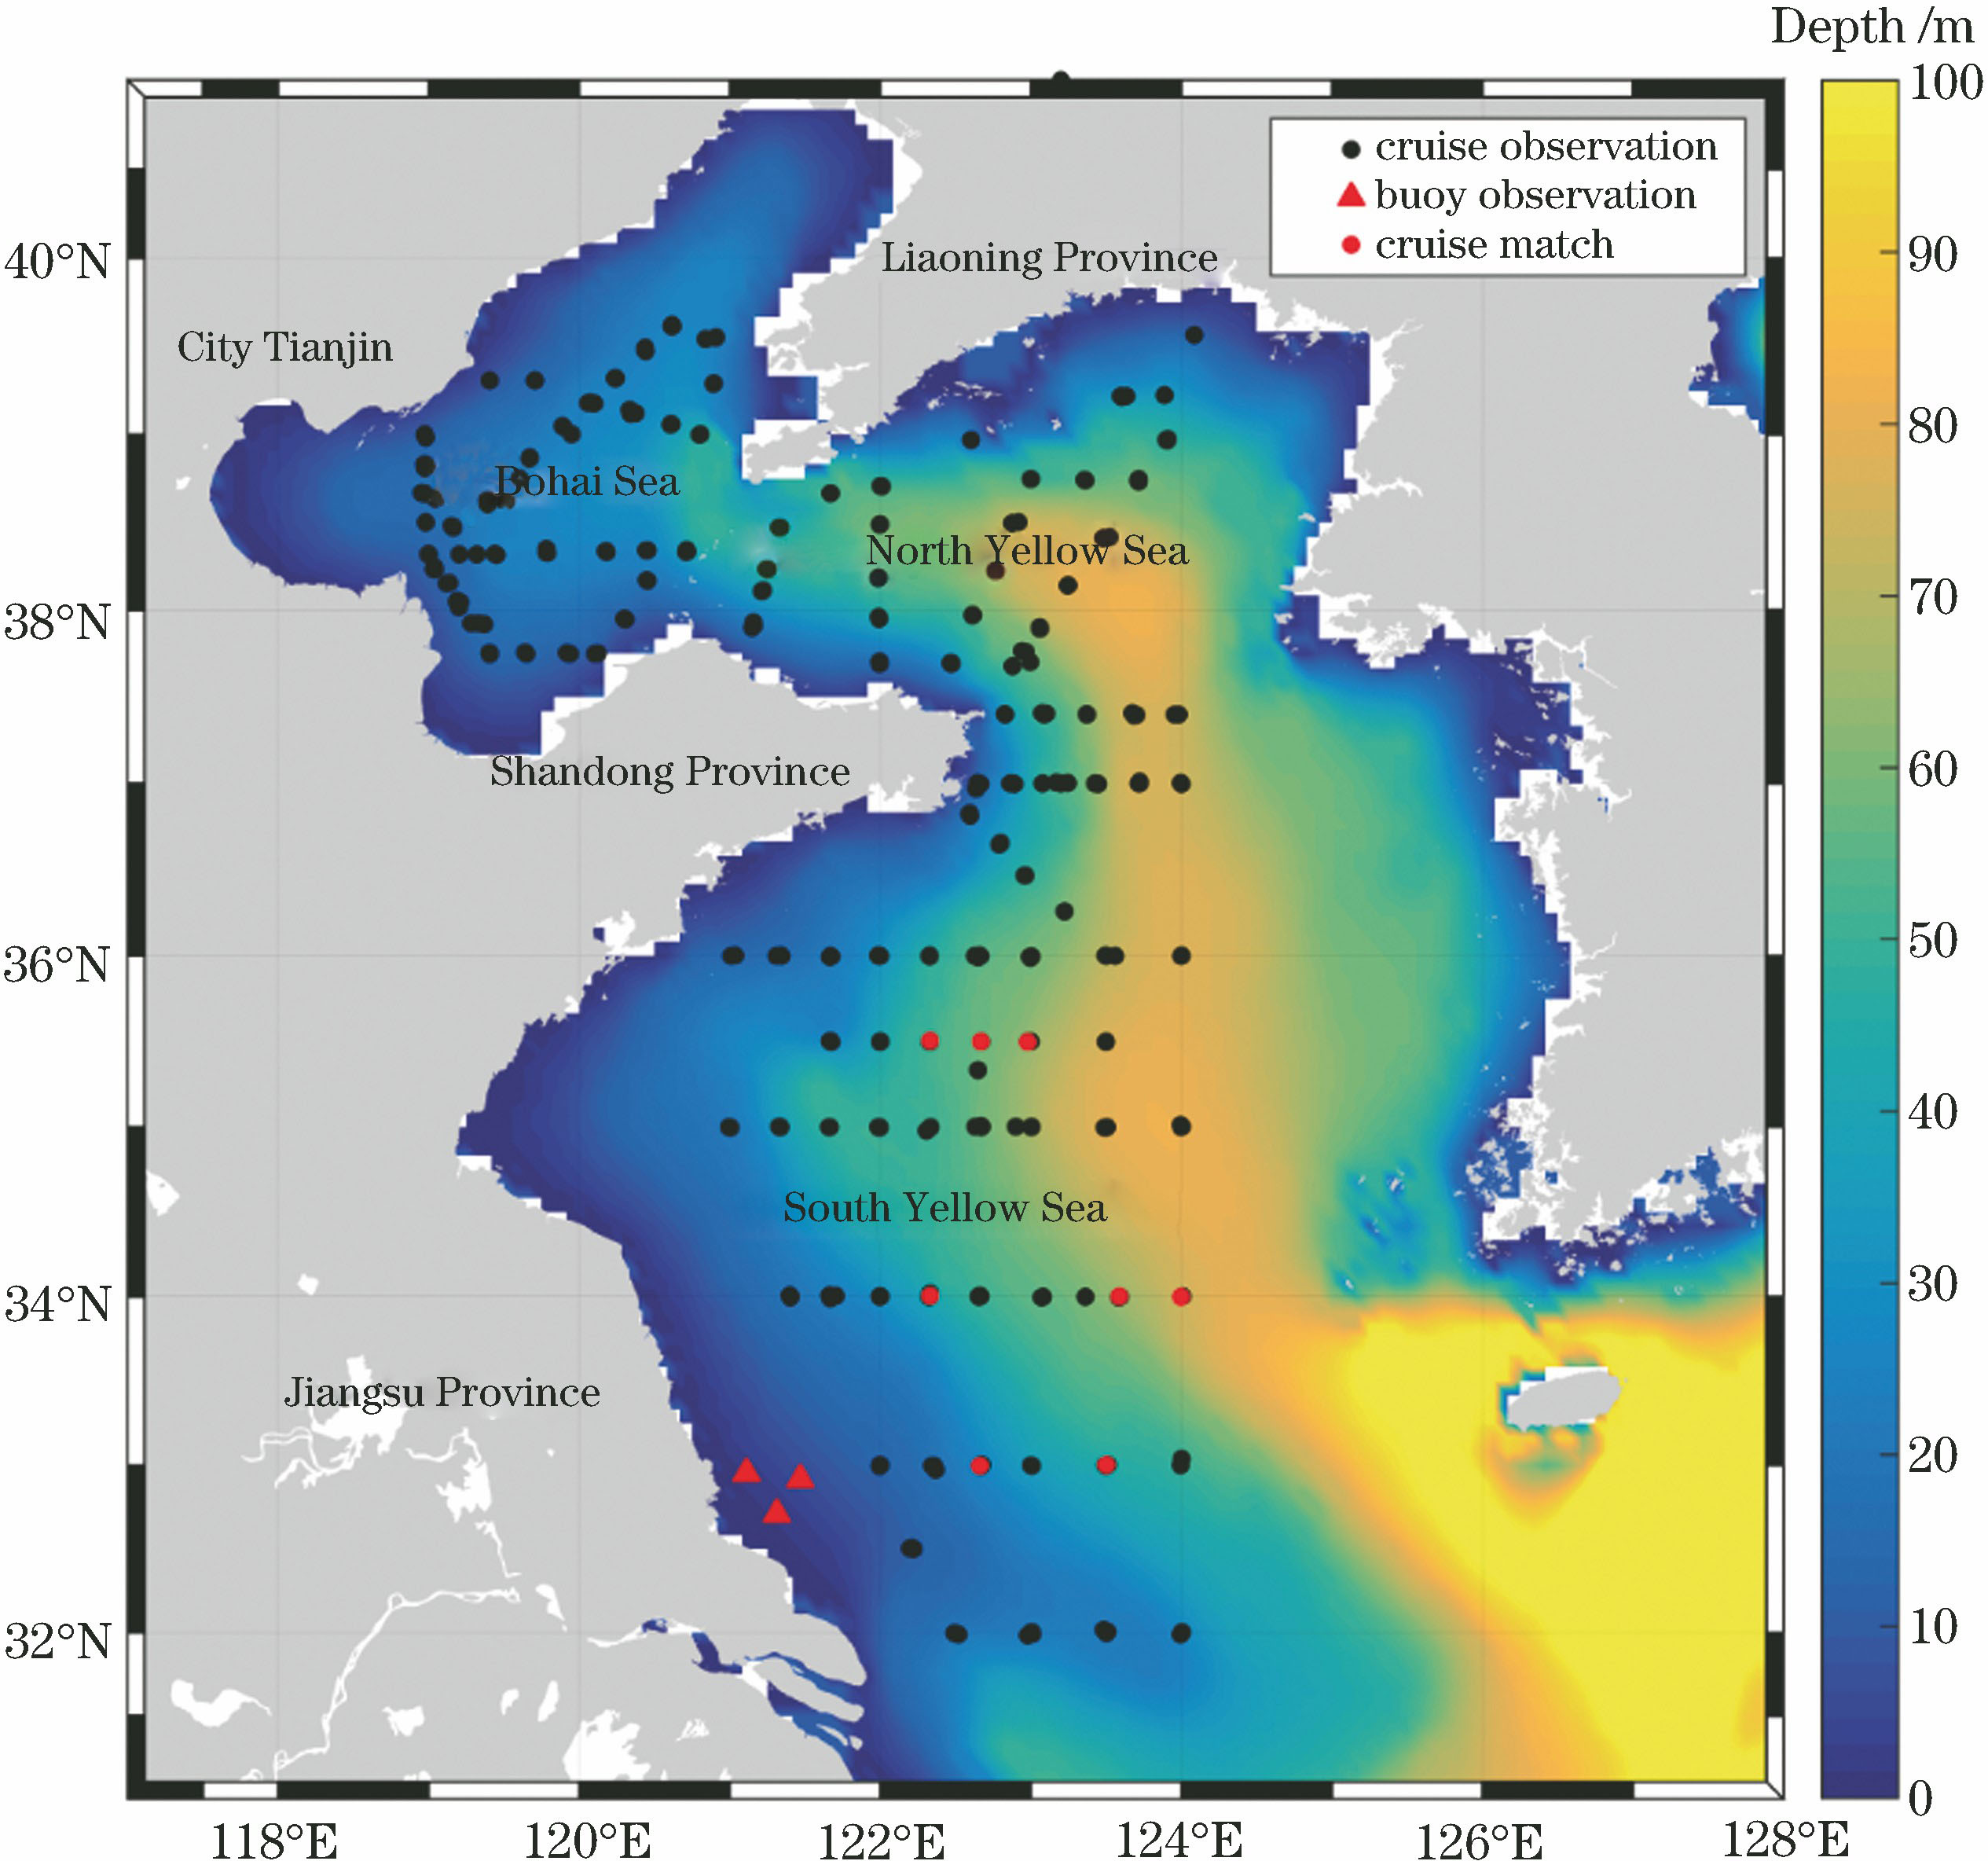
图 2. 基于(a)浮标和(b)航次观测的水体浊度统计结果
Fig. 2. Turbidity statistics of water bodies based on (a) buoy and (b) cruise observation

图 3. 不同形式下Rrs与浊度相关系数随波段的变化图
Fig. 3. Correlation coefficient between Rrs under different forms and T versus wavelength

图 4. 浊度与X1建模的结果(蓝色点为实测数据与卫星数据的匹配数据集)。(a)模型校准;(b)模型验证
Fig. 4. Turbidity and result of inversion model developed using X1 (blue dots are matching dataset of measured data and satellite data). (a) Model calibration; (b) model validation

图 5. 浊度与X2的建模结果(蓝色点为实测数据与卫星数据的匹配数据集)。(a)模型校准;(b)模型验证
Fig. 5. Turbidity and result of inversion model developed using X2 (blue dots are matching dataset of measured data and satellite data). (a) Model calibration; (b) model validation

图 6. 在443 nm和486 nm的Rrs中引入±5%的模拟随机误差后,不同模型估计的浊度值与实测值的散点图(蓝色点为实测数据与卫星数据的匹配数据集)。(a) X1模型;(b) X2模型
Fig. 6. Scatter plots of measured and estimated turbidity obtained by different models after adding ±5% random errors to Rrs at 443 nm and 486 nm (blue dots are matching dataset of measured data and satellite data). (a) X1 model; (b) X2 model

图 7. 渤黄海水体浊度的多年(2012—2018年)月平均分布图
Fig. 7. Monthly average distributions of water turbidity in Bohai and Yellow seas (2012—2018)


表 1lg T与lg Rrs不同波段组合之间的相关系数比较
Table1. Comparison of correlation coefficients between lg T and lg Rrs under different band combinations
|
表 2浊度反演模型的系数以及精度评价参数统计
Table2. Statistics of coefficients of turbidity inversion model and its accuracy evaluation parameters
| ||||||||||||||||||
丁梦娇, 丘仲锋, 张海龙, 李兆鑫, 毛颖. 基于NPP-VIIRS卫星数据的渤黄海浊度反演算法研究[J]. 光学学报, 2019, 39(6): 0601002. Mengjiao Ding, Zhongfeng Qiu, Hailong Zhang, Zhaoxin Li, Ying Mao. Inversion Algorithm for Turbidity of Bohai and Yellow Seas Based on NPP-VIIRS Satellite Data[J]. Acta Optica Sinica, 2019, 39(6): 0601002.


 PDF全文
PDF全文

